

Suppressing evolution in genetically engineered systems through repeated supplementation
- PMID: 33664781
- PMCID: PMC7896713
- DOI: 10.1111/eva.13119
Suppressing evolution in genetically engineered systems through repeated supplementation
Abstract
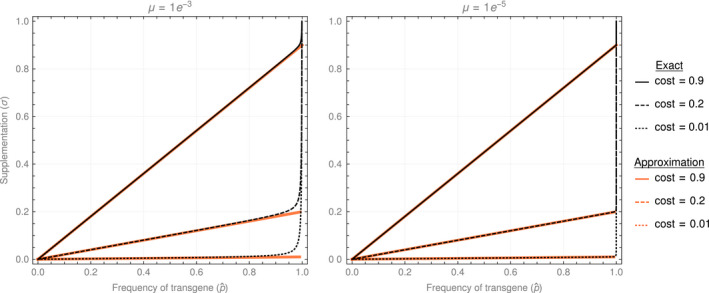
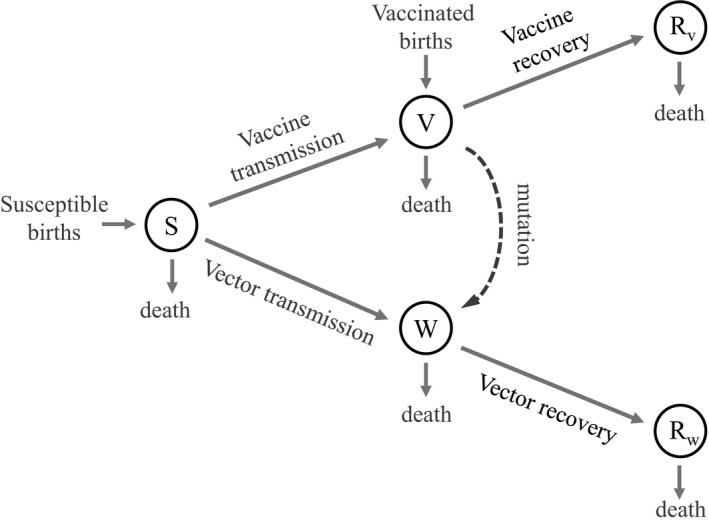
Genetically engineered organisms are prone to evolve in response to the engineering. This evolution is often undesirable and can negatively affect the purpose of the engineering. Methods that maintain the stability of engineered genomes are therefore critical to the successful design and use of genetically engineered organisms. One potential method to limit unwanted evolution is by taking advantage of the ability of gene flow to counter local adaption, a process of supplementation. Here, we investigate the feasibility of supplementation as a mechanism to offset the evolutionary degradation of a transgene in three model systems: a bioreactor, a gene drive, and a transmissible vaccine. In each model, continual introduction from a stock is used to balance mutation and selection against the transgene. Each system has its unique features. The bioreactor system is especially tractable and has a simple answer: The level of supplementation required to maintain the transgene at a frequency is approximately , where s is the selective disadvantage of the transgene. Supplementation is also feasible in the transmissible vaccine case but is probably not practical to prevent the evolution of resistance against a gene drive. We note, however, that the continual replacement of even a small fraction of a large population can be challenging, limiting the usefulness of supplementation as a means of controlling unwanted evolution.
Keywords: bioreactor; gene drive; gene flow; genetic engineering; swamping; transmissible vaccine.
© 2020 The Authors. Evolutionary Applications published by John Wiley & Sons Ltd.
Figures
Similar articles
-
Methods for measuring the evolutionary stability of engineered genomes to improve their longevity.Synth Biol (Oxf). 2021 Aug 23;6(1):ysab018. doi: 10.1093/synbio/ysab018. eCollection 2021. Synth Biol (Oxf). 2021. PMID: 34712842 Free PMC article.
-
Evolution and containment of transmissible recombinant vector vaccines.Evol Appl. 2019 Jun 12;12(8):1595-1609. doi: 10.1111/eva.12806. eCollection 2019 Sep. Evol Appl. 2019. PMID: 31462917 Free PMC article.
-
Evolution of Resistance Against CRISPR/Cas9 Gene Drive.Genetics. 2017 Feb;205(2):827-841. doi: 10.1534/genetics.116.197285. Epub 2016 Dec 10. Genetics. 2017. PMID: 27941126 Free PMC article.
-
Spatiotemporal Controllability and Environmental Risk Assessment of Genetically Engineered Gene Drive Organisms from the Perspective of European Union Genetically Modified Organism Regulation.Integr Environ Assess Manag. 2020 Sep;16(5):555-568. doi: 10.1002/ieam.4278. Epub 2020 May 27. Integr Environ Assess Manag. 2020. PMID: 32250054 Free PMC article. Review.
-
Transmissible cancers in an evolutionary context.Bioessays. 2016 Jul;38 Suppl 1:S14-23. doi: 10.1002/bies.201670904. Bioessays. 2016. PMID: 27417118 Review.
Cited by
-
Designing transmissible viral vaccines for evolutionary robustness and maximum efficiency.Virus Evol. 2021 Jan 25;7(1):veab002. doi: 10.1093/ve/veab002. eCollection 2021 Jan. Virus Evol. 2021. PMID: 33680502 Free PMC article.
References
-
- Aitken, S. N. , & Whitlock, M. C. (2013). Assisted gene flow to facilitate local adaptation to climate change. Annual Review of Ecology Evolution and Systematics, 44, 367–388.
-
- Anderson, R. , & May, R. (1979). Population biology of infectious diseases: Part I. Nature, 280, 361–367. - PubMed
-
- Bolnick, D. I. , & Nosil, P. (2007). Natural selection in populations subject to a migration load. Evolution, 61, 2229–2243. - PubMed
Associated data
Grants and funding
LinkOut - more resources
Full Text Sources
Other Literature Sources
