. 2020 Dec 14;14(2):588-606.
doi: 10.1111/eva.13143. eCollection 2021 Feb.

Population genomics and history of speciation reveal fishery management gaps in two related redfish species (Sebastes mentella and Sebastes fasciatus)

Affiliations

Population genomics and history of speciation reveal fishery management gaps in two related redfish species (Sebastes mentella and Sebastes fasciatus)

Laura M Benestan et al. Evol Appl. .

Abstract

Understanding the processes shaping population structure and reproductive isolation of marine organisms can improve their management and conservation. Using genomic markers combined with estimation of individual ancestries, assignment tests, spatial ecology, and demographic modeling, we (i) characterized the contemporary population structure, (ii) assessed the influence of space, fishing depth, and sampling years on contemporary distribution, and (iii) reconstructed the speciation history of two cryptic redfish species, Sebastes mentella and S. fasciatus. We genotyped 860 individuals in the Northwest Atlantic Ocean using 24,603 filtered single nucleotide polymorphisms (SNPs). Our results confirmed the clear genetic distinctiveness of the two species and identified three ecotypes within S. mentella and five populations in S. fasciatus. Multivariate analyses highlighted the influence of spatial distribution and depth on the overall genomic variation, while demographic modeling revealed that secondary contact models best explained inter- and intragenomic divergence. These species, ecotypes, and populations can be considered as a rare and wide continuum of genomic divergence in the marine environment. This acquired knowledge pertaining to the evolutionary processes driving population divergence and reproductive isolation will help optimizing the assessment of demographic units and possibly to refine fishery management units.

Keywords: Sebastes; demographic models; fishery management; population genomics; related species; spatial ecology.


Figures

FIGURE 1
FIGURE 1
Map of the 28 sampling sites of Sebastes mentella and S. fasciatus along the Northwest Atlantic. Delineation of the current management units specific to redfish species (i.e., Units 1 to 3) and NAFO divisions are presented. Each sampling site is represented by a black point, and adjacent colored circles represent genetic clusters detected at this site. A genetic cluster was indicated as detected when at least an individual shows at least 50% of ancestry to this genetic cluster. There are three ecotypes described in S. mentella: GSL (cyan), shallow (blue), and deep (dark blue). The unknown S. mentella genetic cluster is identified in light gray. There are five populations observed in S. fasciatus: I (purple), II (orange), III (red), IV (green), and IV (pink)
FIGURE 2
FIGURE 2
Population genomics analyses for inter‐ and intraspecific structure. Each individual is represented by a thin vertical line, which is partitioned into colored segments that represent the individual’s estimated ancestry into one of the genetic clusters observed using 24,603 SNPs. ADMIXTURE plots for (a) K = 2 for both species (n = 860), (b) K = 5 for S. fasciatus (n = 444), and (c) K = 4 for Sebastes mentella (n = 416). There are three ecotypes described in S. mentella: GSL (cyan), shallow (blue), and deep (dark blue). The unknown S. mentella genetic cluster is identified in light gray. There are five populations observed in S. fasciatus: I (purple), II (orange), III (red), IV (green), and IV (pink)
FIGURE 3
FIGURE 3
Assignment tests. Bar graph showing the percent of individuals correctly assigned for each sampling site and considering the three ecotypes and the five populations inferred from ADMIXTURE analyses in (a) Sebastes mentella and (b) S. fasciatus. Note that assignment tests were run by considering the genetic group inferred for each individual using the species‐specific ADMIXTURE analysis
FIGURE 4
FIGURE 4
Assignment success related to the number of markers used (from 1 to 24,219 SNPs) based on ranked FST values of SNPs and using THL (Training, Holdout, Leave‐one‐out) method in S. mentella GSL, S. mentella shallow, S. mentella deep, and Sebastes fasciatus
FIGURE 5
FIGURE 5
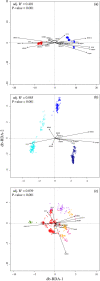
Db‐RDA ordination biplot (scaling 1), which preserves distances among objects and environmental variables for (a) 860 individuals, (b) 416 S. mentella individuals, and (c) 444 S. fasciatus individuals. (a) S. mentella is shown in blue and S. fasciatus in red. (b) There are three ecotypes described in S. mentella: GSL (cyan), shallow (blue), and deep (dark blue). The unknown S. mentella genetic cluster is identified in light gray. (c) There are five populations observed in S. fasciatus: I (purple), II (orange), III (red), IV (green), and IV (pink)
FIGURE 6
FIGURE 6
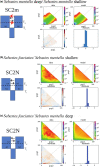
Observed best SC models (top panel) fitted to the folded site frequency spectrum (bottom panel) in the comparison between ecotypes (a) and between species (b and c). The suffix “2m” denotes heterogeneous migration and “2N” heterogeneous effective population size. AM = ancient migration. IM = isolation with migration, SC = secondary contacts, SI = strict isolation. All fittest models incorporate heterogeneous parameters, such as a heterogeneous rate of gene flow (2 m) and linked selection (2N). Each block corresponds to a population with effective population size of N1, N2, and θ. Horizontal dashed lines indicate the duration (Tsc) of the secondary contact period after the duration (Ts) of the allopatric period, while vertical dashed lines indicate change in effective size. Black arrows symbolize neutral gene flow, whereas red arrows symbolize heterogeneous introgression

References

    1. Alcala, N. , & Vuilleumier, S. (2014). Turnover and accumulation of genetic diversity across large time‐scale cycles of isolation and connection of populations. Proceedings of the Royal Society B: Biological Sciences, 281(1794), 20141369 10.1098/rspb.2014.1369 - DOI - PMC - PubMed
    1. Alexander, D. H. , & Lange, K. (2011). Enhancements to the ADMIXTURE algorithm for individual ancestry estimation. BMC Bioinformatics, 12, 246 10.1186/1471-2105-12-246 - DOI - PMC - PubMed
    1. Anderson, E. C. (2010). Assessing the power of informative subsets of loci for population assignment: Standard methods are upwardly biased. Molecular Ecology Resources, 10(4), 701–710. 10.1111/j.1755-0998.2010.02846.x - DOI - PubMed
    1. Atkinson, D. B. (1987). The redfish resources off Canada’s east coast, pp. 15–33. In Proceedings of the Lowel Wakefield Fisheries Symposium: International Rockfish Symposium, Anchorage, AK, Alaska Sea grant College program report 97‐2.
    1. Barton, N. , & Bengtsson, B. O. (1986). The barrier to genetic exchange between hybridizing populations. Heredity, 57(3), 357–376. 10.1038/hdy.1986.135 - DOI - PubMed