

Calcium phosphate engineered photosynthetic microalgae to combat hypoxic-tumor by in-situ modulating hypoxia and cascade radio-phototherapy
- PMID: 33664849
- PMCID: PMC7914342
- DOI: 10.7150/thno.55441
Calcium phosphate engineered photosynthetic microalgae to combat hypoxic-tumor by in-situ modulating hypoxia and cascade radio-phototherapy
Abstract
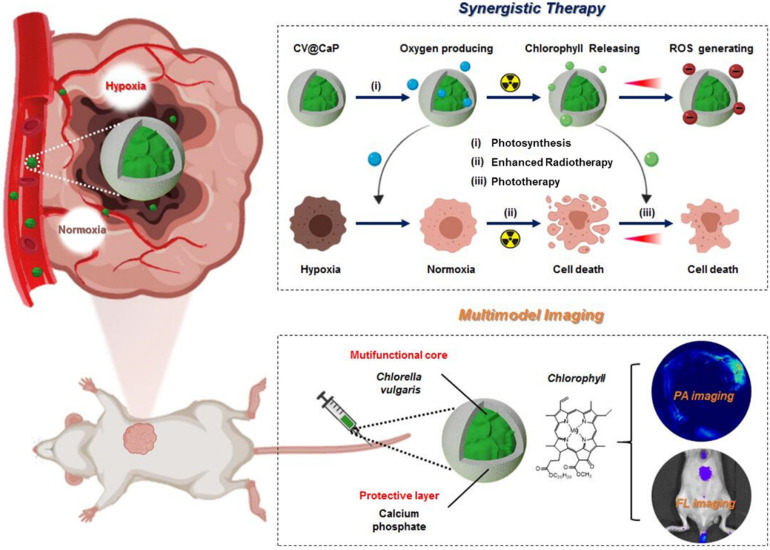
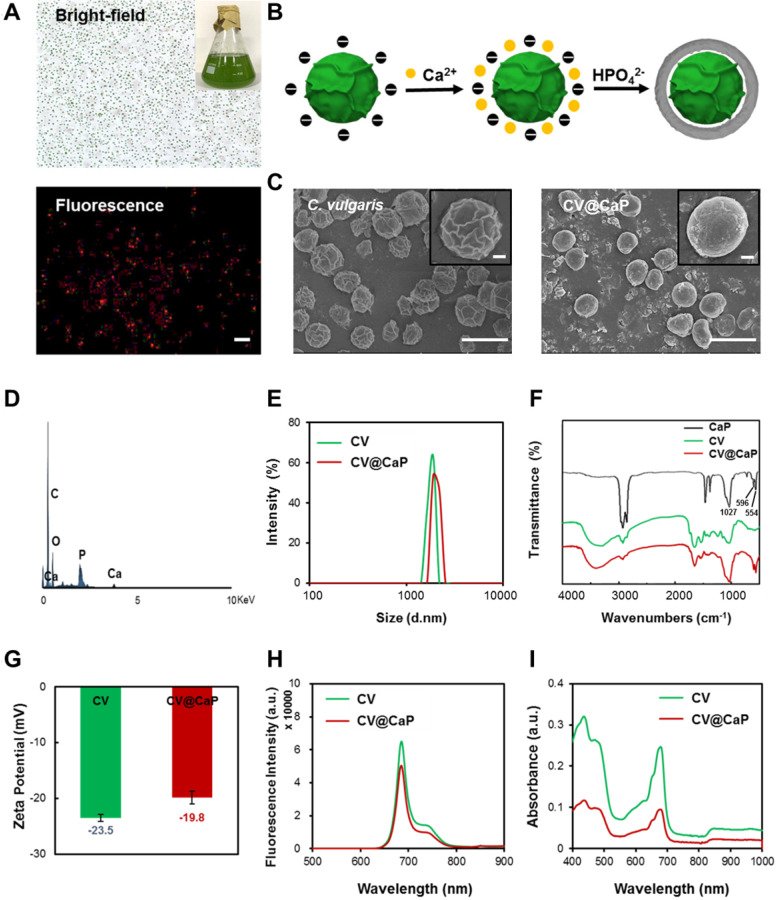
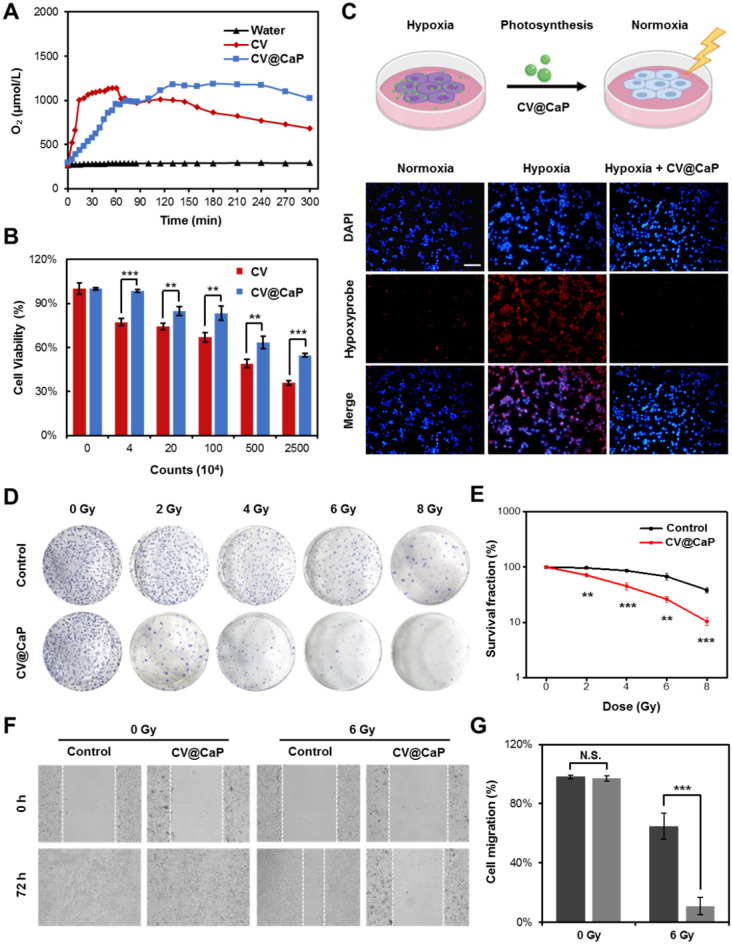
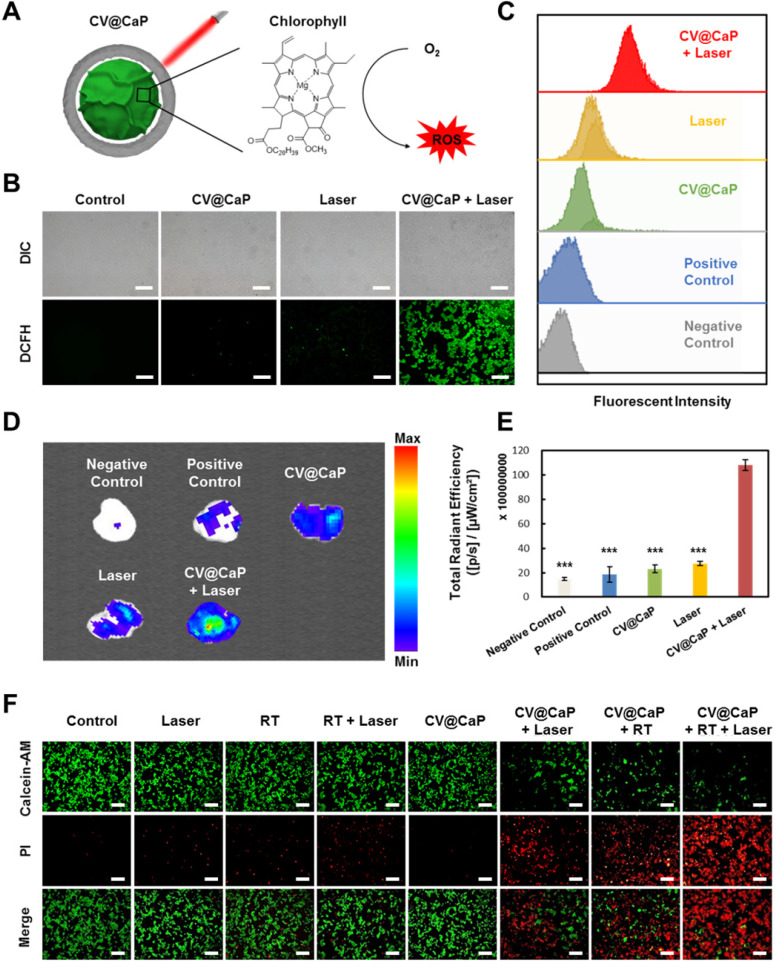
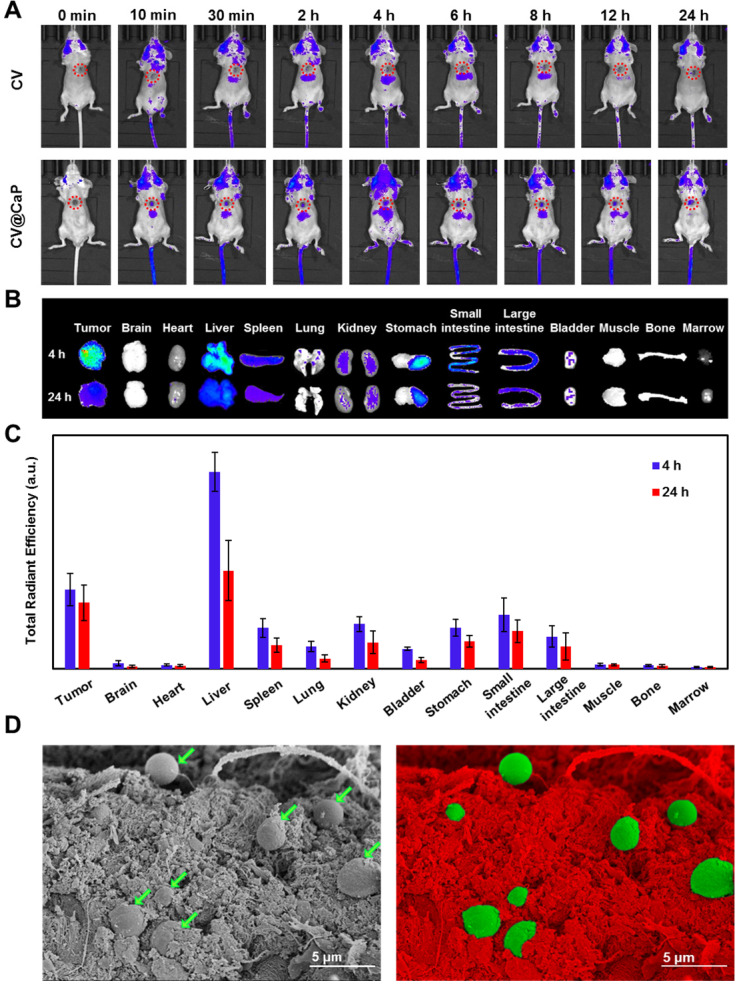
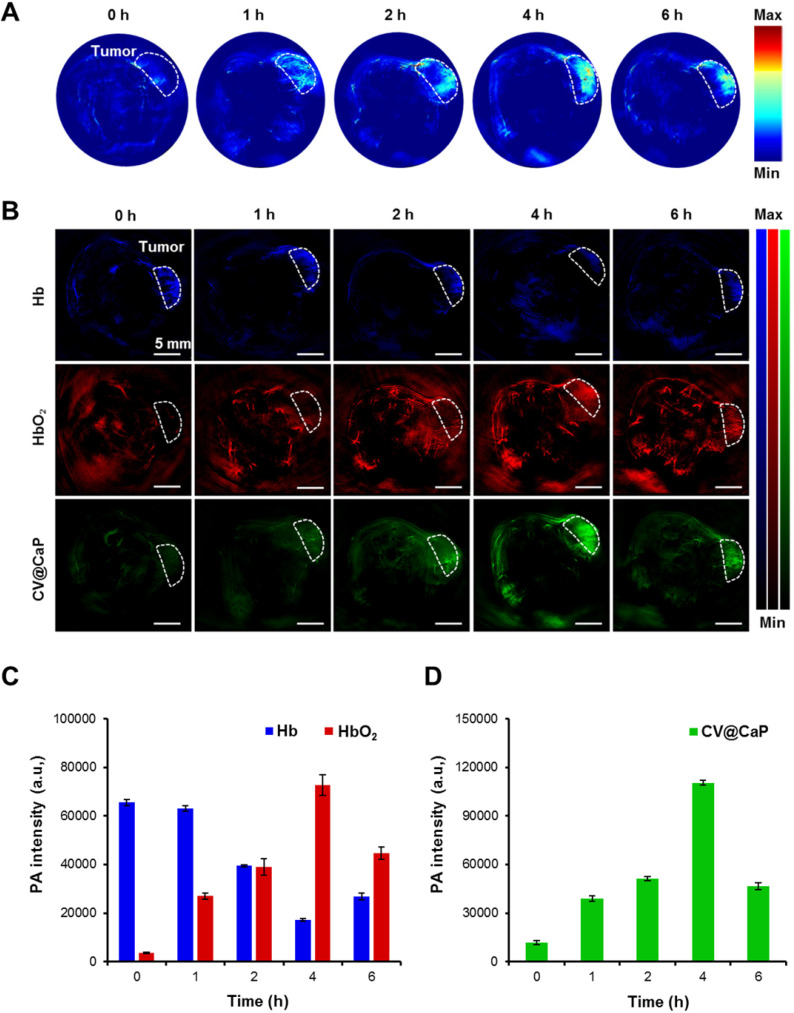
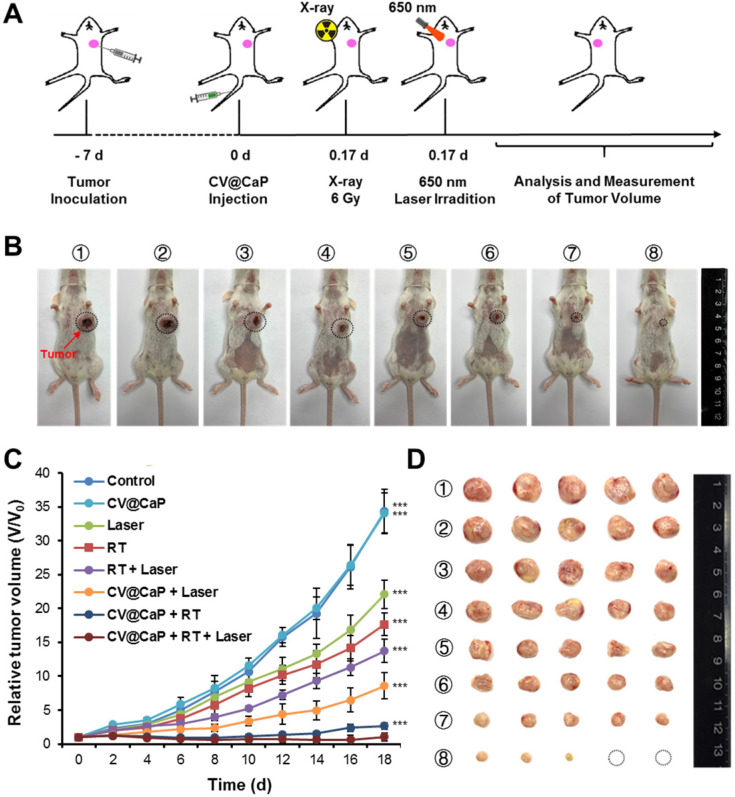
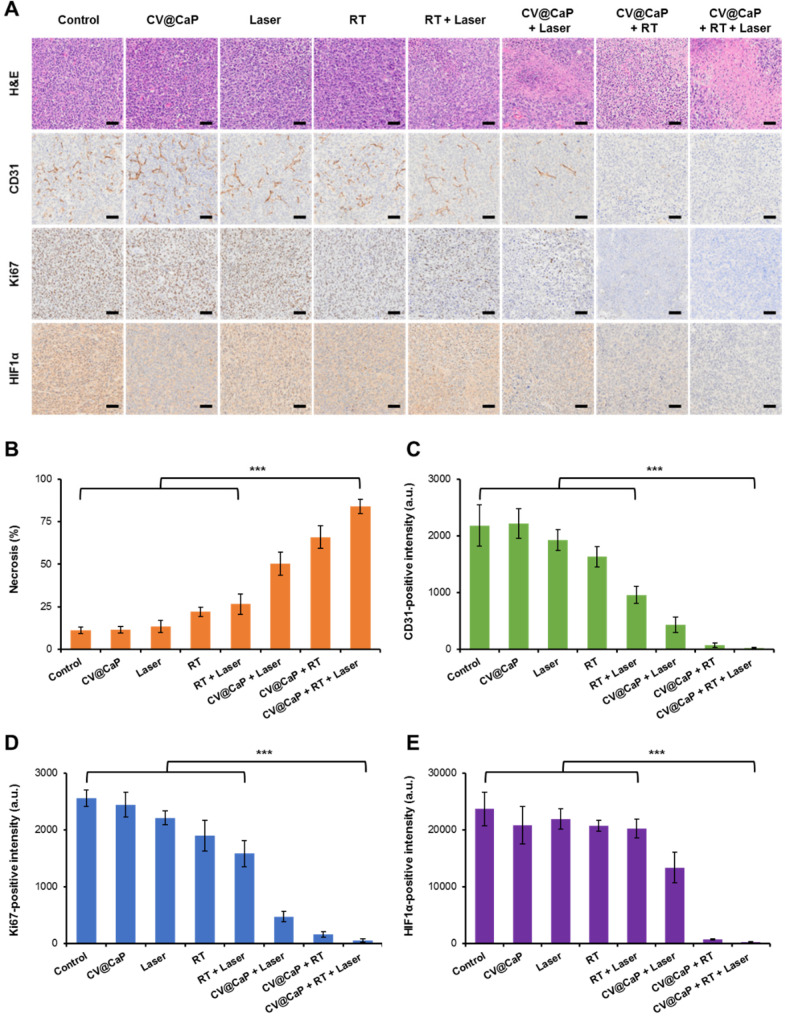
Rationale: Hypoxia is one of the crucial restrictions in cancer radiotherapy (RT), which leads to the hypoxia-associated radioresistance of tumor cells and may result in the sharp decline in therapeutic efficacy. Methods: Herein, living photosynthetic microalgae (Chlorella vulgaris, C. vulgaris), were used as oxygenators, for in situ oxygen generation to relieve tumor hypoxia. We engineered the surface of C. vulgaris (CV) cells with calcium phosphate (CaP) shell by biomineralization, to form a biomimetic system (CV@CaP) for efficient tumor delivery and in-situ active photosynthetic oxygenation reaction in tumor. Results: After intravenous injection into tumor-bearing mice, CV@CaP could remarkably alleviate tumor hypoxia by continuous oxygen generation, thereby achieving enhanced radiotherapeutic effect. Furthermore, a cascade phototherapy could be fulfilled by the chlorophyll released from photosynthetic microalgae combined thermal effects under 650 nm laser irradiation. The feasibility of CV@CaP-mediated combinational treatment was finally validated in an orthotropic breast cancer mouse model, revealing its prominent anti-tumor and anti-metastasis efficacy in hypoxic-tumor management. More importantly, the engineered photosynthetic microalgae exhibited excellent fluorescence and photoacoustic imaging properties, allowing the self-monitoring of tumor therapy and tumor microenvironment. Conclusions: Our studies of this photosynthetic microsystem open up a new dimension for solving the radioresistance issue of hypoxic tumors.
Keywords: Chlorella vulgaris; chlorophyll; photosynthetic microalgae; phototherapy; radiotherapy; tumor hypoxia.
© The author(s).
Conflict of interest statement
Competing Interests: The authors have declared that no competing interest exists.
Figures
Similar articles
-
Biomineralized Biohybrid Algae for Tumor Hypoxia Modulation and Cascade Radio-Photodynamic Therapy.ACS Appl Mater Interfaces. 2020 Oct 7;12(40):44541-44553. doi: 10.1021/acsami.0c14400. Epub 2020 Sep 29. ACS Appl Mater Interfaces. 2020. PMID: 32935973
-
Engineered algae: A novel oxygen-generating system for effective treatment of hypoxic cancer.Sci Adv. 2020 May 20;6(21):eaba5996. doi: 10.1126/sciadv.aba5996. eCollection 2020 May. Sci Adv. 2020. PMID: 32490207 Free PMC article.
-
Tumor-targeted nanoplatform for in situ oxygenation-boosted immunogenic phototherapy of colorectal cancer.Acta Biomater. 2020 Mar 1;104:188-197. doi: 10.1016/j.actbio.2020.01.012. Epub 2020 Jan 13. Acta Biomater. 2020. PMID: 31945508
-
Research progress on the biomedical application of microalgae.Zhejiang Da Xue Xue Bao Yi Xue Ban. 2021 Apr 25;50(2):261-266. doi: 10.3724/zdxbyxb-2021-0117. Zhejiang Da Xue Xue Bao Yi Xue Ban. 2021. PMID: 34137228 Free PMC article. Review. English.
-
Towards chlorocytes for therapeutic intravascular photosynthesis.Appl Microbiol Biotechnol. 2024 Oct 17;108(1):489. doi: 10.1007/s00253-024-13285-1. Appl Microbiol Biotechnol. 2024. PMID: 39417888 Free PMC article. Review.
Cited by
-
Regulation of Ion Homeostasis for Enhanced Tumor Radio-Immunotherapy.Adv Sci (Weinh). 2023 Nov;10(32):e2304092. doi: 10.1002/advs.202304092. Epub 2023 Sep 22. Adv Sci (Weinh). 2023. PMID: 37740415 Free PMC article.
-
Oxygen-releasing biomaterials for chronic wounds breathing: From theoretical mechanism to application prospect.Mater Today Bio. 2023 Jun 2;20:100687. doi: 10.1016/j.mtbio.2023.100687. eCollection 2023 Jun. Mater Today Bio. 2023. PMID: 37334187 Free PMC article. Review.
-
How Microalgae is Effective in Oxygen Deficiency Aggravated Diseases? A Comprehensive Review of Literature.Int J Nanomedicine. 2022 Jul 15;17:3101-3122. doi: 10.2147/IJN.S368763. eCollection 2022. Int J Nanomedicine. 2022. PMID: 35874112 Free PMC article. Review.
-
Algae: A Robust Living Material Against Cancer.Int J Nanomedicine. 2023 Sep 14;18:5243-5264. doi: 10.2147/IJN.S423412. eCollection 2023. Int J Nanomedicine. 2023. PMID: 37727650 Free PMC article. Review.
-
Engineered photoresponsive biohybrids for tumor therapy.Smart Med. 2023 Mar 10;2(2):e20220041. doi: 10.1002/SMMD.20220041. eCollection 2023 May. Smart Med. 2023. PMID: 39188274 Free PMC article. Review.
References
-
- Wang H, Mu X, He H, Zhang XD. Cancer radiosensitizers. Trends Pharmacol Sci. 2018;39:24–48. - PubMed
-
- Wilson WR, Brown JM. Exploiting tumour hypoxia in cancer treatment. Nat Rev Cancer. 2004;4:437–47. - PubMed
-
- Delaney G, Jacob S, Featherstone C, Barton M. The role of radiotherapy in cancer treatment. Cancer. 2005;104:1129–37. - PubMed
-
- Bristow RG, Hill RP. Hypoxia, DNA repair and genetic instability. Nat Rev Cancer. 2008;8:180–92. - PubMed
Publication types
MeSH terms
Substances
LinkOut - more resources
Full Text Sources
Other Literature Sources
Miscellaneous
