. 2021 Jan 30;11(8):3796-3812.
doi: 10.7150/thno.50907. eCollection 2021.

Impairment of type H vessels by NOX2-mediated endothelial oxidative stress: critical mechanisms and therapeutic targets for bone fragility in streptozotocin-induced type 1 diabetic mice

Affiliations

Impairment of type H vessels by NOX2-mediated endothelial oxidative stress: critical mechanisms and therapeutic targets for bone fragility in streptozotocin-induced type 1 diabetic mice

Xiao-Fan Hu et al. Theranostics. .

Abstract

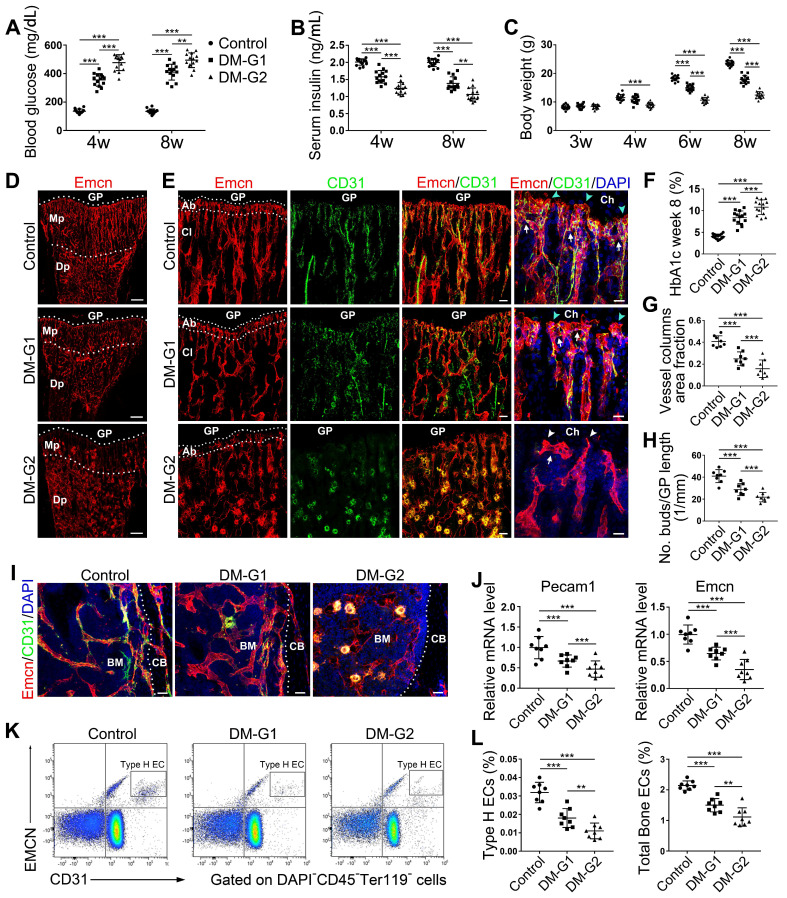
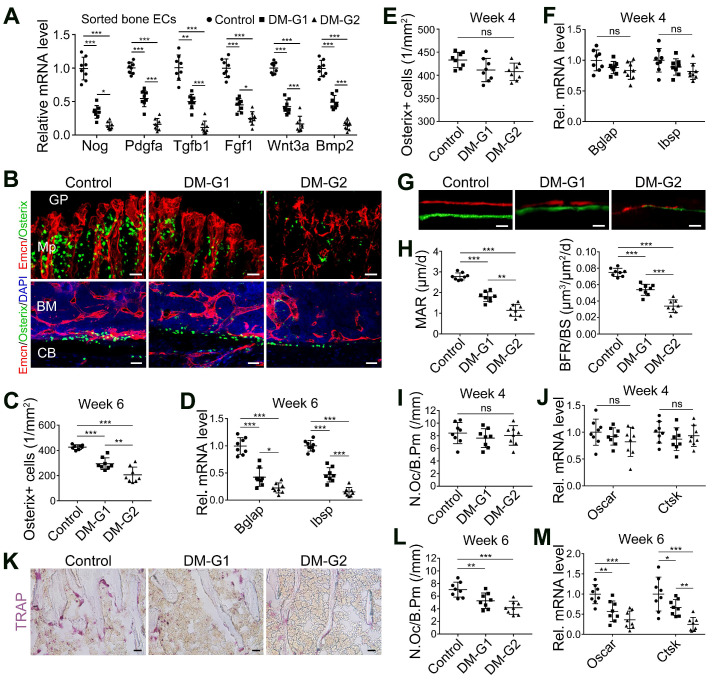
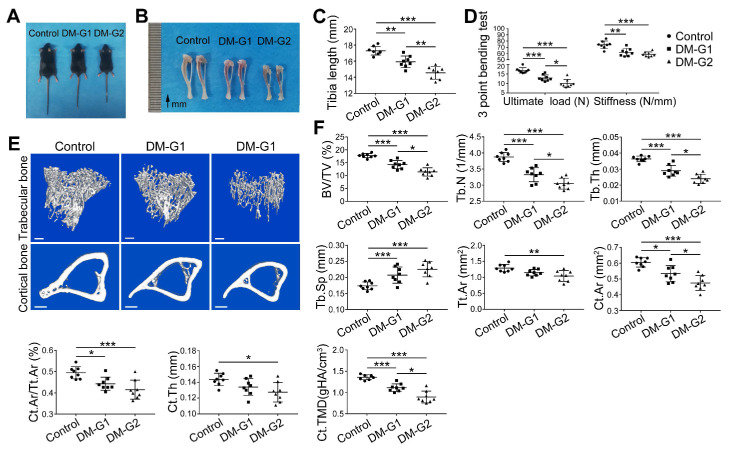
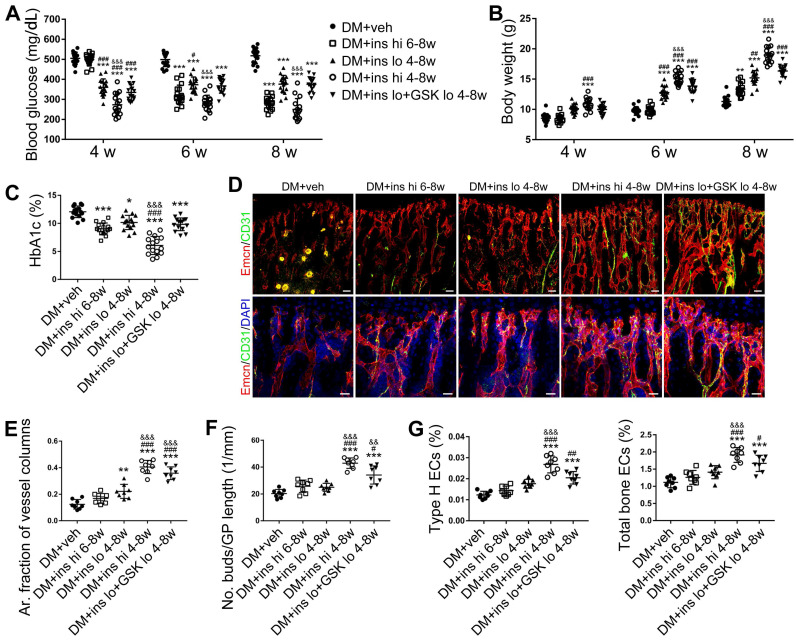
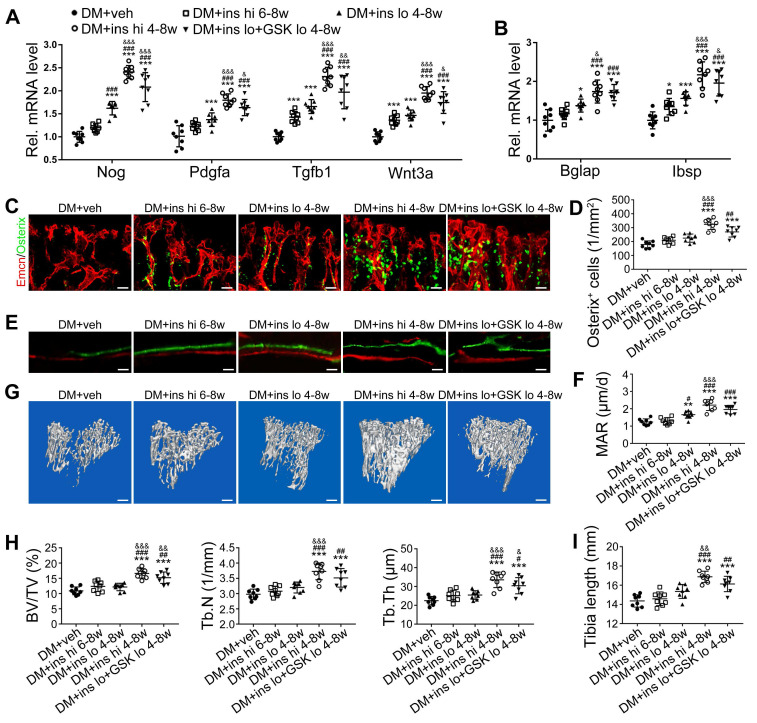
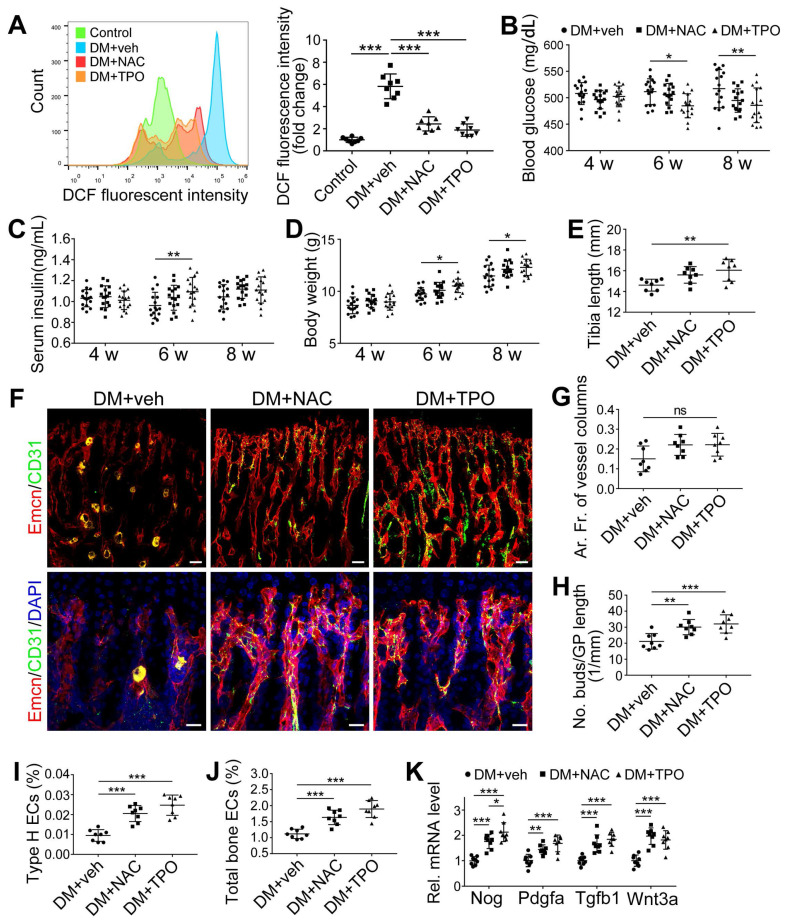
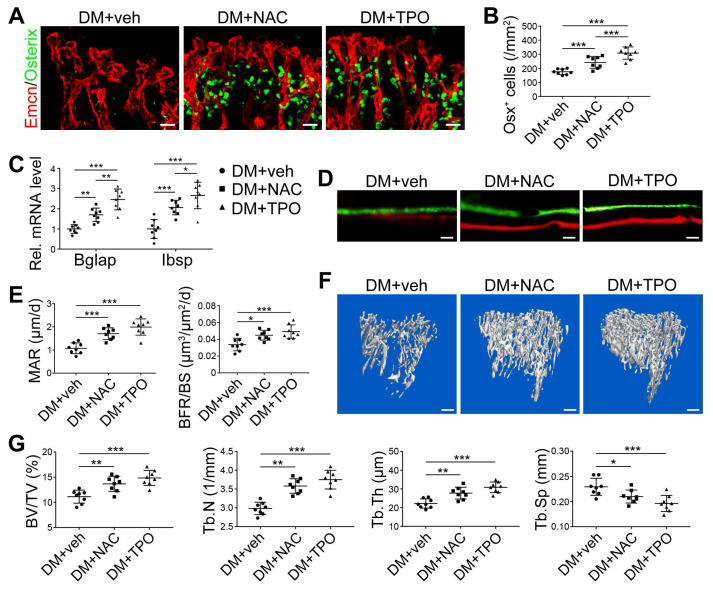
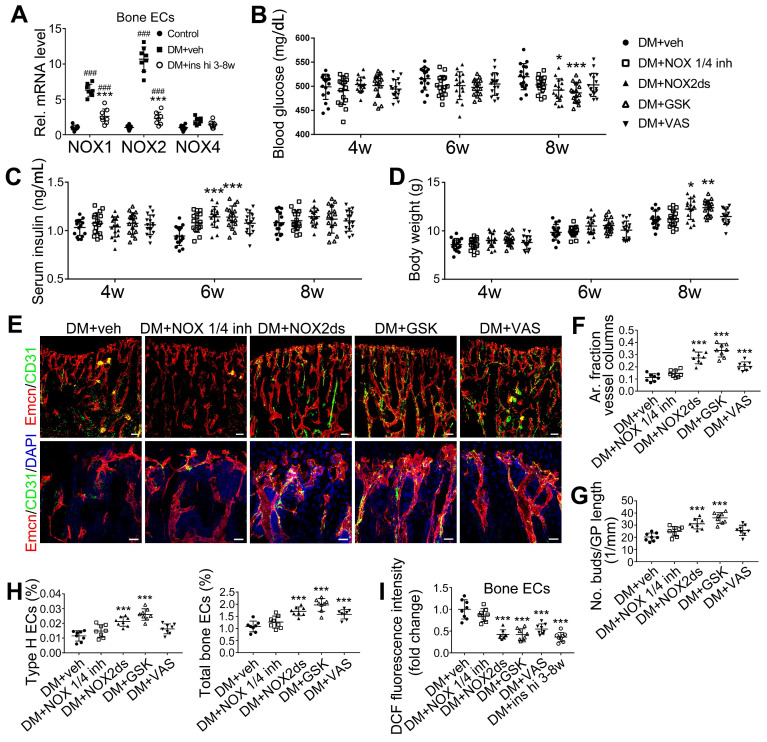
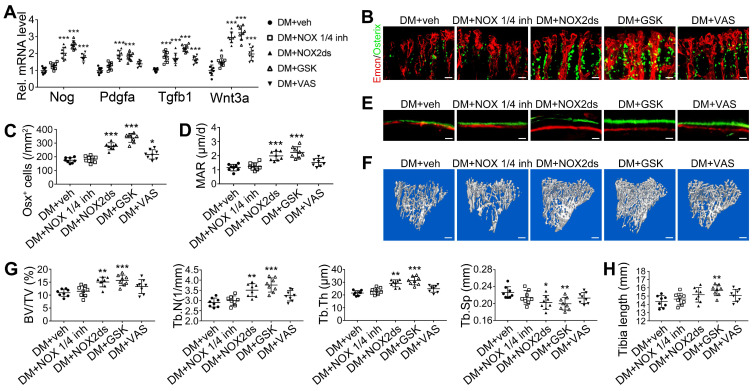
Rationale: Mechanisms underlying the compromised bone formation in type 1 diabetes mellitus (T1DM), which causes bone fragility and frequent fractures, remain poorly understood. Recent advances in organ-specific vascular endothelial cells (ECs) identify type H blood vessel injury in the bone, which actively direct osteogenesis, as a possible player. Methods: T1DM was induced in mice by streptozotocin (STZ) injection in two severity degrees. Bony endothelium, the coupling of angiogenesis and osteogenesis, and bone mass quality were evaluated. Insulin, antioxidants, and NADPH oxidase (NOX) inhibitors were administered to diabetic animals to investigate possible mechanisms and design therapeutic strategies. Results: T1DM in mice led to the holistic abnormality of the vascular system in the bone, especially type H vessels, resulting in the uncoupling of angiogenesis and osteogenesis and inhibition of bone formation. The severity of osteopathy was positively related to glycemic levels. These pathological changes were attenuated by early-started, but not late-started, insulin therapy. ECs in diabetic bones showed significantly higher levels of reactive oxygen species (ROS) and NOX 1 and 2. Impairments of bone vessels and bone mass were effectively ameliorated by treatment with anti-oxidants or NOX2 inhibitors, but not by a NOX1/4 inhibitor. GSK2795039 (GSK), a NOX2 inhibitor, significantly supplemented the insulin effect on the diabetic bone. Conclusions: Diabetic osteopathy could be a chronic microvascular complication of T1DM. The impairment of type H vessels by NOX2-mediated endothelial oxidative stress might be an important contributor that can serve as a therapeutic target for T1DM-induced osteopathy.

Keywords: Diabetic bone fragility; Endothelial damage; NADPH oxidase 2.; Oxidative stress; Type H vessels.


Conflict of interest statement

Competing Interests: The authors have declared that no competing interest exists.

Figures

Figure 1
Figure 1
Bone blood vessels are impaired by T1DM in a glycemic level-dependent manner. STZ injection at two different doses led to two different levels of glucose (A), insulin (B) and HbA1c (F) in blood as well as deceased body weight gain (C), namely two degrees of diabetes which were named as DM-G1 (diabetes mellitus-glycemic level 1) group and DM-G2 (glycemic level 2) group respectively. One week after modeling (day 28), blood vessels in tibia were examined. (D) Confocal images of Emcn (endomucin), a marker of endothelial cells (ECs), on the immunostained coronal plane sections of tibia from 4-week-old mice. Dashed lines mark the boundaries between growth plate (GP) and metaphysis (Mp) as well as between the column-like vessels in metaphysis and the highly branched sinusoids in diaphysis (Dp). Scale bar: 300 μm. (E) Confocal tile scan of 4-week-old tibia showing CD31+ (green) and Emcn+ (red) ECs in metaphysis. The magnification in the last column shows the specialized angiogenesis (of type H vessels) below the growth plate. At the vascular growth front in proximity of hypertrophic chondrocytes (Ch) in the growth plate, the bud-shaped protrusions (arrowheads) grow from the distal, loop-like vascular arches (arrows). Cyan arrowheads indicate normal buds and white arrowheads mark defective buds. Dashed lines indicate the distal vascular arches and buds (Ab) in the vessel columns (Cl). Diabetes mellitus (DM) causes structural abnormality and angiogenesis inhibition of type H vessels. Scale bar: 50 μm on the left and 20 μm on the right. Histomorphometry analysis of the images represented by (E) as the area fraction of vessel columns (G) and the number of vascular buds per growth plate length (H). (I) Confocal images of the vessels near cortical bone (CB) in the diaphysis of 4-week tibia. BM, bone marrow. Scale bar: 30 μm. (J) qPCR analysis of the mRNA levels of the two markers of type H ECs, Pecam1 (CD31) and Emcn. (K) Representative flow cytometry plots showing CD31highEmcnhigh ECs (type H ECs) in bone marrow cells. (L) Flow cytometric quantitation of type H and total ECs in 4-week-old tibia. Data analysis strategy in flow cytometry is diagrammed in Figure S1D. Data are present mean ± SD. (A)-(C) and (F), n = 15-16 per group; (G)-(L), n = 7-8 per group. *p < 0.05, **p < 0.01 and ***p < 0.001. One-way (F-L) or two-way (group × time, A-C) ANOVA followed by Tukey posttest analysis.
Figure 2
Figure 2
T1DM led to the uncoupling of angiogenesis and osteogenesis in a glycemic level-dependent manner and hindered both bone formation and resorption. (A) qPCR for the expression fold changes of known pro-osteogenic factors (normalized to Actb) in sorted bone ECs from 4-week-old tibia, relative to control group. (B) Confocal images show the Osterix+ (green) osteoprogenitors adjacent to Emcn+ (red) blood vessels in metaphysis (Mp, above) and diaphysis (below). GP, growth plate; CB, cortical bone; BM, bone marrow. Scale bar: 20 μm on the above and 30 μm on the below. Histomorphometric quantitation of Osterix+ cells in the metaphysis of immunostained tibia sections at week 4 (E) and week 6 (C). qPCR analysis of the mRNA expressions of two markers for mature osteoblasts, Bglap (bone gamma-carboxyglutamate protein) and Ibsp (integrin-binding sialoprotein), relative to vehicle control group at week 4 (F) and week 6 (D). Dynamic new bone formation was assessed by subcutaneous injection of calcein (green, at 4 weeks) and alizarin complexone (red, at 6 weeks) to label the mineralization in bone (G, microscopy images of tibia sections) as well as histomorphometric quantifications (H) of mineral apposition rate (MAR) and bone formation rate per bone surface (BFR/BS). (K) Images of TRAP-stained tibia sections. Histomorphometric analysis of the number of osteoclasts per bone perimeter (N.Oc/B.Pm.) at week 4 (I) and week 6 (L). Relative mRNA levels of the markers for osteoclast differentiation (Oscar, osteoclast associated receptor) and function (Ctsk, cathepsin K) at week 4 (J) and week 6 (M). TRAP, tartrate-resistant acid phosphatase. Scale bars: 20 µm in (G) and (K). n = 7-8 per group. *p < 0.05, **p < 0.01 and ***p < 0.001. One-way ANOVA followed by Tukey posttest analysis.
Figure 3
Figure 3
T1DM induced compromised quality of bone mass at 8 weeks. Comparisons of body size (A), tibia appearance (B) and tibia length (C). D) 3-pointing bending test evaluates the mechanical properties of mice tibia: ultimate load, the load at the maximum failure point; stiffness, the slope of the linear region of the load-deformation curve. (E) Representative images from micro-CT scanning show the trabecular and cortical bone mass in mice tibia: above, 3-dimensional (3D) reconstruction of the trabecular bone in proximal tibia; below, cross-section images of the middle diaphysis of tibia. Scale bars: 300 µm. (F) Quality parameters of the trabecular bone in proximal tibia metaphysis and the cortical bone in middle diaphysis from micro-CT analysis: BV/TV, trabecular bone volume fraction; Tb.N, trabecular number; Tb.Th, trabecular thickness; Tb.Sp, trabecular separation; Tt.Ar, Total cross-sectional area inside the periosteal envelope; Ct.Ar, cortical bone area; Ct.Ar/Tt.Ar, cortical bone area fraction; Ct.Th, average cortical thickness; Ct.TMD, Cortical tissue mineral density. n = 7-8 per group. *p < 0.05, **p < 0.01 and ***p < 0.001. One-way ANOVA followed by Tukey posttest analysis.
Figure 4
Figure 4
The effects of insulin therapy on the bone blood vessels of T1DM mice. Drug therapy with high dose (hi, 0.5 U/mouse) or low dose (lo, 0.05 U/mouse) of insulin (ins) or the combination of insulin and a relatively low dose of GSK2795039 (GSK, a NOX2 inhibitor, 2 mM) was conducted in two time courses: started immediately after the confirmation of DM and once per day in week 4 to 8 (4-8w); started at week 6 and performed once per day in week 6 to 8 (6-8w). The levels of blood glucose (A) and body weight (B) were examined at week 4, 6 and 8, with HbA1c (C) tested at week 8. (D) Confocal images of immunostained tibia sections show CD31+ (green) and Emcn+ (red) type H vessels in the metaphysis. Scale bar: 50 μm on the above and 20 μm on the below. Histomorphometric quantitation as the area fraction of vessel columns (E) and the number of vascular buds per growth plate length (F). (G) Flow cytometry quantification of type H ECs and total ECs in 8-week-old tibia. For drug treatments, T1DM model was induced by STZ injection at 80 mg/kg (namely DM-G2). (A)-(C), n = 15-16 per group; (E)-(G), n = 6-8 per group. *p < 0.05, **p < 0.01 and ***p < 0.001 vs. DM+veh group; #p < 0.05, ##p < 0.01 and ###p < 0.001 vs. DM+ins hi 6-8w group; &p < 0.05, &&p < 0.01 and &&&p < 0.001 vs. DM+ins lo 4-8w group. One-way or two-way ANOVA followed by Tukey posttest analysis.
Figure 5
Figure 5
The effects of insulin therapy on the angiogenesis-osteogenesis coupling and bone mass of T1DM mice. (A) qPCR analysis of the relative mRNA expressions of key cytokines mediating the coupling of angiogenesis and osteogenesis in 8-week-old tibia. The activities of osteoblastic cell lineage were evaluated by qPCR analysis of osteoblast markers (B) and histomorphological analysis of Osterix+ (green) osteoprogenitors around Emcn+ vessels (C and D). Analysis of new bone formation by fluorochrome labeling (E) of calcium deposition in tibia by subcutaneous injection of calcein (green) and alizarin complexone (red) and quantitation of mineral apposition rate (MAR) between week 4 and 6 (F). Micro-CT 3D reconstruction images (G) and quantitative parameters (H) of trabecular bone in 8-week-old tibia. (I) Tibia length at week 8. Scale bar: 20 μm in (C) and (E); 300 μm in (G). n = 6-8 per group. *p < 0.05, **p < 0.01 and ***p < 0.001 vs. DM+veh group; #p < 0.05, ##p < 0.01 and ###p < 0.001 vs. DM+ins hi 6-8w group; &p < 0.05, &&p < 0.01 and &&&p < 0.001 vs. DM+ins lo 4-8w group. One-way or two-way ANOVA followed by Tukey posttest analysis.
Figure 6
Figure 6
The effects of anti-oxidant treatments on the bone blood vessels of T1DM mice. T1D mice received intraperitoneal injection of an anti-oxidant, N-acetyl cysteine (NAC) or tempol (TPO), once every other day from week 4 through 8. (A) Flow cytometry analysis of the general ROS levels in the bone ECs from 8-week-old tibia by detecting intracellular DCF fluorescence. The levels of blood glucose (B), insulin (C) and body weight (D). (E) Tibia length at week 8. (F) Confocal images of CD31 (green) and Emcn (red) immunostained tibia sections show type H vessels in the tibia metaphysis at week 8. Scale bar: 50 μm on the above and 20 μm on the below. Histomorphometric quantitation of the area fraction of vessel columns (G) and the number of vascular buds per growth plate length (H). Flow cytometry quantification of type H ECs (I) and total ECs (J) in 8-week-old tibia. (K) qPCR analysis of the representative cytokines mediating the coupling of angiogenesis and osteogenesis in 8-week-old tibia. (B)-(D), n = 15-16 per group; other panels, n = 7-8 per group. *p < 0.05, **p < 0.01 and ***p < 0.001. One-way or two-way ANOVA followed by Tukey posttest analysis.
Figure 7
Figure 7
The effects of anti-oxidant treatments on the angiogenesis-osteogenesis coupling and bone mass of T1DM mice. The activities of osteoblastic lineage were evaluated by histomorphological analysis of Osterix+ (green) osteoprogenitors around Emcn+ vessels (A and B) and qPCR analysis of osteoblast markers (C). New bone formation was analyzed by fluorochrome labeling of bone mineralization (D) as well as histomorphometric analysis (E) of mineral apposition rate (MAR) and bone formation rate per bone surface (BFR/BS) between week 4 and 6. Micro-CT 3D reconstruction images (F) and quantitative parameters of trabecular bone (G) in 8-week-old tibia. Scale bar: 20 μm in (A) and (D); 300 μm in (F). n = 7-8 per group. *p < 0.05, **p < 0.01 and ***p < 0.001. One-way or two-way ANOVA followed by Tukey posttest analysis.
Figure 8
Figure 8
NOX2 contributes to the oxidative stress of bone ECs and the damage of angiogenesis-osteogenesis coupling. (A) qPCR analysis of the relative mRNA levels of three critical NOXs, involved in endothelial oxidative injuries, in the ECs in tibia metaphysis. T1DM mice were intraperitoneally injected with GKT137831 (NOX1/4 inhibitor) or one of the two NOX2 inhibitors, NOX2ds-tat (NOX2ds) and GSK2795039 (GSK), or VAS2870 (VAS, a pan-NOX inhibitor) once every two days from week 4 through 8. The levels of blood glucose (B), insulin (C) and body weight (D) during treatments were tested. (E) Confocal images of immunostained tibia sections show the CD31+Emcn+ type H vessels in the metaphysis at week 8. Scale bar: 50 μm on the above and 20 μm on the below. (F and G) Histomorphometric quantitation of the vessels in proximal tibia metaphysis. Flow cytometry quantification of type H ECs and total ECs in 8-week-old tibia (H). (I) Flow cytometry analysis of intracellular DCF fluorescence shows the ROS levels in the ECs in 8-week-old tibia. (B)-(D), n = 15-16 per group; other panels, n = 7-8 per group. ###p < 0.001 vs. Control group; *p < 0.05, **p < 0.01 and ***p < 0.001 vs. DM+veh group. One-way or two-way ANOVA followed by Tukey posttest analysis.
Figure 9
Figure 9
The effects of NOX inhibitors on the angiogenesis-osteogenesis coupling and bone mass of T1DM mice. (A) qPCR analysis of representative key cytokines mediating the coupling of angiogenesis and osteogenesis in 8-week-old tibia. Osterix+ (green) osteoprogenitors around vessels in the metaphysis (B) were semi-quantified (C). New bone formation was analyzed by fluorochrome labeling (E) with calcein (green) and alizarin complexone (red) as well as the mineral apposition rate (MAR) between week 4 and 6 (D). (F and G) The bone mass quality of tibia was analyzed by micro-CT scanning at week 8. (H) Tibia length at week 8. Scale bar: 20 μm in (B) and (E); 300 μm in (F). n = 7-8 per group. *p < 0.05, **p < 0.01 and ***p < 0.001 vs. DM+veh group. One-way or two-way ANOVA followed by Tukey posttest analysis.

Similar articles

Cited by

References

    1. Napoli N, Chandran M, Pierroz DD, Abrahamsen B, Schwartz AV, Ferrari SL. et al. Mechanisms of diabetes mellitus-induced bone fragility. Nat Rev Endocrinol. 2017;13:208–19. - PubMed
    1. Sellmeyer DE, Civitelli R, Hofbauer LC, Khosla S, Lecka-Czernik B, Schwartz AV. Skeletal Metabolism, Fracture Risk, and Fracture Outcomes in Type 1 and Type 2 Diabetes. Diabetes. 2016;65:1757–66. - PMC - PubMed
    1. Chen SC, Shepherd S, McMillan M, McNeilly J, Foster J, Wong SC. et al. Skeletal Fragility and Its Clinical Determinants in Children With Type 1 Diabetes. J Clin Endocrinol Metab. 2019;104:3585–94. - PubMed
    1. Weber DR, Schwartz G. Epidemiology of Skeletal Health in Type 1 Diabetes. Curr Osteoporos Rep. 2016;14:327–36. - PMC - PubMed
    1. Beckman JA, Creager MA. Vascular Complications of Diabetes. Circ Res. 2016;118:1771–85. - PubMed

Publication types

MeSH terms