. 2021 Feb 6;11(8):3839-3852.
doi: 10.7150/thno.53749. eCollection 2021.

Lactate-induced M2 polarization of tumor-associated macrophages promotes the invasion of pituitary adenoma by secreting CCL17

Affiliations

Lactate-induced M2 polarization of tumor-associated macrophages promotes the invasion of pituitary adenoma by secreting CCL17

Anke Zhang et al. Theranostics. .

Abstract

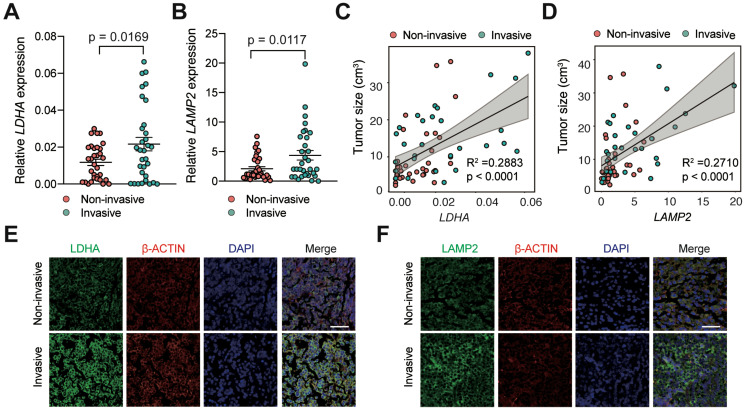
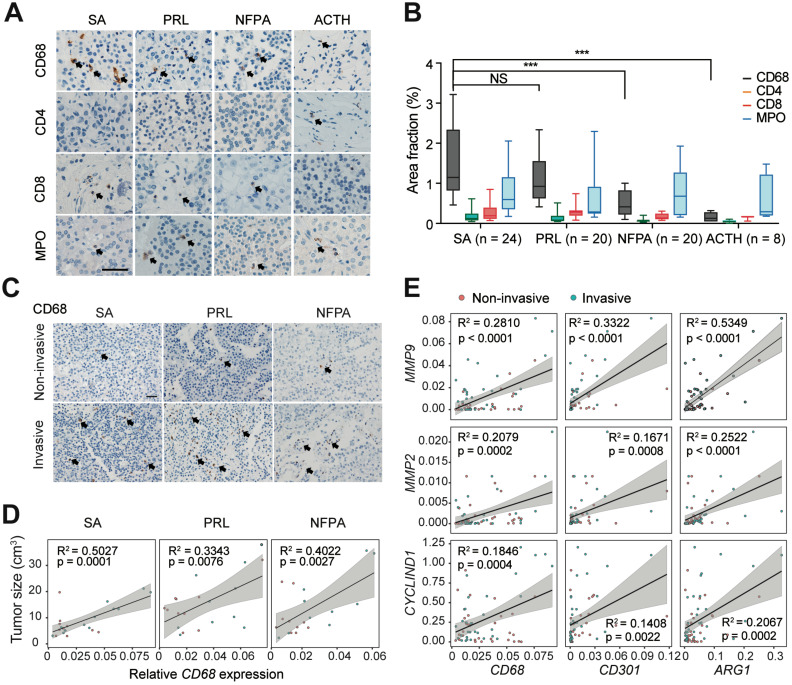
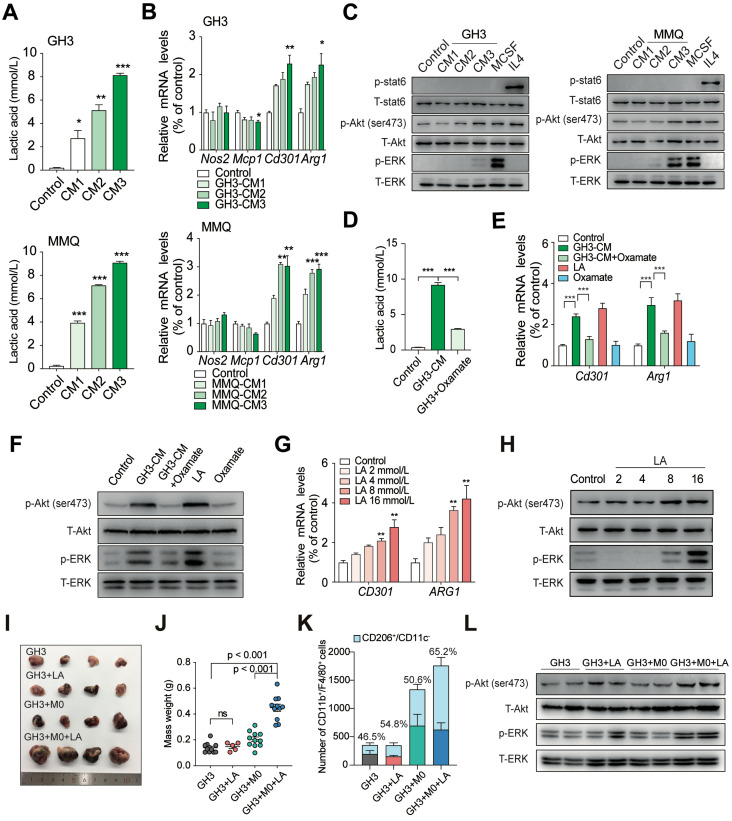
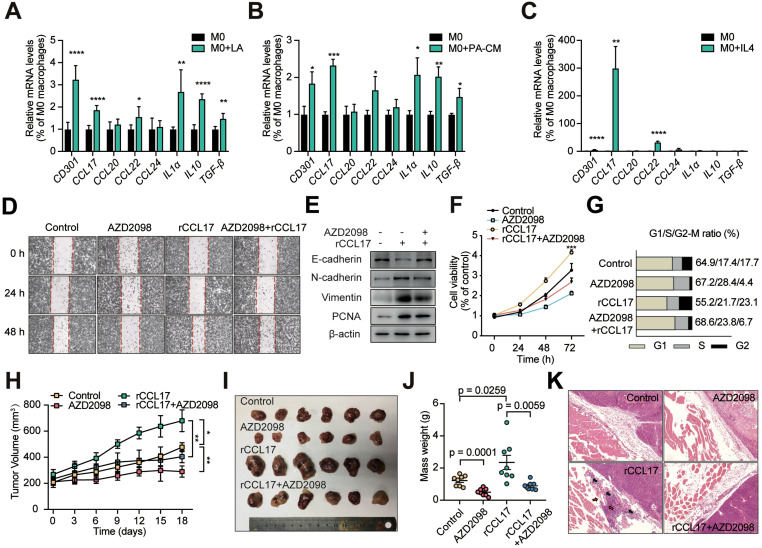
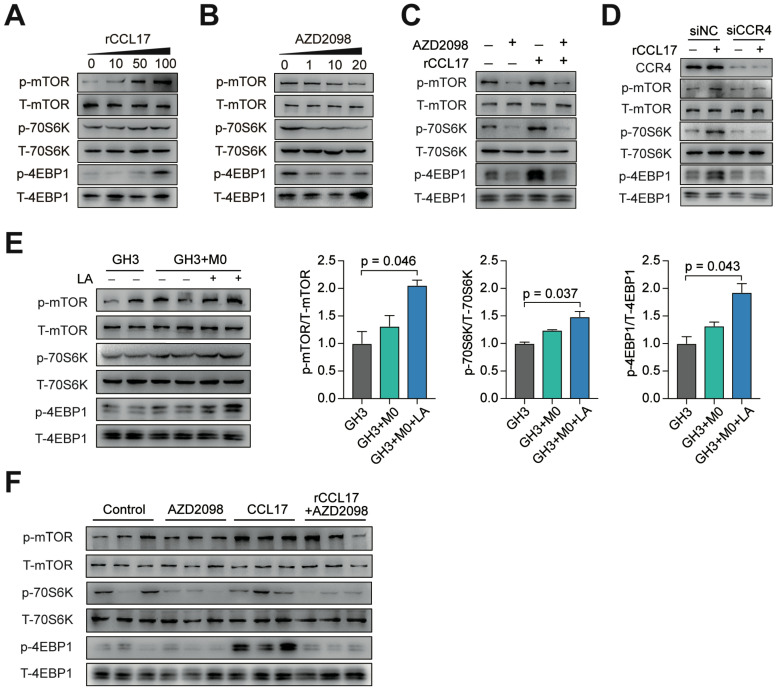
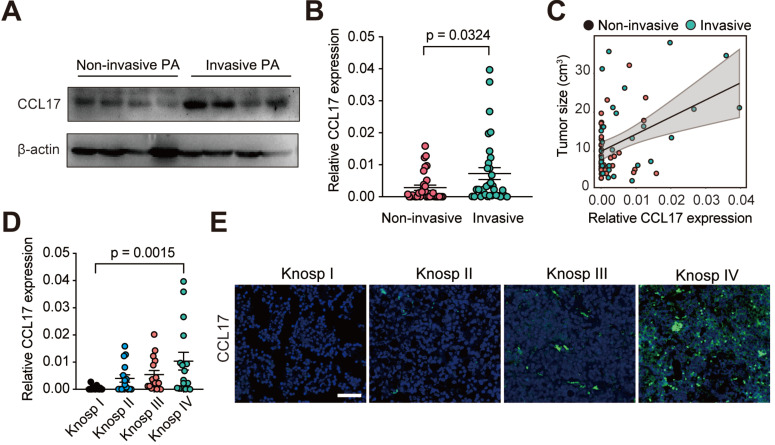
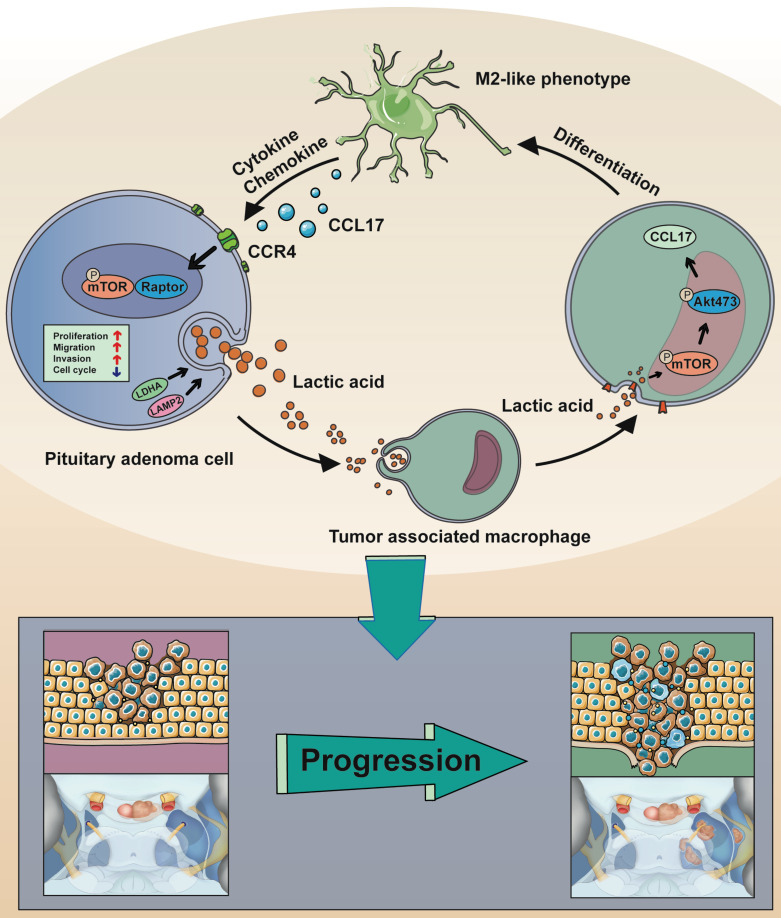
Background: Lactate greatly contributes to the regulation of intracellular communication within the tumor microenvironment (TME). However, the role of lactate in pituitary adenoma (PA) invasion is unclear. In this study, we aimed to clarify the effects of lactate on the TME and the effects of TME on PA invasion. Methods: To explore the correlation between TME acidosis and tumor invasion, LDHA and LAMP2 expression levels were quantified in invasive (n = 32) and noninvasive (n = 32) PA samples. The correlation between immune cell infiltration and tumor invasion was evaluated in 64 PAs. Critical chemokine and key signaling pathway components were detected by qPCR, Western blotting, siRNA knockdown, and specific inhibitors. The functional consequences of CCR4 signaling inhibition were evaluated in vitro and in vivo. Results: Lactate was positively associated with PA invasion. Of the 64 PA tissues, invasive PAs were related to high infiltration of M2-like tumor-associated macrophages (TAMs) (P < 0.05). Moreover, lactate secreted from PA cells facilitated M2 polarization via the mTORC2 and ERK signaling pathways, while activated TAMs secreted CCL17 to promote PA invasion via the CCL17/CCR4/mTORC1 axis. According to univariate analysis of clinical data, high CCL17 expression was associated with larger tumor size (P = 0.0438), greater invasion (P = 0.0334), and higher susceptibility to postoperative recurrence (P = 0.0195) in human PAs. Conclusion: This study illustrates the dynamics between PA cells and immune TME in promoting PA invasion via M2 polarization. CCL17 levels in the TME are related to the PA invasiveness and clinical prognosis, and the CCL17/CCR4/mTOCR1 axis may serve as potential therapeutic targets for Pas.

Keywords: CCL17; lactate acid; mTOR; macrophages; pituitary adenoma.


Conflict of interest statement

Competing Interests: The authors have declared that no competing interest exists.

Figures

Figure 1
Figure 1
Lactate and TME acidosis positively correlated with PAs invasion. A and B, Expression levels of (A) LDHA and (B) LAMP2 genes in invasive PA samples (n = 32) versus noninvasive samples (n = 32). C and D, Correlation of tumor size with (C) LDHA and (D) LAMP2 expression levels (n = 64). E and F, Representative immunofluorescence images of human PA samples co-stained with (E) LDHA or (F) LAMP2 (green) and β-Actin (red) demonstrated more lactate production and greater TME acidosis in invasive PAs compared with noninvasive PAs. Cell nuclei were counterstained with DAPI. Original magnification, ×200. Scale bar, 50 µm. All t-tests were two-tailed. Mean ± SEM.
Figure 2
Figure 2
M2-like TAMs are positively associated with PAs invasion. A and B, Representative images (A) and quantitation of staining percent (B) of human SAs, PRLs, NFPAs, and ACTH adenomas stained with CD68, CD4, CD8, and MPO. Scale bar = 50 µm. (SAs, n = 24; PRLs, n = 20; NFPAs, n = 20; and ACTH adenomas, n = 8). Positive cells are indicated with black arrowheads. Original magnification, ×200. Scale bars, 50 µm. Arrow indicates positive cells. C, Representative images of SA, PRL, and NFPA samples stained with CD68 in invasive PAs versus noninvasive PAs. Positive cells are indicated with black arrowheads. Original magnification, ×200. Scale bars, 50 µm. D, Correlation between CD68 expression levels and tumor size in human SAs, PRLs, and NFPAs. E, mRNA expression of MMP2, MMP9, and CyclinD1 correlated with M2-like TAM markers of (CD68, CD301 and CD206). All t-tests were two-tailed. Mean ± SEM. NS, no significance. *P < 0.05, **P < 0.01, and ***P < 0.001. SAs, somatotroph adenomas; PRLs, prolactinomas; NFPAs, non-functioning pituitary adenomas; ACTH adenomas, ACTH secreting adenomas.
Figure 3
Figure 3
Lactic acid induces the M2-like polarization of macrophages in PA. A, Concentration of lactic acid in CM from GH3 or MMQ cells. B, Quantification of Nos2, Mcp1, Cd301 and Arg1 mRNA expression in BMDMs stimulated with CM from GH3 and MMQ cells for 24 h. C, Western blot analysis of STAT6, Akt (ser473), and ERK in BMDMs treated with GH3 or MMQ cell-derived CM, M-CSF (10 ng/ml), or IL4 (10 ng/ml) for 15 min. D, Concentration of lactic acid in CM from oxamate-treated or untreated PA cells. E, Quantification of Cd301 and Arg1 mRNA expression in BMDMs stimulated with lactic acid/oxamate alone, or CM from oxamate-treated PA cells or CM from PA cells for 24 h. F, Western blot analysis of Akt (ser473) and ERK in BMDMs stimulated with GH3 or MMQ cell-derived CM or CM from oxamate-treated GH3 and MMQ cells for 15 min. G, Quantification of CD301 and ARG1 mRNA expression in THP1 cells treated with lactic acid at indicated concentration for 24 h. H, Western blot analysis of Akt (ser473) and ERK in THP1 cells treated with lactic acid at indicated concentration for 15 min. I, Representative images showing tumors harvested from mice bearing tumors in the GH3, GH3+LA, GH3+M0, and GH3+M0+LA group. J, Weight of mice bearing tumors in the GH3, GH3+LA, GH3+M0, and GH3+M0+LA groups. K, Stacking bar chart of the number of infiltrated CD11b+/F4/80+ and CD11b+/F4/80+/CD206+/CD11c- cells in harvested tumors from the GH3, GH3+LA, GH3+M0, and GH3+M0+LA groups. L, Western blot analysis of Akt (ser473), and ERK in tumor tissues from mice in the GH3, GH3+M0, and GH3+M0+LA groups. *P < 0.05, **P < 0.01, and ***P < 0.001.
Figure 4
Figure 4
CCL17 derived from lactate-activated TAMs mediates the invasion of PAs through binding to CCR4. A-C, Quantification of various TAM-derived chemokines and cytokines in PMA-treated THP1 cells stimulated with lactic acid (A), CM from human primary PA cells (B), or IL4 (10 ng/ml) (C) for 24 h. D, Representative images of wound-healing assay using GH3 cells in the presence or absence of CCL17 (50 ng/ml), AZD2098 (20 µM), or combination. E, PCNA and EMT biomarker protein expression in GH3 cells under stimulation with CCL17, AZD2098, or combination for 24 h. F, Proliferation of GH3 cells following 24, 48, and 72 h stimulation under CCL17, AZD2098, or combination. G, Cell cycle assays in GH3 cells in the presence or absence of CCL17, AZD2098, or combination. H, Tumor growth curve in tumors derived from NOD/SCID tumor-bearing mice treated with PBS, AZD2098 (1.5 mg/kg), CCL17 (0.1 µg/kg), or combination. I, Representative images and J, mass weight of tumors derived from NOD/SCID tumor-bearing mice treated with PBS, AZD2098, CCL17, or combination. K, HE staining of edge region of tumor and muscle tissues derived from the PBS, AZD2098, CCL17, or combination group. All t-tests were two-tailed. Mean ± SEM. *P < 0.05, **P < 0.01, and ***P < 0.001.
Figure 5
Figure 5
The CCL17/CCR4 axis promotes tumor invasion via the mTORC1 signaling pathway. A and B, Phosphorylation level of mTOR, 4EBP1, and 70S6K in GH3 cells following treatment with the indicated concentration of CCL17 (A) or AZD2098 (B) for 30 min. C, Western blot analysis of the activation of the mTORC1 signal pathway in GH3 cells with or without exposure to CCL17 (50 ng/ml) following co-treatment with AZD2098 (20 µmol/ml) for 30 min. D, Western blot analysis of the phosphorylation level of mTOR, 4EBP1, and 70S6K in GH3 cells transfected with control siRNA (siNC) or CCR4 siRNA (siCCR4) followed by treatment with or without rCCL17, respectively, for 30 min. E, Representative and quantification of the Western blot analysis of the phosphorylation levels of mTOR, 4EBP1, and 70S6K in in tumor tissues from mice in the GH3, GH3+M0, and GH3+M0+LA groups. F, Western blot analysis of the phosphorylation level of mTOR, 4EBP1, and 70S6K in tumor tissues from NOD/SCID tumor-bearing mice treated with PBS, AZD2098, CCL17, or combination. All t-tests were two-tailed. Mean ± SEM.
Figure 6
Figure 6
CCL17 is positively associated with tumor progression in human PAs. A, Western blot analysis of CCL17 expression in non-invasive PAs versus invasive PAs. B, CCL17 mRNA expression levels in the non-invasive group (n = 32) and invasive group (n = 32). C, CCL17 expression correlated with tumor size in samples from PA patients (n = 64). D and E, mRNA expression (D) and immunofluorescence (E) of CCL17 in human PA tissue samples according to Knosp grade classification. Original magnification, ×200. Scale bars, 50 µm. All t-tests were two-tailed. Mean ± SEM.
Figure 7
Figure 7
Schematic model showing the mechanism of lactate-mediated crosstalk between PA cells and tumor associated macrophages promoting tumor invasion. Overproduction of lactate in PA cells may contribute to malignant-like transformation at the early stage of PA formation. Lactate secreted by PA cells promote TAMs in the microenvironment towards M2 phenotype polarization via the mTORC2 and ERK1/2 pathways. In return, the CCL17 chemokine secreted by lactate-induced M2-like TAMs binds to its cognate receptor CCR4 on PA cells, thereby activating PA cells proliferation and invasion via the mTORC1 pathway.

Similar articles

Cited by

References

    1. Molitch ME. Diagnosis and Treatment of Pituitary Adenomas: A Review. JAMA. 2017;317:516–24. - PubMed
    1. Di Ieva A, Rotondo F, Syro LV, Cusimano MD, Kovacs K. Aggressive pituitary adenomas-diagnosis and emerging treatments. Nat Rev Endocrinol. 2014;10:423–35. - PubMed
    1. Spill F, Reynolds DS, Kamm RD, Zaman MH. Impact of the physical microenvironment on tumor progression and metastasis. Curr Opin biotechnol. 2016;40:41–8. - PMC - PubMed
    1. Ippolito L, Morandi A, Giannoni E, Chiarugi P. Lactate: A Metabolic Driver in the Tumour Landscape. Trends Biochem Sci. 2019;44:153–66. - PubMed
    1. Deng F, Zhou R, Lin C, Yang S, Wang H, Li W. et al. Tumor-secreted dickkopf2 accelerates aerobic glycolysis and promotes angiogenesis in colorectal cancer. Theranostics. 2019;9:1001–14. - PMC - PubMed

Publication types

MeSH terms