. 2021 Feb 4:23:1191-1203.
doi: 10.1016/j.omtn.2021.01.031. eCollection 2021 Mar 5.

Osteoclast-derived small extracellular vesicles induce osteogenic differentiation via inhibiting ARHGAP1

Affiliations

Osteoclast-derived small extracellular vesicles induce osteogenic differentiation via inhibiting ARHGAP1

Mengmeng Liang et al. Mol Ther Nucleic Acids. .

Abstract

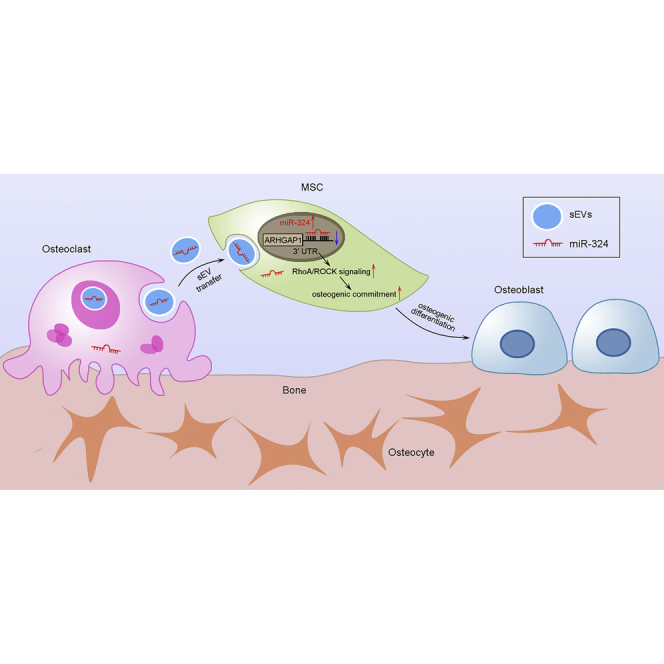
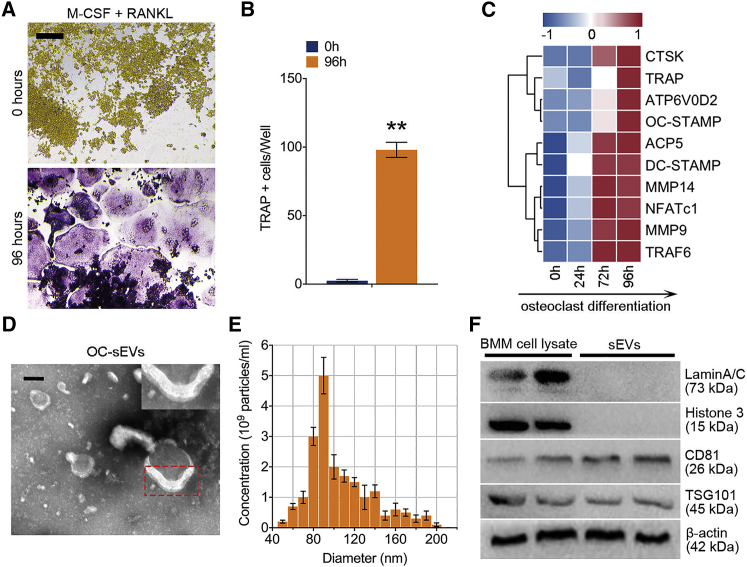
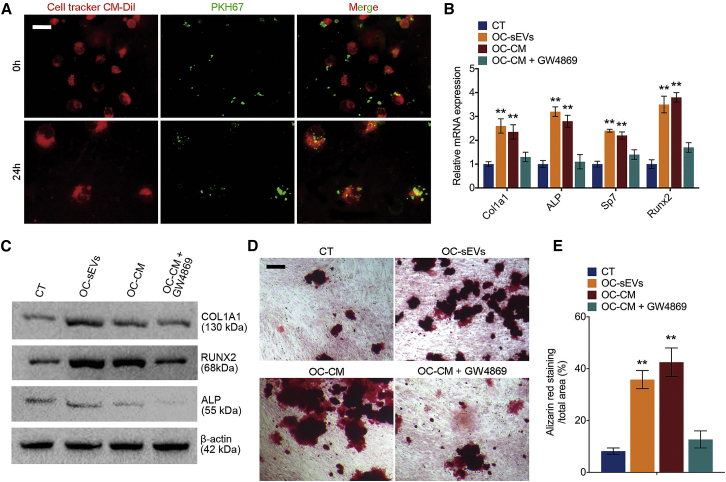
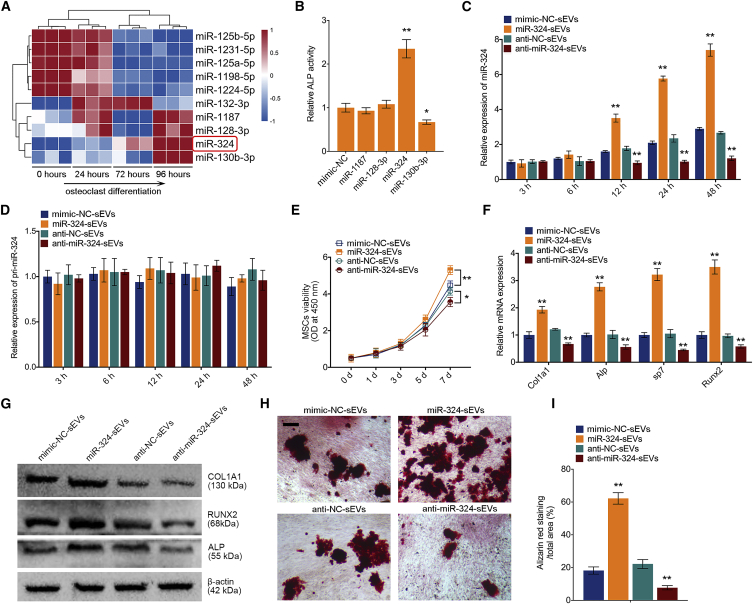
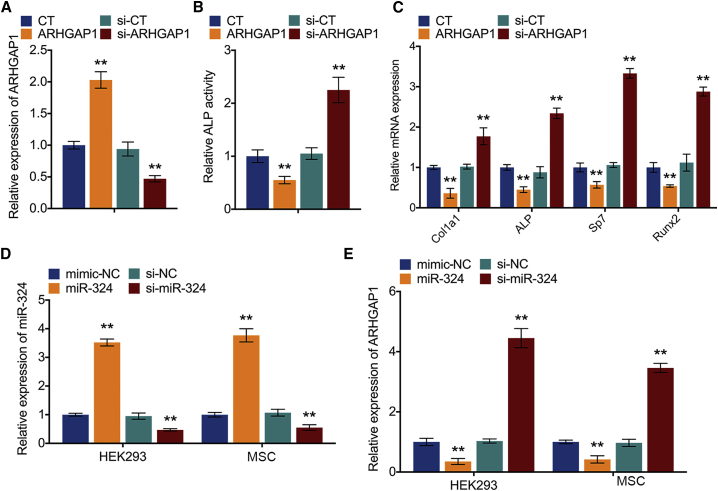
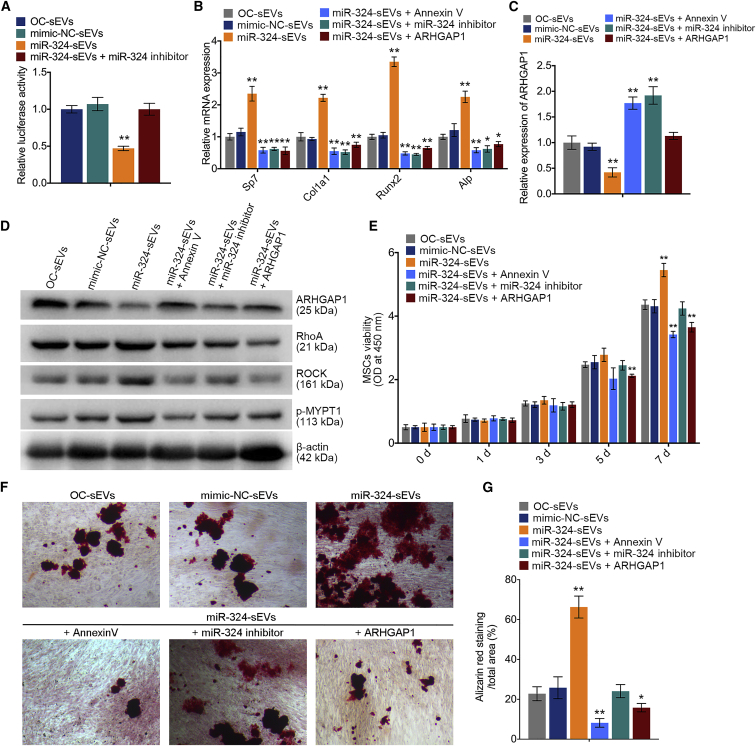
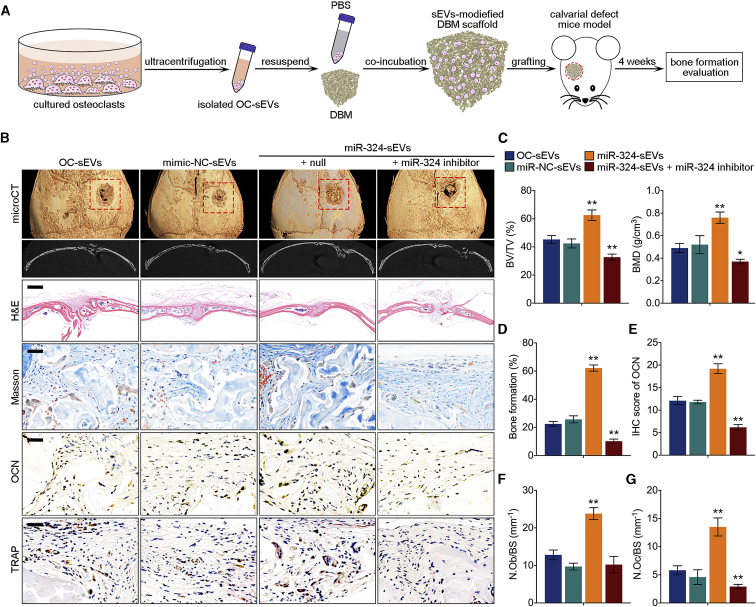
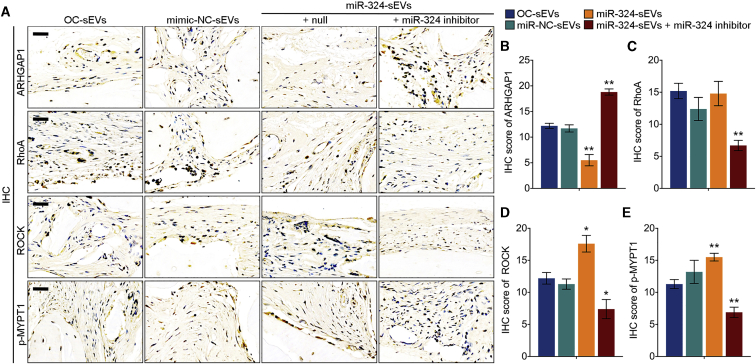
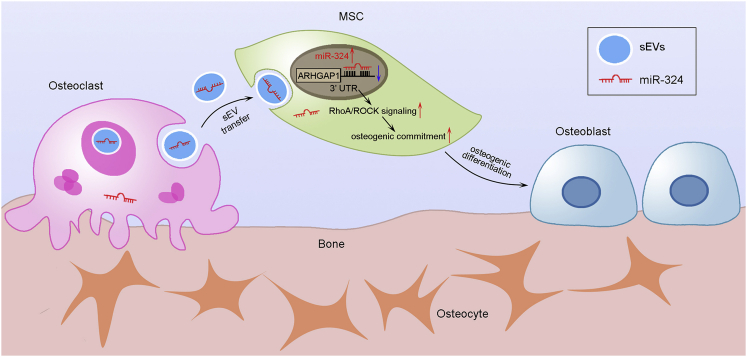
Activated osteoclasts release large amounts of small extracellular vesicles (sEVs) during bone remodeling. However, little is known about whether osteoclast-derived sEVs affect surrounding cells. In this study, osteoclasts were generated by stimulating bone marrow macrophages (BMMs) with macrophage colony stimulating factor (M-CSF) and receptor activator of nuclear actor κB ligand (RANKL). We performed microarray analysis of sEV-microRNAs (miRNAs)s secreted from osteoclast at different stages and identified four miRNAs that were highly expressed in mature osteoclast-derived sEVs. One of these miRNAs, miR-324, significantly induced osteogenic differentiation and mineralization of primary mesenchymal stem cells (MSCs) in vitro by targeting ARHGAP1, a negative regulator of osteogenic differentiation. We next fabricated an sEV-modified scaffold by coating decalcified bone matrix (DBM) with osteoclast-derived sEVs, and the pro-osteogenic regeneration activities of the sEV-modified scaffold were validated in a mouse calvarial defect model. Notably, miR-324-enriched sEV-modified scaffold showed the highest capacity on bone regeneration, whereas inhibition of miR-324 in sEVs abrogated these effects. Taken together, our findings suggest that miR-324-contained sEVs released from mature osteoclast play an essential role in the regulation of osteogenic differentiation and potentially bridge the coupling between osteoclasts and MSCs.

Keywords: extracellular vesicles; osteoclast; osteogenic differentiation.


Conflict of interest statement

The authors declare no competing interests.

Figures

None
Graphical abstract
Figure 1
Figure 1
Characterization of osteoclast-derived sEVs (A) Representative images of TRAP staining of BMMs stimulated with RANKL (100 ng/mL) and M-CSF (50 ng/mL) for 96 h. Scale bar represents 200 μm. (B) Quantification analysis of the proportion of TRAP-positive cells in each well (96-well plate); n = 5. (C) A clustering heatmap shows the expression profile of RANKL-dependent specific genes of osteoclastogenesis from 0 to 96 h. (D) Transmission electron microscopy of osteoclast-derived sEVs (OC-sEVs). Red dotted box shows the lipid bilayer membrane structure of sEVs. Scale bar represents 50 nm. (E) Nanoparticle tracking analysis showed that most OC-sEVs ranged from 70 to 140 nm in diameter with a peak at 90 nm. (F) western blot analysis showed the protein levels of Lamin A/C, histone 3, CD81, TSG101, and β-actin in BMM cell lysate and extracted OC-sEVs. Data in the figures represent the averages ± SD. ∗∗p < 0.01, for differences between the treatment and control groups.
Figure 2
Figure 2
Osteoclast-derived sEVs promote osteogenic differentiation and mineralization (A) Representative confocal microscopy images show MSCs labeled with CellTracker CM-Dil dye that were cultured with PKH67-labeled sEVs for 24 h. Scale bar represents 10 μm. (B) Relative mRNA expression levels of Col1a1, Alpl, Sp7, and Runx2 in MSCs cultured with OC-sEVs or osteoclast conditioned medium (OC-CM), with or without GW4869 pretreatment; n = 3. (C) Western blot analysis of COL1A1, RUNX2, ALP, and β-actin in indicated groups. (D) Representative images of alizarin red staining of MSCs cultured with OC-sEVs or OC-CM. Scale bar represents 100 μm. (E) Quantification analysis of calcium deposit of MSCs in indicated groups; n = 5. The data in the figures represent the averages ± SD. ∗∗p < 0.01, for differences between the treatment and control groups.
Figure 3
Figure 3
sEV-miR-324 derived from osteoclasts can be delivered into MSCs and induce osteogenic differentiation (A) The expression profile of miRNAs in sEVs secreted during osteoclast differentiation. sEVs from BMMs were used as a normalization control. Red color represents higher expression, and blue color represents lower expression relative to the control. (B) ALP activity assay shows that overexpression of miR-324 promoted osteogenic differentiation; n = 3. (C and D) Relative expression levels of (C) miR-324 and (D) pri-miR-324 in MSCs cultured with sEVs from miR-324 overexpression (miR-324-sEVs) or knockdown (anti-miR-324-sEVs) osteoclasts; n = 3. (E) Cell viability evaluation of MSCs cultured with miR-324-sEVs or anti-miR-324-sEVs using a CCK-8 test at 1, 3, 5, and 7 days; n = 5. (F) Relative mRNA expression levels of Col1a1, Alpl, Sp7, and Runx2 in MSCs cultured with miR-324-sEVs or anti-miR-324-sEVs; n = 3. (G) Western blot analysis of COL1A1, RUNX2, ALP, and β-actin in MSCs cultured with miR-324-sEVs or anti-miR-324-sEVs. (H) Representative images of alizarin red staining of MSCs cultured with miR-324-sEVs or anti-miR-324-sEVs. Scale bar represents 100 μm. (I) Quantification analysis of calcium deposit of MSCs in indicated groups; n = 5. Data in the figures represent the averages ± SD. ∗p < 0.05, ∗∗p < 0.01, for differences between the treatment and control groups.
Figure 4
Figure 4
miR-324 directly binds to ARHGAP1 and induces osteogenic differentiation (A) Relative mRNA expression levels of ARHGAP1 in MSC knockdown or overexpressed ARHGAP1; n = 3. CT represents empty control group without any treatment, and si-CT represents the random non-specific siRNA used for negative control. (B) Relative ALP activity of MSC knockdown or overexpressed ARHGAP1 after osteogenic induction for 14 days; n = 3. (C) Relative mRNA expression levels of Col1a1, Alpl, Sp7, and Runx2 in MSC knockdown or overexpressed ARHGAP1; n = 3. (D) Relative expression levels of miR-324 in MSC knockdown or overexpressed miR-324; n = 3. (E) Relative expression levels of ARHGAP1 in MSC knockdown or overexpressed miR-324; n = 3. Data in the figures represent the averages ± SD. ∗∗p < 0.01, for differences between the treatment and control groups.
Figure 5
Figure 5
Osteoclast-secreted miR-324 silences ARHGAP1 during osteogenic differentiation (A) Relative luciferase activity of reporter containing the 3′ UTR of ARHGAP1 in MSCs upon culturing with OC-sEVs, miR-NC-sEVs, miR-324-sEVs, and miR-324-sEVs + miR-324 inhibitor; n = 5. (B) Relative mRNA expression levels of Col1a1, Alpl, Sp7, and Runx2 in MSCs cultured with OC-sEVs, miR-NC-sEVs, miR-324-sEVs, miR-324-sEVs + annexin V, miR-324-sEVs + miR-324 inhibitor, and miR-324-sEVs + ARHGAP1; n = 3. (C) Relative expression levels of ARHGAP1 in indicated groups; n = 3. (D) Western blot analysis of ARHGAP1, RhoA, ROCK, p-MYPT1, and β-actin expression in MSCs cultured with OC-sEVs, miR-NC-sEVs, miR-324-sEVs, miR-324-sEVs + annexin V, miR-324-sEVs + miR-324 inhibitor, and miR-324-sEVs + ARHGAP1; n = 3. (E) Cell viability evaluation of MSCs in indicated groups at 0, 1, 3, 5 and 7 days; n = 3. (F) Representative images of alizarin red staining of MSCs cultured with OC-sEVs, miR-NC-sEVs, miR-324-sEVs, miR-324-sEVs + annexin V, miR-324-sEVs + miR-324 inhibitor, and miR-324-sEVs + ARHGAP1. Scale bar represents 100 μm. (G) Quantification analysis of calcium deposit of MSCs in indicated groups; n = 5. The data in the figures represent the averages ± SD. ∗p < 0.05, ∗∗p < 0.01, for differences between the treatment and control groups.
Figure 6
Figure 6
miR-324 of sEVs released from osteoclast facilitates bone defect healing in vivo (A) Schematic diagram shows the fabrication of sEV-modified scaffold and grafting of calvarial defect mice. (B) Representative general and coronal micro-CT images, H&E, Masson, and TRAP staining, and IHC of OCN in decalcified bone sections from mice treated with OC-sEVs, miR-NC-sEVs, miR-324-sEVs, and miR-324-sEVs + miR-324 inhibitor. Scale bars represents 2 mm in H&E staining, 50 μm in Masson, TRAP, and IHC staining. (C) Quantitative micro-CT analysis shows the bone volume density (BV/TV) and bone mineral density (BMD) of total defect repair area in indicated groups; n = 8. (D) Quantification analysis of bone formation ratio in indicated groups; n = 8. (E) Semiquantitative analysis of OCN in indicated groups; n = 8. (F and G) Quantitative analysis of the number of (F) osteoblasts (N.Ob) and (G) osteoclasts (N.Oc) on the cortical bone surface (BS) using IHC staining of OCN and TRAP staining in indicated groups. The data in the figures represent the averages ± SD. ∗p < 0.05, ∗∗p < 0.01, for differences between the treatment and control groups.
Figure 7
Figure 7
miR-324 of sEVs released from osteoclast facilitates osteogenic through regulating ARHGAP1/RhoA/ROCK signaling (A) Representative IHC staining images of ARHGAP1, RhoA, ROCK, and p-MYPT1 of mice in indicated groups. (B–E) Semiquantitative analysis of (B) ARHGAP1, (B) RhoA, (D) ROCK, and (E) p-MYPT1 in indicated groups; n = 8. The data in the figures represent the averages ± SD. ∗p < 0.05, ∗∗p < 0.01, for differences between the treatment and control groups.
Figure 8
Figure 8
Schematic diagram shows that osteoclast-derived sEVs bridge the osteoclast-osteoblast coupling In the bone resorption phase, active osteoclasts release large amounts of sEV-miR-324, which can be transferred into MSCs, and subsequently promote osteogenic commitment and differentiation via regulating the ARHGAP1/RhoA/ROCK axis.

Similar articles

Cited by

References

    1. Hadjidakis D.J., Androulakis I.I. Bone remodeling. Ann. N Y Acad. Sci. 2006;1092:385–396. - PubMed
    1. Jilka R.L. Biology of the basic multicellular unit and the pathophysiology of osteoporosis. Med. Pediatr. Oncol. 2003;41:182–185. - PubMed
    1. Steffen U., Schett G., Bozec A. How autoantibodies regulate osteoclast induced bone loss in rheumatoid arthritis. Front. Immunol. 2019;10:1483. - PMC - PubMed
    1. Wang N., Agrawal A., Jørgensen N.R., Gartland A. P2X7 receptor regulates osteoclast function and bone loss in a mouse model of osteoporosis. Sci. Rep. 2018;8:3507. - PMC - PubMed
    1. Liang M., Ma Q., Ding N., Luo F., Bai Y., Kang F., Gong X., Dong R., Dai J., Dai Q. IL-11 is essential in promoting osteolysis in breast cancer bone metastasis via RANKL-independent activation of osteoclastogenesis. Cell Death Dis. 2019;10:353. - PMC - PubMed