. 2021 Feb 23:9:e10811.
doi: 10.7717/peerj.10811. eCollection 2021.

Characterization of the GRAS gene family reveals their contribution to the high adaptability of wheat

Affiliations

Characterization of the GRAS gene family reveals their contribution to the high adaptability of wheat

Yanfeng Liu et al. PeerJ. .

Abstract

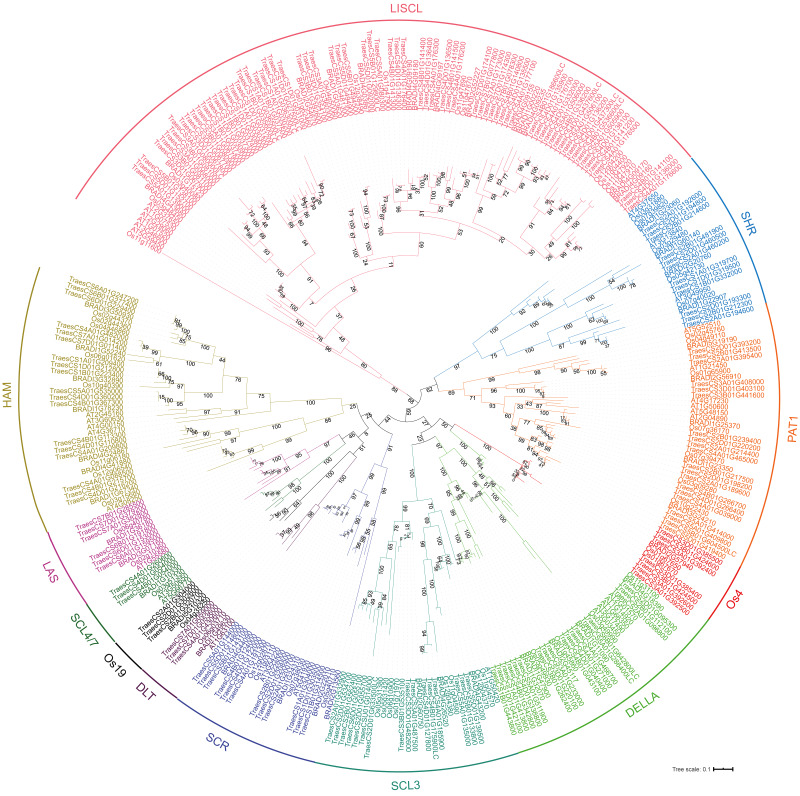
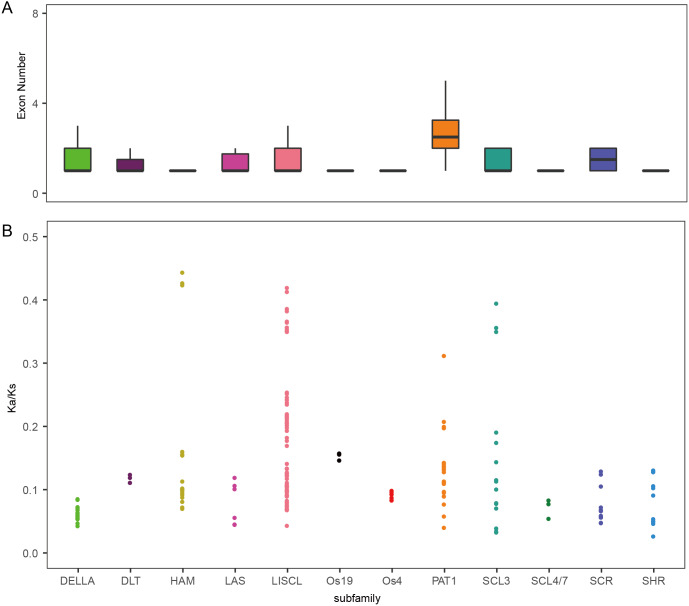
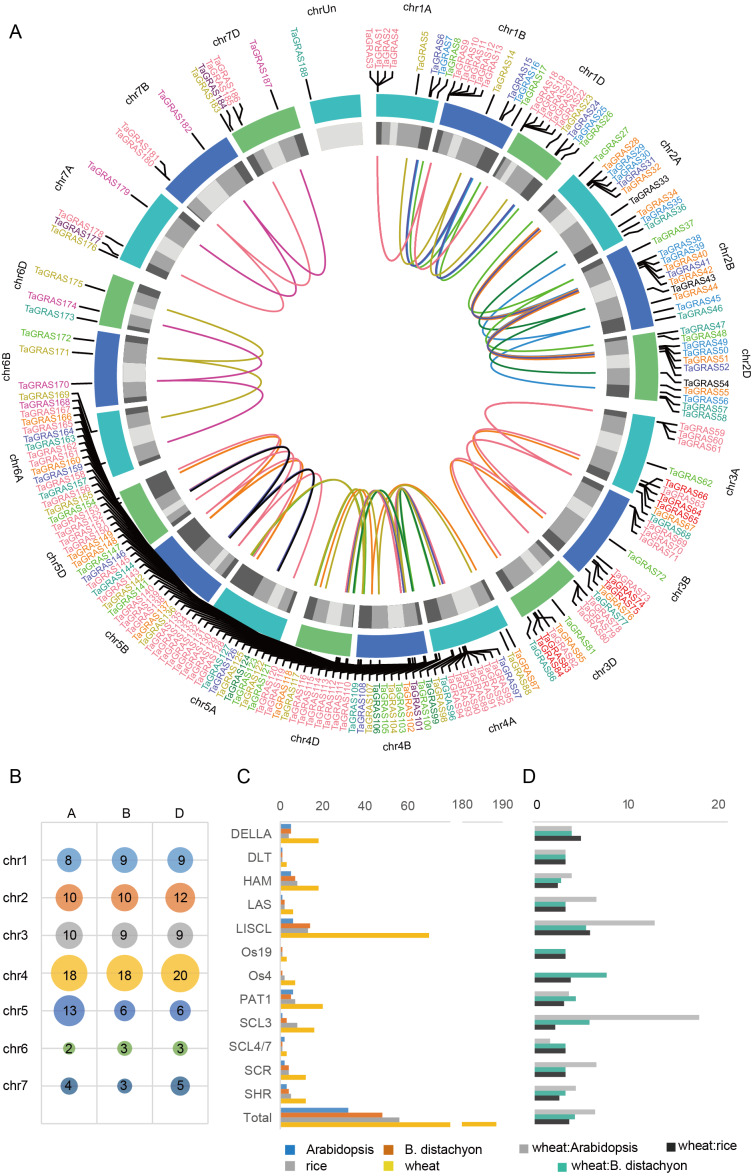
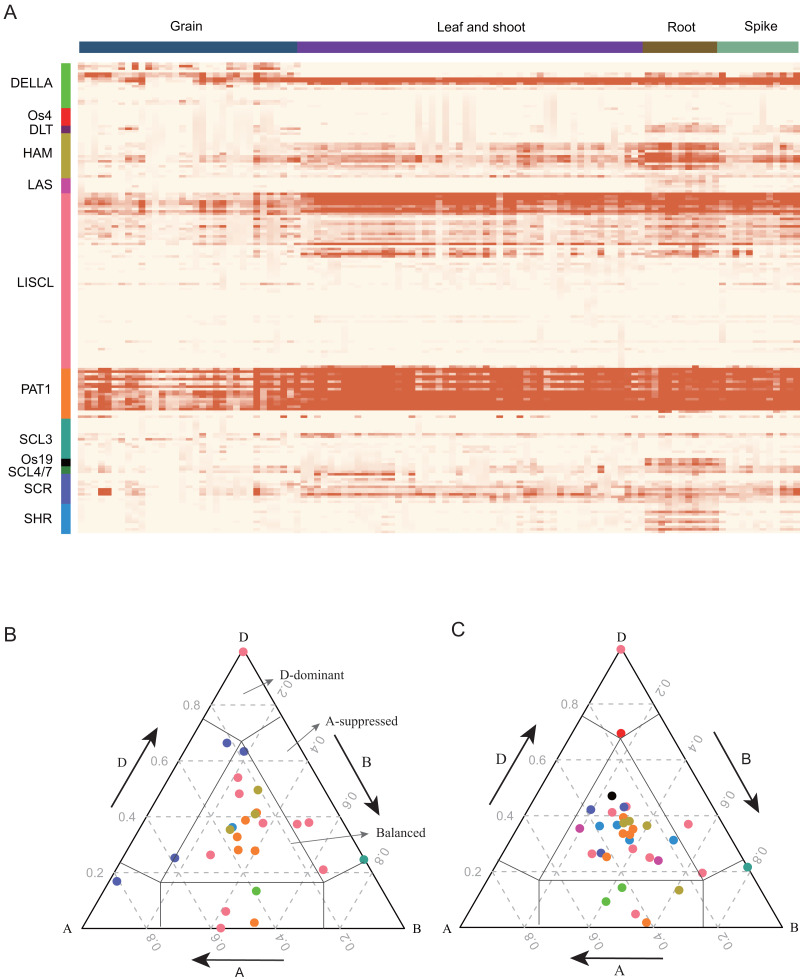
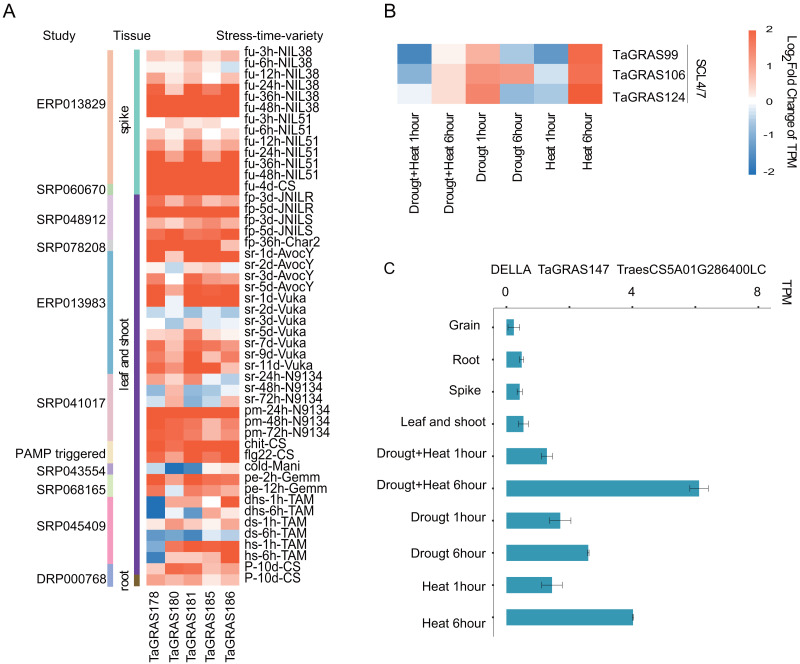
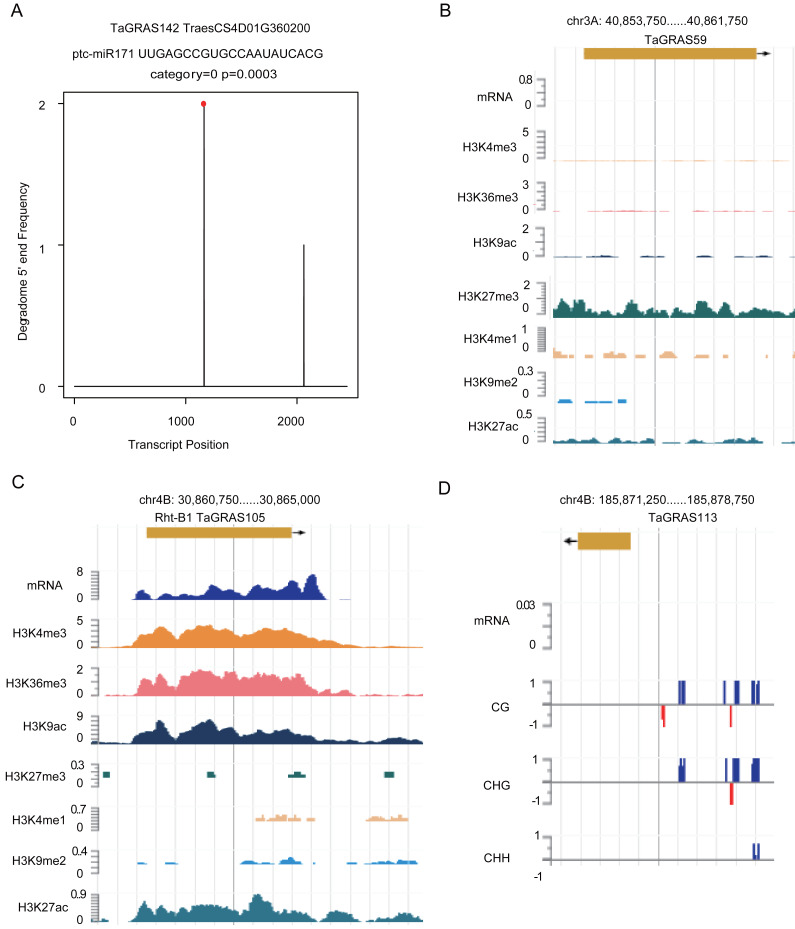
GRAS transcription factors play important roles in many processes of plant development as well as abiotic and biotic stress responses. However, little is known about this gene family in bread wheat (Triticum aestivum), one of the most important crops worldwide. The completion of a quality draft genome allows genome-wide detection and evolutionary analysis of the GRAS gene family in wheat. In this study, 188 TaGRAS genes were detected and divided into 12 subfamilies based on phylogenetic analyses: DELLA, DLT, HAM, LISCL, SCL3, SCL4/7, SCR, SHR, PAT1, Os19, Os4 and LAS. Tandem and segmental duplications are the main contributors to the expansion of TaGRAS, which may contribute to the adaptation of wheat to various environmental conditions. A high rate of homoeolog retention during hexaploidization was detected, suggesting the nonredundancy and biological importance of TaGRAS homoeologs. Systematic analyses of TaGRAS indicated the conserved expression pattern and function of the same subfamily during evolution. In addition, we detected five genes belonging to the LISCL subfamily induced by both biotic and abiotic stresses and they may be potential targets for further research through gene editing. Using degradome and ChIP-seq data, we identified the targets of miR171 and histone modifications and further analyzed the contribution of epigenetic modification to the subfunctionalization of TaGRAS. This study laid a foundation for further functional elucidation of TaGRAS genes.

Keywords: Biotic and abiotic stress; GRAS; Gene expression; Neofunctionalization; Subfunctionalization; Wheat.


Conflict of interest statement

The authors declare there are no competing interests.

Figures

Figure 1
Figure 1. Phylogenic tree of GRAS proteins from bread wheat, Arabidopsis, rice and Brachypodium distachyon.
The protein sequences of GRAS from bread wheat, Arabidopsis, rice and Brachypodium distachyon were used to perform multiple sequence alignment with ClustalW and MEGA 5.0 was used to generate phylogenic tree. The subfamilies were indicated with different colors.
Figure 2
Figure 2. Exon number and Ka/Ks analysis of TaGRAS.
(A) Exon number of TaGRAS subfamilies (*, P < 0.05, Wilcoxon rank sum test). (B) Distribution of Ka/Ks in subfamilies of TaGRAS.
Figure 3
Figure 3. Chromosomal location and number of TaGRAS subfamily genes.
(A) The chromosomal location of TaGRAS. The subfamily genes were indicated with same color as Fig. 1. The outer track indicated each chromosome, and the inner track indicated chromosomal segment (Light grey: C; grey: R2a and R2b; dark grey: R1 and R3). The inner links indicated homoeologous genes. (B) TaGRAS gene number located on each chromosome. (C) Gene number of each subfamily in wheat, rice, Arabidopsis and Brachypodium distachyon. (D) Gene number ratio of each subfamily is shown for wheat: rice, wheat: Arabidopsis and wheat: Brachypodium distachyon.
Figure 4
Figure 4. Expression pattern (TPM) of TaGRAS.
(A) Gene expression profile of TaGRAS in different developmental stage. Heatmap was generated with R package “pheatmap” using parameter scale=“none”. The TPM datas was shown in Table S4. (B) Ternary plot showing relative expression abundance of TaGRAS for triads with 1:1:1 ratio in leaves. Each circle represents a gene triad, and its A, B and D coordinates consist of the relative contribution of each homologous gene to the expression of the overall triad. Triads in vertices means single-subgenomic-dominant class, for example the D-dominant region, while triads near edges and between vertices indicated suppressed classes, for example the A-suppressed region. Triads in the center region indicated balanced category. The color of each subfamily was same with color bar in (A). (C) Ternary plot showing relative expression abundance of TaGRAS for triads with 1:1:1 ratio in roots.
Figure 5
Figure 5. Expression pattern of TaGRAS under abiotic and biotic stresses.
(A) Expression level change of five genes from LISCL subfamily under stresses. The original data accession number and the tissues were shown. fu: fusarium graminearum inoculation; fp: fusarium pseudograminearum inoculation; sr: stripe rust pathogen; pm: powdery mildew pathogen; chit: chitin (1 g per liter) treatment; flg22: flg22 (500 nM) treatment; cold: cold 2 weeks (4); pe: PEG 6000; dhs: drought and heat stress; ds: drought stress; hs: heat stress; P: phosphorous starvation 10 days. (B) Expression level change of SCL4/7 subfamily genes under heat or/and drought stresses. (C) Expression level of TaGRAS147 in different tissue and abiotic stresses. The TPM datas were shown in Table S5.
Figure 6
Figure 6. Epigenetic modifications regulate expression level of TaGRAS genes.
(A) T-plot shows the target of miR171. (B–C) Histone modifications targeted TaGRAS. (D) DNA methylation modification level in the upstream of TaGRAS113.

References

    1. Addo-Quaye C, Miller W, Axtell M. CleaveLand: a pipeline for using degradome data to find cleaved small RNA targets. Bioinformatics. 2009;25:130–131. doi: 10.1093/bioinformatics/btn604. - DOI - PMC - PubMed
    1. Asano K, Hirano K, Ueguchi-Tanaka M, Angeles-Shim RB, Komura T, Satoh H, Kitano H, Matsuoka M, Ashikari M. Isolation and characterization of dominant dwarf mutants, Slr1-d, in rice. Molecular Genetics and Genomics. 2009;281:223–231. doi: 10.1007/s00438-008-0406-6. - DOI - PubMed
    1. Ayyappan V, Kalavacharla V, Thimmapuram J, Bhide KP, Sripathi VR, Smolinski TG, Manoharan M, Thurston Y, Todd A, Kingham B. Genome-wide profiling of histone modifications (H3K9me2 and H4K12ac) and gene expression in rust (uromyces appendiculatus) inoculated common bean (Phaseolus vulgaris L.) PLOS ONE. 2015;10:e0132176. doi: 10.1371/journal.pone.0132176. - DOI - PMC - PubMed
    1. Bolger AM, Lohse M, Usadel B. Trimmomatic: a flexible trimmer for Illumina sequence data. Bioinformatics. 2014;30:2114–2120. doi: 10.1093/bioinformatics/btu170. - DOI - PMC - PubMed
    1. Bolle C, Koncz C, Chua NH. PAT1, a new member of the GRAS family, is involved in phytochrome a signal transduction. Genes & Development. 2000;14:1269–1278. doi: 10.1101/gad.14.10.1269. - DOI - PMC - PubMed

LinkOut - more resources