

Microbiome Analysis Reveals the Attenuation Effect of Lactobacillus From Yaks on Diarrhea via Modulation of Gut Microbiota
- PMID: 33665171
- PMCID: PMC7920975
- DOI: 10.3389/fcimb.2020.610781
Microbiome Analysis Reveals the Attenuation Effect of Lactobacillus From Yaks on Diarrhea via Modulation of Gut Microbiota
Abstract
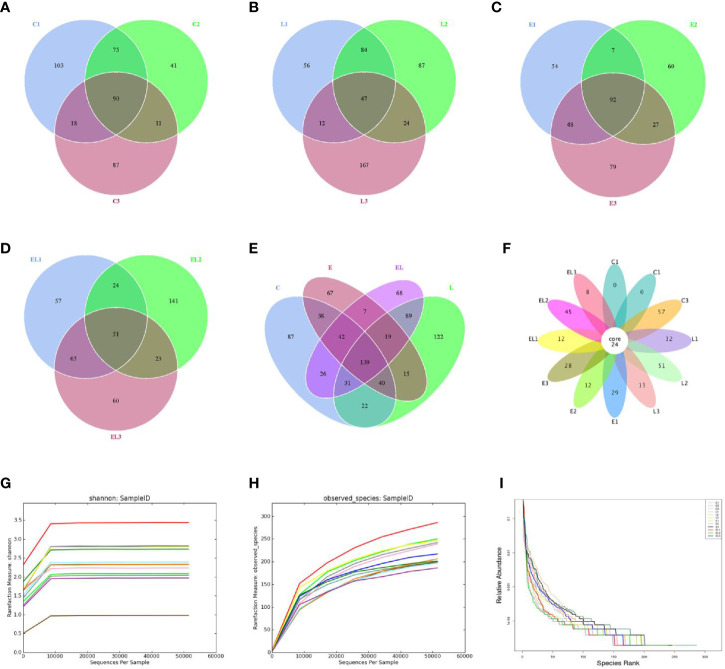
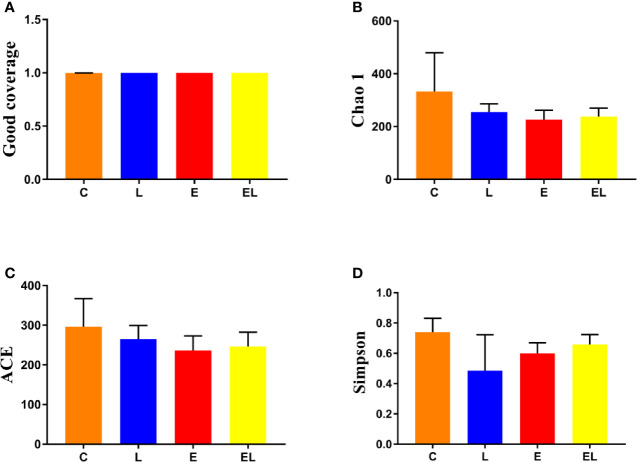
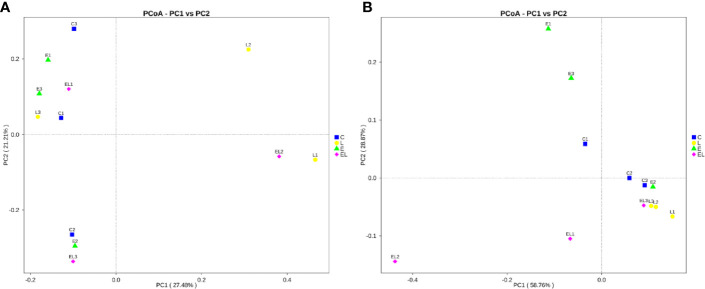
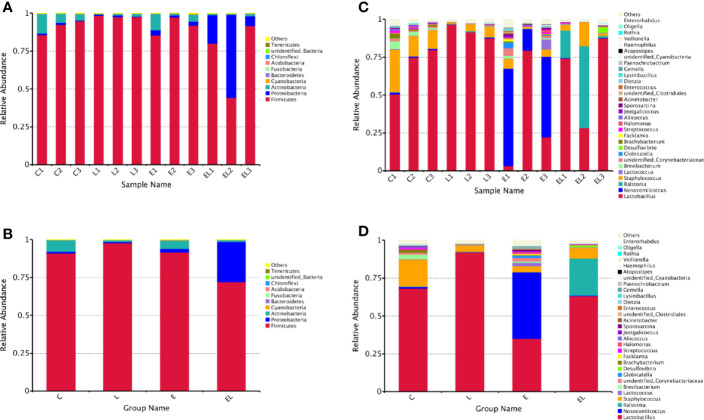
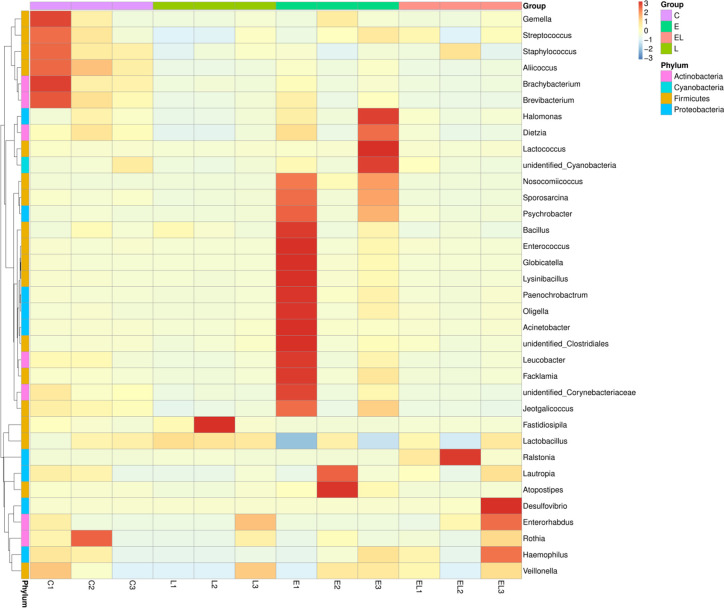
Domestic yaks (Bos grunniens) are indigenous to the Tibetan Plateau and display a high diarrhea rate due to poor habitat and husbandry conditions. Lactobacillus has been shown to exert beneficial effects as antimicrobial, growth promotion, and gut microbiota in humans and/or murine models, but the relevant data regarding Lactobacillus isolated from yaks was unavailable. Therefore, this study aimed to investigate the effects of Lactobacillus from yaks on the intestinal microbial community in a mouse model and determine whether Lactobacillus supplementation contributed in alleviating diarrhea by modulating gut microbiota. A total of 12 ileac samples from four groups were collected for 16S rRNA gene amplicon sequencing of V3-V4 region. Results revealed that although Lactobacillus supplementation did not change the diversity of gut microbiota in mice, the proportion of some intestinal microbiota significantly changed. Specifically, the proportion of Lactobacillus and Sphingomonas in the Lactobacillus treated-group (L-group) were increased as compared to control group (C-group), whereas Pantoea, Cutibacterium, Glutamicibacter, Turicibacter, Globicatella, Microbacterium, Facklamia, unidentified_Corynebacteriaceae, Brachybacterium, and Staphylococcus were significantly decreased in the L-group. In contrast, Escherichia coli (E. coli) infection significantly decreased the proportion of beneficial bacteria such as Globicatella, Acinetobacter, Aerococcus, and Comamonas, while loads of pathogenic bacteria significantly increased including Roseburia and Megasphaera. Interestingly, Lactobacillus administration could ameliorate the microbial community structure of E. coli-induced diarrheal mice by reducing the relative abundance of pathogenic bacteria such as Paenibacillus, Aerococcus, Comamonas, Acinetobacter, Corynebacterium, Facklamia, and Globicatella. Results in this study revealed that Lactobacillus supplementation not only improved the gut microbiota but also alleviated diarrhea in mice, which may be mediated by modulating the composition and function of gut microbiota. Moreover, this study is expected to provide a new theoretical basis for the establishment of a preventive and treatment system for diarrhea in yaks.
Keywords: Escherichia coli; Lactobacillus; Tibet Plateau; gut microbiota; yak.
Copyright © 2021 Dong, Liu, Li, Iqbal, Mehmood, Jamil, Chang, Zhang and Wu.
Conflict of interest statement
The authors declare that the research was conducted in the absence of any commercial or financial relationships that could be construed as a potential conflict of interest.
Figures
Similar articles
-
L. pseudomesenteroides and L. johnsonii isolated from yaks in Tibet modulate gut microbiota in mice to ameliorate enteroinvasive Escherichia coli-induced diarrhea.Microb Pathog. 2019 Jul;132:1-9. doi: 10.1016/j.micpath.2019.04.020. Epub 2019 Apr 15. Microb Pathog. 2019. PMID: 30999021
-
Alterations in the diversity and composition of the fecal microbiota of domestic yaks (Bos grunniens) with pasture alteration-induced diarrhea.BMC Vet Res. 2024 Aug 9;20(1):355. doi: 10.1186/s12917-024-04196-4. BMC Vet Res. 2024. PMID: 39123170 Free PMC article.
-
Lactobacillus reuteri derived from horse alleviates Escherichia coli-induced diarrhea by modulating gut microbiota.Microb Pathog. 2024 Mar;188:106541. doi: 10.1016/j.micpath.2024.106541. Epub 2024 Jan 13. Microb Pathog. 2024. PMID: 38224920
-
Yak Gut Microbiota: A Systematic Review and Meta-Analysis.Front Vet Sci. 2022 Jun 28;9:889594. doi: 10.3389/fvets.2022.889594. eCollection 2022. Front Vet Sci. 2022. PMID: 35836500 Free PMC article.
-
Cocoa seeds and chocolate products interaction with gut microbiota; mining microbial and functional biomarkers from mechanistic studies, clinical trials and 16S rRNA amplicon sequencing.Crit Rev Food Sci Nutr. 2024;64(10):3122-3138. doi: 10.1080/10408398.2022.2130159. Epub 2022 Oct 3. Crit Rev Food Sci Nutr. 2024. PMID: 36190306 Review.
Cited by
-
Relationship between pathogenic E.coli O78-induced intestinal epithelial barrier damage and Zonulin expression levels in yaks.Front Cell Infect Microbiol. 2024 Sep 23;14:1456356. doi: 10.3389/fcimb.2024.1456356. eCollection 2024. Front Cell Infect Microbiol. 2024. PMID: 39376662 Free PMC article.
-
Combining 16S rRNA Sequencing and Metabolomics Data to Decipher the Interactions between Gut Microbiota, Host Immunity, and Metabolites in Diarrheic Young Small Ruminants.Int J Mol Sci. 2023 Jul 13;24(14):11423. doi: 10.3390/ijms241411423. Int J Mol Sci. 2023. PMID: 37511183 Free PMC article.
-
Effects of fecal microbiota transplantation from yaks on weaning diarrhea, fecal microbiota composition, microbial network structure and functional pathways in Chinese Holstein calves.Front Microbiol. 2022 Sep 23;13:898505. doi: 10.3389/fmicb.2022.898505. eCollection 2022. Front Microbiol. 2022. PMID: 36212876 Free PMC article.
-
Microbial interventions in yak colibacillosis: Lactobacillus-mediated regulation of intestinal barrier.Front Cell Infect Microbiol. 2024 Feb 6;14:1337439. doi: 10.3389/fcimb.2024.1337439. eCollection 2024. Front Cell Infect Microbiol. 2024. PMID: 38390621 Free PMC article.
-
Pediococcus pentosaceus IM96 Exerts Protective Effects against Enterohemorrhagic Escherichia coli O157:H7 Infection In Vivo.Foods. 2021 Nov 30;10(12):2945. doi: 10.3390/foods10122945. Foods. 2021. PMID: 34945495 Free PMC article.
References
Publication types
MeSH terms
Substances
LinkOut - more resources
Full Text Sources
Other Literature Sources