

Molecular subtyping and functional validation of TTK, TPX2, UBE2C, and LRP8 in sensitivity of TNBC to paclitaxel
- PMID: 33665229
- PMCID: PMC7899947
- DOI: 10.1016/j.omtm.2021.01.013
Molecular subtyping and functional validation of TTK, TPX2, UBE2C, and LRP8 in sensitivity of TNBC to paclitaxel
Abstract
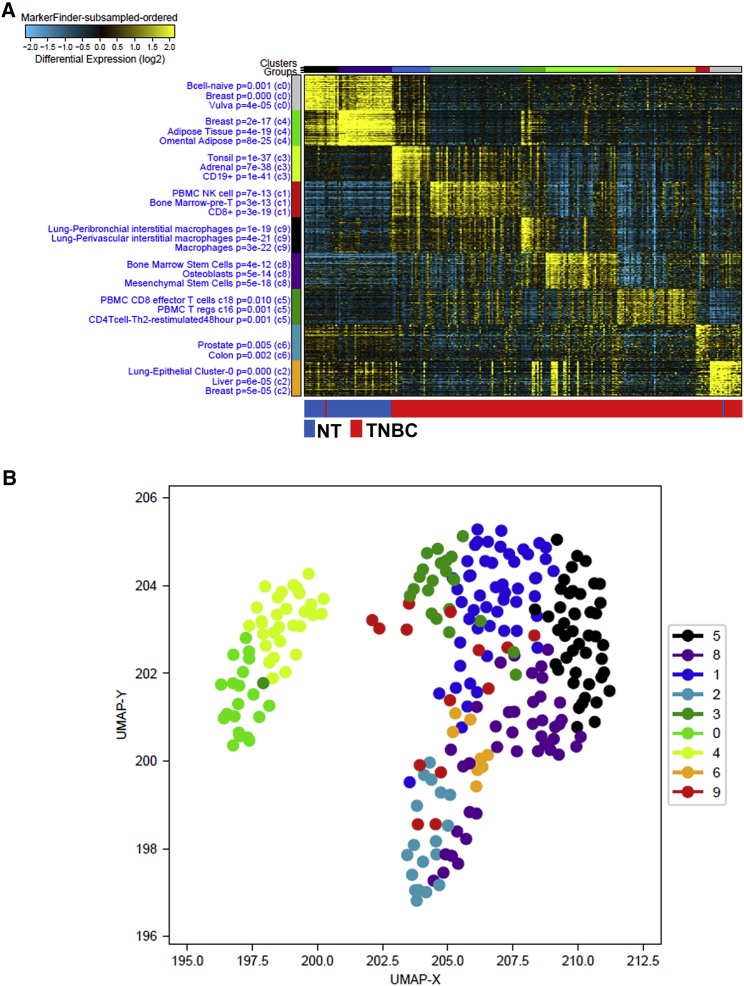
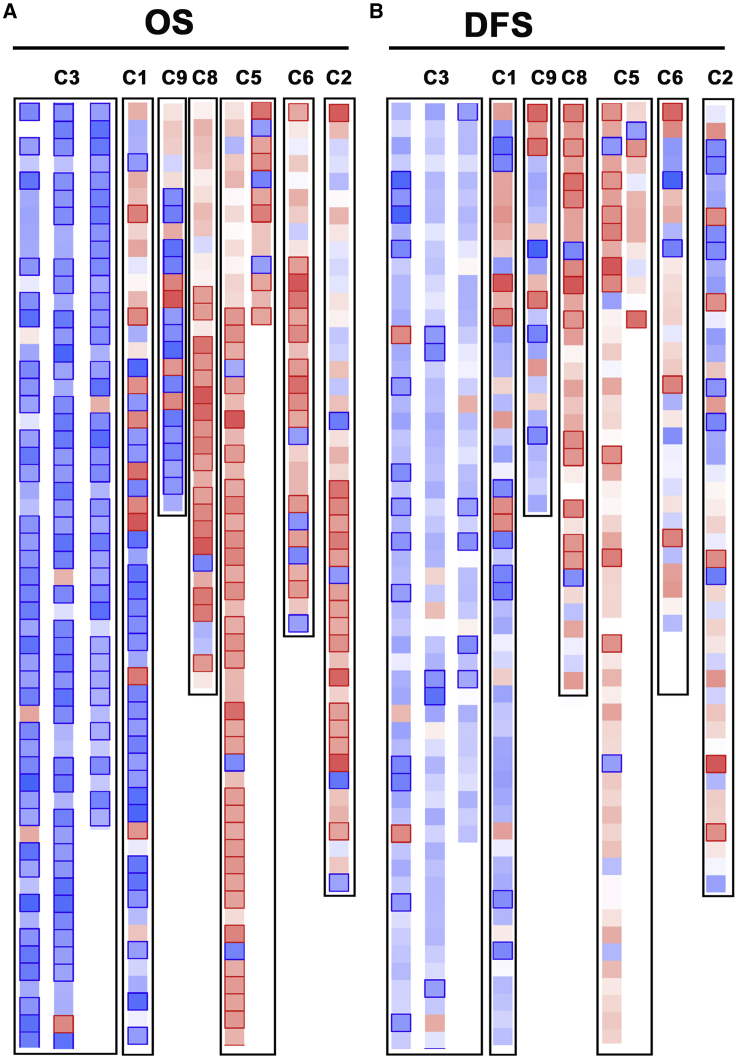
Triple-negative breast cancer (TNBC) patients exhibit variable responses to chemotherapy, suggesting an underlying molecular heterogeneity. In the current study, we analyzed publicly available transcriptome data from 360 TNBC and 88 normal breast tissues, which revealed activation of nucleosome and cell cycle as the hallmarks of TNBC. Mechanistic network analysis identified activation of FOXM1 and ERBB2, and suppression of TP53 and NURP1 networks in TNBC. Employing Iterative Clustering and Guide-gene Selection (ICGS), Uniform Manifold Approximation and Projection (UMAP), and dimensionality reduction analyses, we classified TNBC into seven molecular subtypes, each exhibiting a unique molecular signature, including immune infiltration (CD19, CD8, and macrophages) and mesenchymal signature, which correlated with variable disease outcomes in a larger cohort (1,070) of BC. Mechanistically, depletion of TTK, TPX2, UBE2C, CDCA7, MELK, NFE2L3, DDX39A, and LRP8 led to substantial inhibition of colony formation of TNBC models, which was further enhanced in the presence of paclitaxel. Our data provide novel insights into the molecular heterogeneity of TNBC and identified TTK, TPX2, UBE2C, and LRP8 as main drivers of TNBC tumorigenesis.
Keywords: LRP8; TNBC; TPX2; TTK; UBE2C; bioinformatics; classification; gene signature; heterogeneity; transcriptome.
© 2021 The Authors.
Conflict of interest statement
The authors declare no competing interests.
Figures


Similar articles
-
LncRNA-Based Classification of Triple Negative Breast Cancer Revealed Inherent Tumor Heterogeneity and Vulnerabilities.Noncoding RNA. 2022 Jun 21;8(4):44. doi: 10.3390/ncrna8040044. Noncoding RNA. 2022. PMID: 35893227 Free PMC article.
-
Therapeutic targeting of the TPX2/TTK network in colorectal cancer.Cell Commun Signal. 2023 Sep 28;21(1):265. doi: 10.1186/s12964-023-01290-2. Cell Commun Signal. 2023. PMID: 37770979 Free PMC article.
-
Transcriptional landscape associated with TNBC resistance to neoadjuvant chemotherapy revealed by single-cell RNA-seq.Mol Ther Oncolytics. 2021 Sep 14;23:151-162. doi: 10.1016/j.omto.2021.09.002. eCollection 2021 Dec 17. Mol Ther Oncolytics. 2021. PMID: 34703883 Free PMC article.
-
Long non-coding RNAs: implications in targeted diagnoses, prognosis, and improved therapeutic strategies in human non- and triple-negative breast cancer.Clin Epigenetics. 2018 Jun 27;10:88. doi: 10.1186/s13148-018-0514-z. eCollection 2018. Clin Epigenetics. 2018. PMID: 29983835 Free PMC article. Review.
-
Molecular Classification of Triple-Negative Breast Cancer.J Breast Cancer. 2016 Sep;19(3):223-230. doi: 10.4048/jbc.2016.19.3.223. Epub 2016 Sep 23. J Breast Cancer. 2016. PMID: 27721871 Free PMC article. Review.
Cited by
-
Role of UBE2C in Brain Cancer Invasion and Dissemination.Int J Mol Sci. 2023 Oct 31;24(21):15792. doi: 10.3390/ijms242115792. Int J Mol Sci. 2023. PMID: 37958776 Free PMC article. Review.
-
Development and validation of novel prognostic models based on RNA-binding proteins in breast cancer.J Int Med Res. 2022 Jun;50(6):3000605221106285. doi: 10.1177/03000605221106285. J Int Med Res. 2022. PMID: 35770997 Free PMC article.
-
Transcriptome profiling and network enrichment analyses identify subtype-specific therapeutic gene targets for breast cancer and their microRNA regulatory networks.Cell Death Dis. 2023 Jul 12;14(7):415. doi: 10.1038/s41419-023-05908-8. Cell Death Dis. 2023. PMID: 37438342 Free PMC article.
-
LncRNA-Based Classification of Triple Negative Breast Cancer Revealed Inherent Tumor Heterogeneity and Vulnerabilities.Noncoding RNA. 2022 Jun 21;8(4):44. doi: 10.3390/ncrna8040044. Noncoding RNA. 2022. PMID: 35893227 Free PMC article.
-
Transcriptional alterations of protein coding and noncoding RNAs in triple negative breast cancer in response to DNA methyltransferases inhibition.Cancer Cell Int. 2021 Sep 26;21(1):515. doi: 10.1186/s12935-021-02213-2. Cancer Cell Int. 2021. PMID: 34565361 Free PMC article.
References
-
- Foulkes W.D., Smith I.E., Reis-Filho J.S. Triple-negative breast cancer. N. Engl. J. Med. 2010;363:1938–1948. - PubMed
-
- Venkitaraman R. Triple-negative/basal-like breast cancer: clinical, pathologic and molecular features. Expert Rev. Anticancer Ther. 2010;10:199–207. - PubMed
-
- Dent R., Trudeau M., Pritchard K.I., Hanna W.M., Kahn H.K., Sawka C.A., Lickley L.A., Rawlinson E., Sun P., Narod S.A. Triple-negative breast cancer: clinical features and patterns of recurrence. Clin. Cancer Res. 2007;13:4429–4434. - PubMed
-
- Perou C.M., Sørlie T., Eisen M.B., van de Rijn M., Jeffrey S.S., Rees C.A., Pollack J.R., Ross D.T., Johnsen H., Akslen L.A. Molecular portraits of human breast tumours. Nature. 2000;406:747–752. - PubMed
LinkOut - more resources
Full Text Sources
Other Literature Sources
Research Materials
Miscellaneous
