. 2021 Feb 3;24(2):102124.
doi: 10.1016/j.isci.2021.102124. eCollection 2021 Feb 19.

Activation of amino acid metabolic program in cardiac HIF1-alpha-deficient mice

Affiliations

Activation of amino acid metabolic program in cardiac HIF1-alpha-deficient mice

Ivan Menendez-Montes et al. iScience. .

Abstract

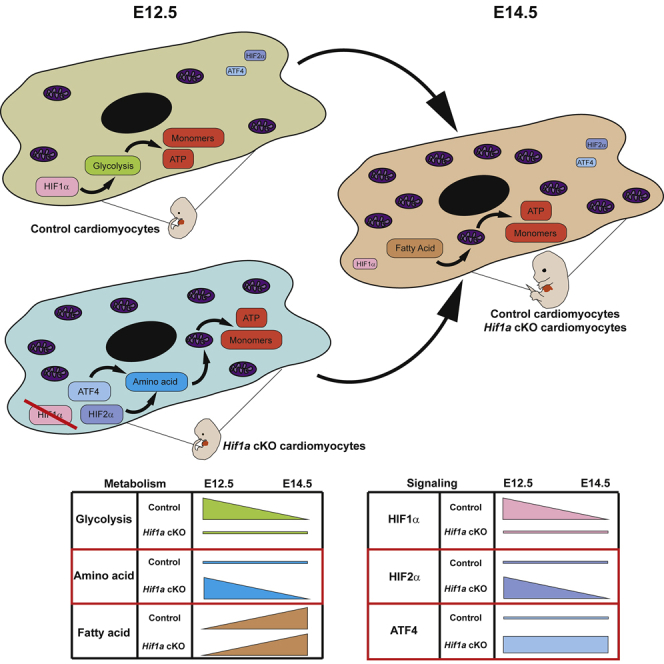
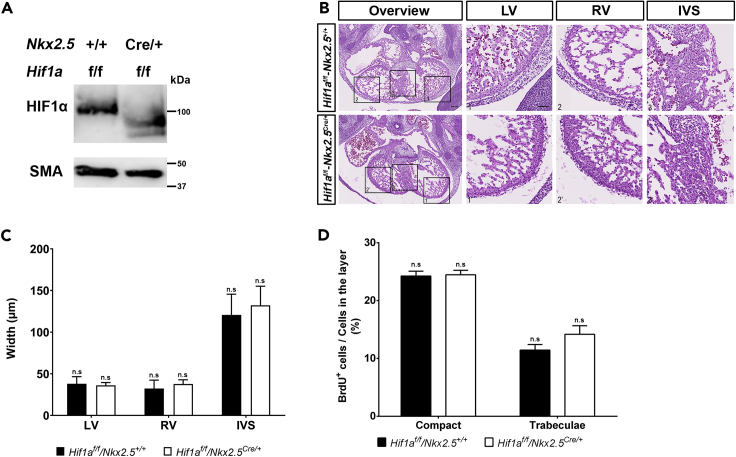
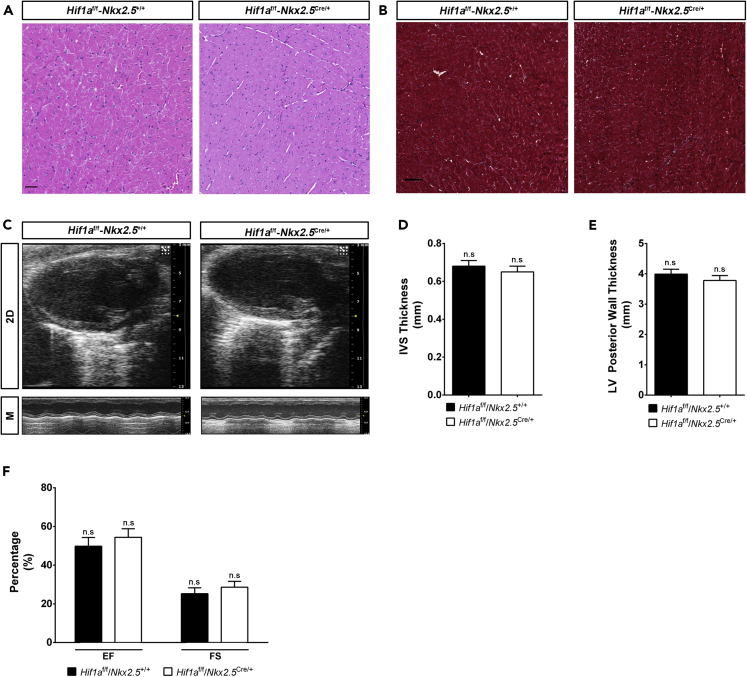
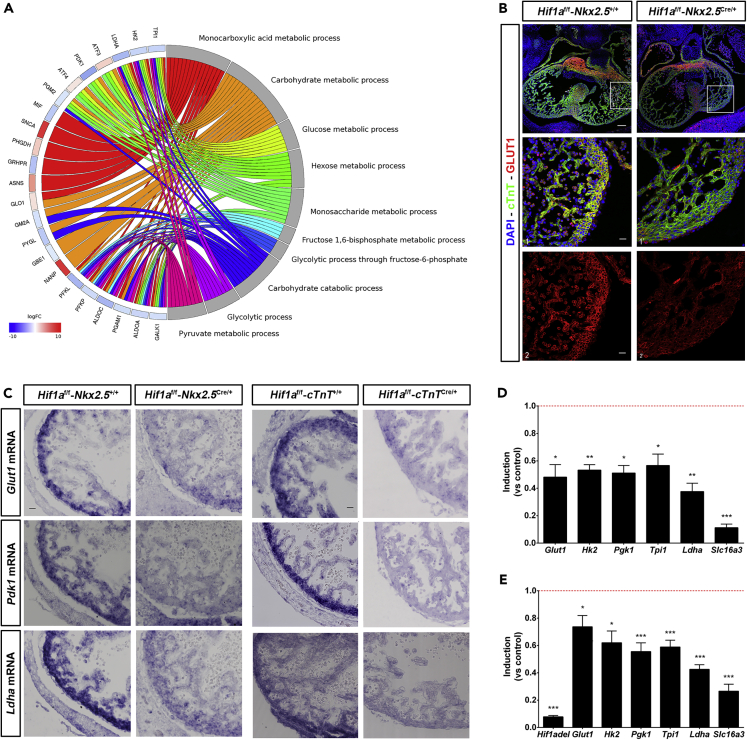
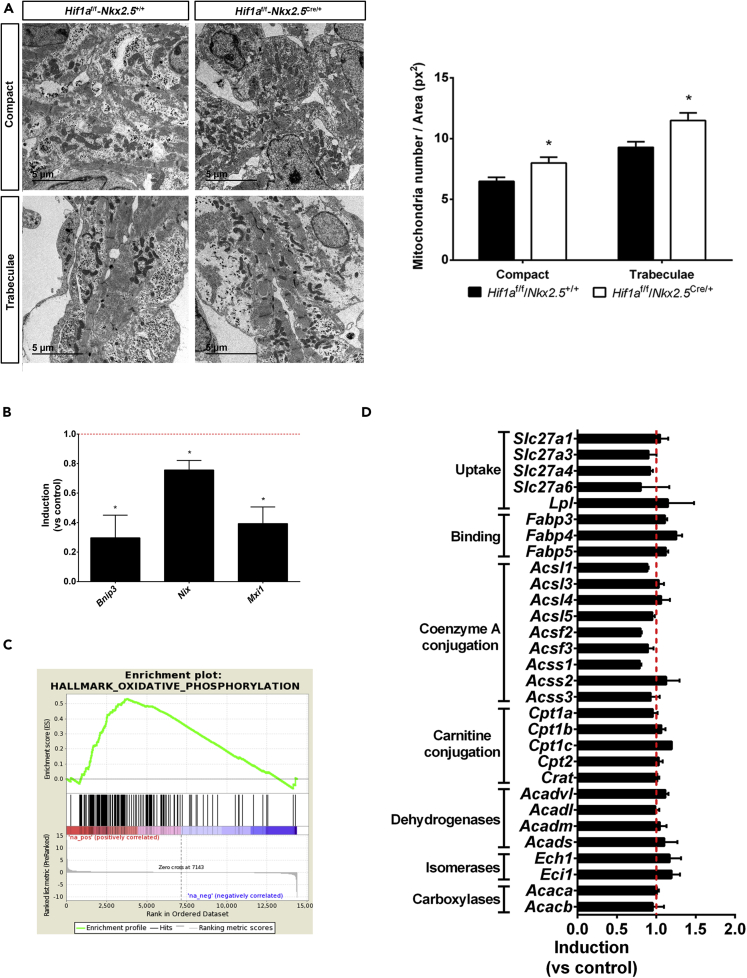
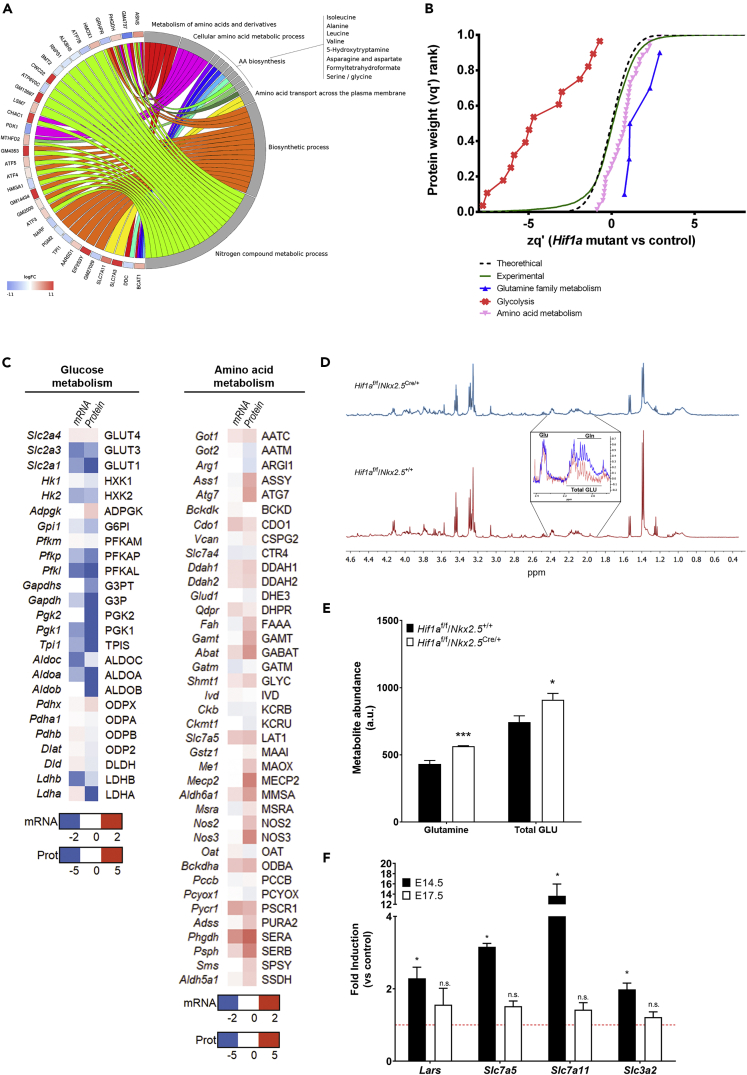
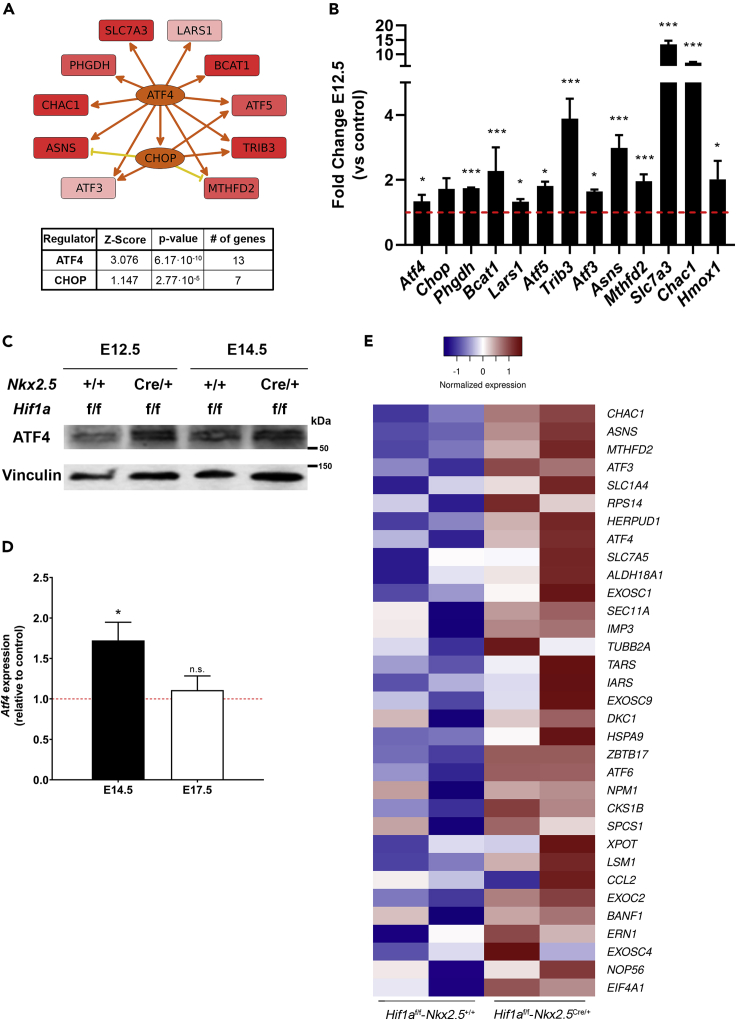
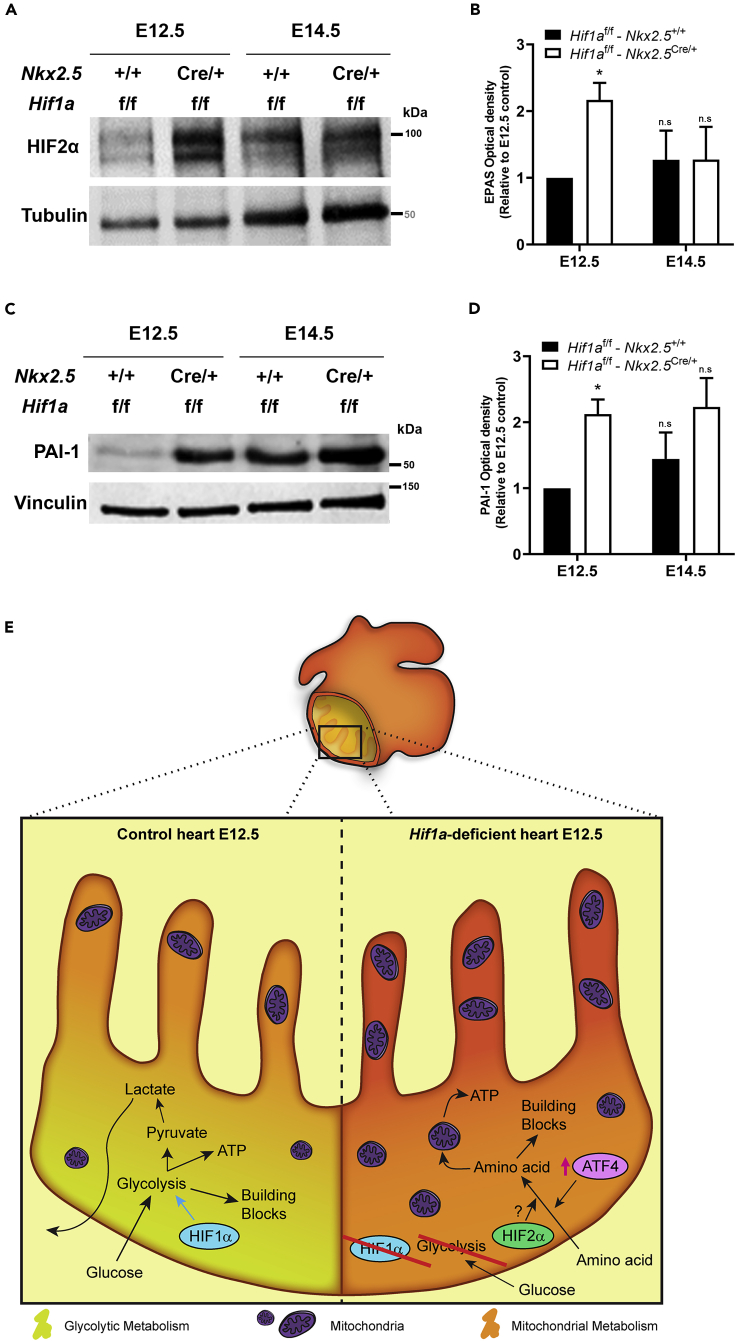
HIF1-alpha expression defines metabolic compartments in the developing heart, promoting glycolytic program in the compact myocardium and mitochondrial enrichment in the trabeculae. Nonetheless, its role in cardiogenesis is debated. To assess the importance of HIF1-alpha during heart development and the influence of glycolysis in ventricular chamber formation, herein we generated conditional knockout models of Hif1a in Nkx2.5 cardiac progenitors and cardiomyocytes. Deletion of Hif1a impairs embryonic glycolysis without influencing cardiomyocyte proliferation and results in increased mitochondrial number and transient activation of amino acid catabolism together with HIF2α and ATF4 upregulation by E12.5. Hif1a mutants display normal fatty acid oxidation program and do not show cardiac dysfunction in the adulthood. Our results demonstrate that cardiac HIF1 signaling and glycolysis are dispensable for mouse heart development and reveal the metabolic flexibility of the embryonic myocardium to consume amino acids, raising the potential use of alternative metabolic substrates as therapeutic interventions during ischemic events.

Keywords: Animal Physiology; Biological Sciences; Cellular Physiology; Developmental Biology.


Conflict of interest statement

The authors declare no competing interests.

Figures

None
Graphical abstract
Figure 1
Figure 1
Embryonic phenotype of Hif1a-deficient embryos at E12.5 (A) Representative immunoblot against HIF1α (upper panel) and smooth muscle actin (SMA, lower panel) in heart lysates of control (Hif1af/f/Nkx2.5+/+) and Hif1a/Nkx2.5 (Hif1af/f/Nkx2.5Cre/+) mutant embryos at E12.5. (B) E12.5 control (upper panels) and mutant (lower panels) heart sections stained with hematoxylin and eosin (H&E). Scale bars, 100 μm (overview) and 20 μm (insets). (C) H&E quantification of ventricular walls and interventricular septum width in E12.5 control (black bars, n = 4) and mutant (white bars, n = 3) embryos. (D) Quantification of BrdU immunostaining, represented as percentage of BrdU+ cells in the compact myocardium and trabeculae of E12.5 control (black) and Hif1a/Nkx2.5 mutant (white) embryos (n = 3). In all graphs, bars represent mean ± SEM, Student's t test, n.s: non-significant. LV: left ventricle; RV: right ventricle; IVS: interventricular septum. Similar amount of male and female embryos has been used in these analyses.
Figure 2
Figure 2
Cardiac morphology and function in adult Hif1a/Nkx2.5 mutants (A and B) H&E (A) and Masson's trichrome (B) staining of the left ventricle from a representative 5-month-old control (Hif1af/f/Nkx2r+/+) and Hif1a/Nkx2.5 mutant (Hif1af/f/Nkx2.5Cre/+) heart. Even distribution of male and female mice was used in each experimental group (n = 6 females and 6 males). No differences associated with sex were observed in cardiac structure or fibrosis. (C) Representative echocardiography imaging of 5-month-old control and Hif1a-deficient mutant mice in 2D mode (upper panels) and M mode (lower panels). (D and E) Echocardiography-based quantification of interventricular septum (IVS) thickness (D) and left ventricle (LV) posterior wall thickness (E) in controls (black bars, n = 9) and Hif1a/Nkx2.5 mutants (white bars, n = 11) by 5 months of age. (F) Quantification of ejection fraction (EF) and fractional shortening (FS) in controls (black bars, n = 9) and Hif1a/Nkx2.5 mutants (white bars, n = 11) by 5 months of age. Uniform distribution of male and female mice was used in each experimental group (n = 10 females and 10 males). No differences associated with sex were observed for cardiac structural or functional parameters. In all graphs bars represent mean ± SEM, Student's t test, n.s: non-significant. For all images, scale bars, 50 μm.
Figure 3
Figure 3
Glycolytic metabolism alterations in cardiac Hif1a-deficient embryos (A) Circular plot representing logFC value for genes detected as differentially expressed in mutant (Hif1af/f/Nkx2.5Cre/+) embryos, relative to controls (Hif1af/f/Nkx2.5+/+), at E12.5 (left side), associated to Gene Ontology (GO) terms related to carbohydrate metabolism, selected among those detected as enriched with p value < 0.001 with GOrilla (right side). logFC values for genes are color coded: blue color denotes lower expression in mutant samples. Ribbons connecting genes and biological processes are colored by process. (B) Representative GLUT1 immunofluorescence on E12.5 heart sections of controls (left panels) and Hif1a/Nkx2.5 mutants (right panels). Nuclei shown in blue, Troponin T in green, and GLUT1 in red. Insets show left ventricle. Scale bars, 100 μm and 20 μm in insets. (C) E12.5 in situ hybridization of Glut1 (top panels), Pdk1 (middle panels), and Ldha (bottom panels) in control and Hif1a/Nkx2.5 mutant right ventricles (left) and in control and Hif1a/cTnT mutant right ventricles (right). Scale bar, 20μm (D and E) RT-qPCR analysis of glycolytic genes from E14.5 Hif1a/Nkx2.5 (D) and Hif1a/cTnT (E) mutant ventricles. Bars (mean ± SEM, n = 3) represent fold induction relative to baseline expression in littermate controls (red line). Student's t test. ∗p value<0.05; ∗∗0.005<p value<0.01, ∗∗∗p value<0.005. Equivalent proportion of male and female embryos have been included in all experiments.
Figure 4
Figure 4
Mitochondrial content and lipid metabolism in Hif1a/Nkx2.5 mutants at E12.5 (A) Transmission electron micrographs of ventricular tissue from a representative E12.5 control embryo (Hif1af/f/Nkx2.5+/+, left) and a mutant littermate (Hif1af/f/Nkx2.5Cre/+, right), showing compact myocardium (top panels) and trabeculae (bottom panels), and quantification of total mitochondria in electron micrographs from E12.5 controls (black bars) and mutants (white bars). Results are expressed as number of mitochondria per tissue area (px2). Scale bars, 5 μm. Bars represent mean ± SEM (n = 4). Student's t test, ∗p value<0.05 (B) RT-qPCR analysis of mitophagy-related genes in E12.5 Hif1a/Nkx2.5 mutant ventricles. Bars (mean ± SEM, n = 3 for Bnip3 and Mxi1 and n = 4 for Nix) represent fold induction relative to baseline expression in littermate controls (red line). Student's t test, ∗p value<0.05. (C) GSEA enrichment plot for the Hallmark database Oxidative Phosphorylation gene set. The red to blue stripe represents 14,406 genes detected as expressed after differential expression analysis, ranked by logFC. Genes at the left side (colored in red) are more expressed in Hif1a/Nkx2.5 mutants, and those located at the right side (colored in blue) are more expressed in control littermates. Vertical black lines represent the position of members of the Oxidative Phosphorylation gene set along the ranked collection of genes. The green curve represents cumulative enrichment score. (D) Fold change gene expression determined by RNA-seq of genes involved in fatty acid uptake and catabolism in Hif1a/Nkx2.5 mutants. Red line represents baseline expression in control littermates. Bars represent mean ± SEM (n = 2). All experiments were performed using a comparable number of male and female embryos at each stage.
Figure 5
Figure 5
Metabolic adaptations in Hif1a-deficient hearts (A) Circular plot representing logFC values for genes detected as differentially expressed in mutant (Hif1af/f/Nkx2.5Cre/+) embryos, relative to controls (Hif1af/f/Nkx2.5+/+) at E12.5 (left side), associated to a selection of functional terms related to amino acid metabolism (right side). Functions were detected with Panther by comparison against the Biological Process component of the Gene Ontology database, as well as against the Panther Pathway and Reactome databases. All functional terms were enriched with p value < 0.05. logFC values are color coded: red color denotes higher expression in mutant samples. Ribbons connecting genes and functional terms are colored by process. (B) Representation of protein statistical weights (wq’) grouped by functional categories (FDR<1%, n = 6) versus protein abundance in Hif1a-deficient hearts relative to control embryos (zq’) at E12.5, as determined by MS/MS proteomics. A displacement right from the experimental curve indicates increased pathway in mutant embryos, whereas a left displacement represents a reduction. (C) Heatmap representation of mRNA (quantified by RNA-seq) and protein (quantified by MS/MS) of components of glucose (left) and amino acid (right) metabolic pathways. Color code indicated in the legend is calculated as the value found in Hif1a/Nkx2.5 mutants relative to control littermates. (D) Representative 1H-NMR spectra in ventricular samples from E12.5 control (bottom) and Hif1a/Nkx2.5 mutant embryos (top). The inset highlights the differences in glutamine and total GLU [glutamine (Gln) + glutamate (Glu)] NMR signals. (E and F) (E) 1H-NMR spectroscopy quantification of glutamine and total GLU abundance in control (black) and Hif1a/Nkx2.5 mutant embryos (white). Bars represent mean ± SEM (n = 3). (F) RT-qPCR analysis of amino acid transporter gene expression in Hif1a mutant ventricular tissue at E14.5 (black bars) and E17.5 (white bars). Bars (mean ± SEM, n = 2–4 for E14.5 and n = 3 for E17.5) represent fold induction relative to baseline expression in littermate controls (red line). For all graphs, Student's t test, ∗p value<0.05, ∗∗∗p value<0.005, n.s. non-significant. Even proportion of male and female embryos has been included to carry out these experiments at each gestational stage.
Figure 6
Figure 6
Upstream regulators of amino acid catabolism activation in Hif1a-deficient hearts (A) Regulatory network summarizing the interactions between ATF4 and CHOP with a collection of genes related to amino acid metabolism, detected as differentially expressed at E12.5 in Hif1a/Nkx2.5-deficient hearts relative to controls. The graph is a simplified version of a mechanistic network predicted after IPA's upstream regulator analysis on the complete set of 201 differentially expressed genes. Intensity of red color in target genes is proportional to logFC. Intensity of orange color in regulator genes (ATF4 and CHOP) is proportional to the predicted activation Z score. Arrow-pointed and flat-headed lines represent positive and negative regulation interactions, respectively. Orange and yellow lines represent congruent and non-congruent connections, respectively, relative to the predicted activation state of regulators. The inset below summarizes Z score value and enrichment p value for ATF4 and CHOP, as well as the number of differentially expressed genes that are regulated by each of them. (B) Relative expression of genes related to amino acid metabolism downstream of ATF4 determined by RNA-seq at E12.5 in Hif1a/Nkx2.5 mutant versus control ventricles (n = 2). Student's t test. ∗p value<0.05, ∗∗∗ p value<0.005. (C) Representative immunoblot out of 5 against ATF4 (upper panel) and Vinculin (lower panel) from ventricular heart lysates of control (Hif1af/f/Nkx2.5+/+) and Hif1a/Nkx2.5 mutant (Hif1af/f/Nkx2.5Cre/+) embryos at E12.5 and E14.5. (D) RT-qPCR analysis of Atf4 gene expression at E14.5 (black bar) and E17.5 (white bar) in Hif1a/Nkx2.5 mutant ventricular tissue. Bars (mean ± SEM, n = 5 for E14.5 and n = 3 for E17.5) represent fold induction relative to baseline expression in littermate controls (red line). Student's t test, ∗ p value<0.05, n.s. non-significant. (E) Heatmap representing RNA-seq based, normalized expression levels for genes involved in the unfolded protein response (UPR). The UPR gene set, as defined in the Hallmark database, was detected as enriched in mutant embryos after GSEA, although enrichment was not statistically significant (nominal p value = 0.31). Genes presented in the heatmap correspond to the leading-edge subset, this is, those mostly contributing to the calculated enrichment score. All experiments and analyses were performed using equivalent amount of male and female embryos at each stage.
Figure 7
Figure 7
HIF2 signaling induction upon Hif1a deletion (A) Representative immunoblot against HIF2α (upper panel) and Tubulin (lower panel) in heart lysates of control (Hif1af/f/Nkx2.5+/+) and Hif1a/Nkx2.5 mutant (Hif1af/f/Nkx2.5Cre/+) embryos at E12.5 and E14.5. (B) Quantification of HIF2α band intensity normalized by Tubulin as loading control (n = 3). (C) Representative immunoblot against PAI-1 (upper panel) and Vinculin (lower panel) in heart lysates of control (Hif1af/f/Nkx2.5+/+) and Hif1a/Nkx2.5 mutant (Hif1af/f/Nkx2.5Cre/+) embryos at E12.5 and E14.5. (D) Quantification of PAI-1 band intensity normalized by Vinculin as loading control (n = 3). For all graphs, bars (mean ± SEM, n = 3) represent fold induction relative to baseline expression in littermate controls at E12.5 or E14.5. Student's t test. ∗p value<0.05, n.s: non-significant. Comparable proportion of male and female embryos has been included to perform these experiments at each gestational stage. (E) Model representing the embryonic myocardium by E12.5. Compact myocardium is mainly glycolytic (yellowish) by the action of HIF1 signaling, whereas trabeculae rely more on mitochondrial metabolism (orange) in control embryos (left). In Hif1a mutants (right), glycolysis is compromised and the whole myocardium relies on mitochondrial metabolism, displaying higher mitochondrial content, and favoring the use of amino acids as energy source parallel to the activation of ATF4 and HIF2 signaling.

References

    1. Averous J., Bruhat A., Jousse C., Carraro V., Thiel G., Fafournoux P. Induction of CHOP expression by amino acid limitation requires both ATF4 expression and ATF2 phosphorylation. J. Biol. Chem. 2004;279:5288–5297. - PubMed
    1. Badiola N., Penas C., Miñano-Molina A., Barneda-Zahonero B., Fadó R., Sánchez-Opazo G., Comella J.X., Sabriá J., Zhu C., Blomgren K., et al. Induction of ER stress in response to oxygen-glucose deprivation of cortical cultures involves the activation of the PERK and IRE-1 pathways and of caspase-12. Cell Death Dis. 2011;2:e149. - PMC - PubMed
    1. Ben-Sahra I., Hoxhaj G., Ricoult S.J.H., Asara J.M., Manning B.D. mTORC1 induces purine synthesis through control of the mitochondrial tetrahydrofolate cycle. Science. 2016;351:728–733. - PMC - PubMed
    1. Bing R.J., Siegel A., Ungar I., Gilbert M. Metabolism of the human heart: II. Studies on fat, ketone and amino acid metabolism. Am. J. Med. 1954;16:504–515. - PubMed
    1. Bohuslavova R., Skvorova L., Sedmera D., Semenza G.L., Pavlinkova G. Increased susceptibility of HIF-1α heterozygous-null mice to cardiovascular malformations associated with maternal diabetes. J. Mol. Cell. Cardiol. 2013;60:129–141. - PubMed