. 2021 Feb 7;24(3):102157.
doi: 10.1016/j.isci.2021.102157. eCollection 2021 Mar 19.

Selective postnatal excitation of neocortical pyramidal neurons results in distinctive behavioral and circuit deficits in adulthood

Affiliations

Selective postnatal excitation of neocortical pyramidal neurons results in distinctive behavioral and circuit deficits in adulthood

William E Medendorp et al. iScience. .

Abstract

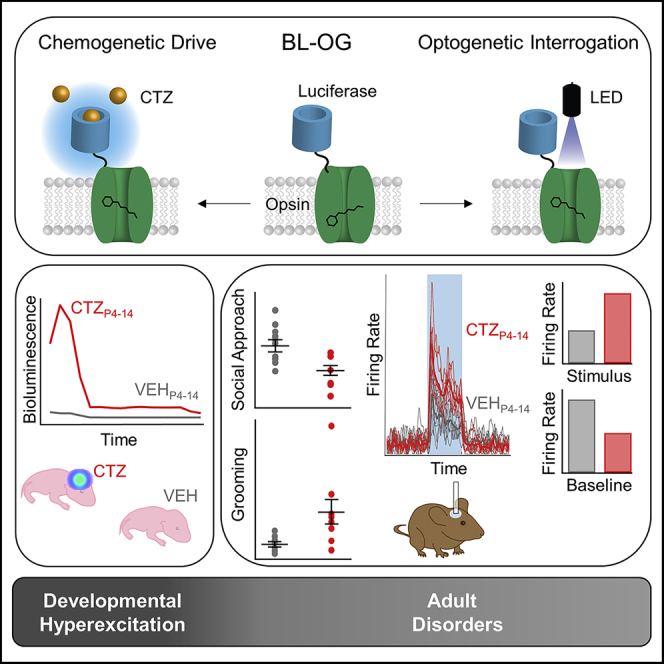
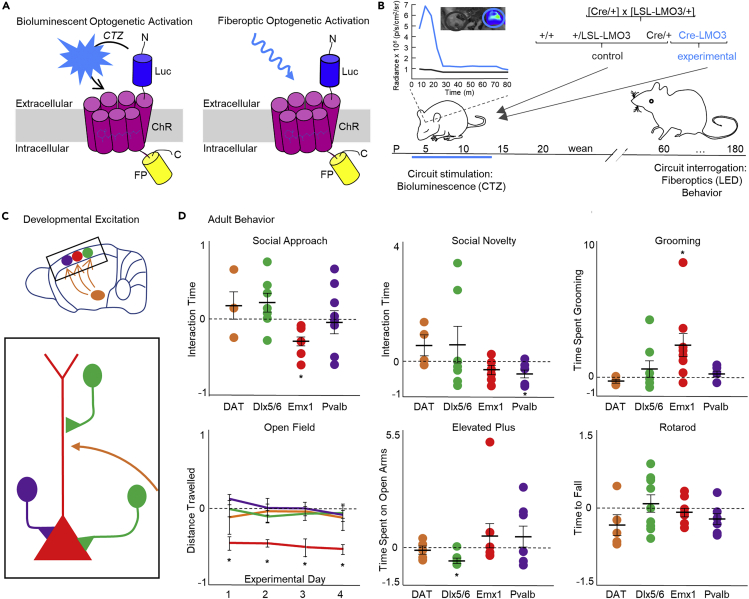
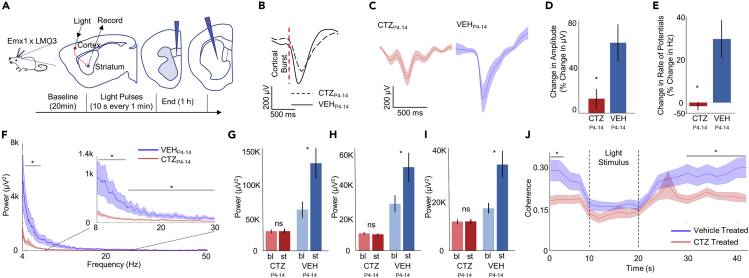
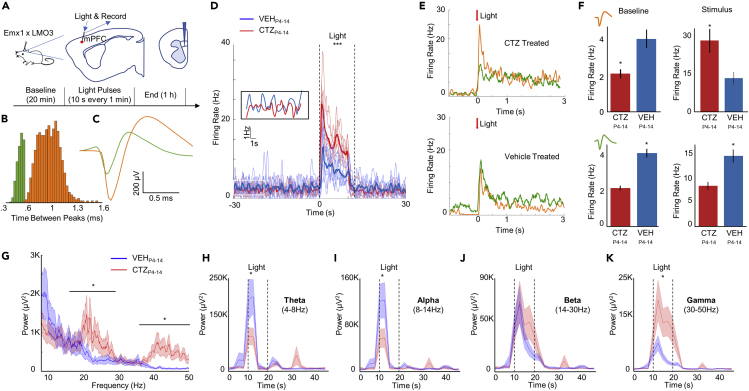
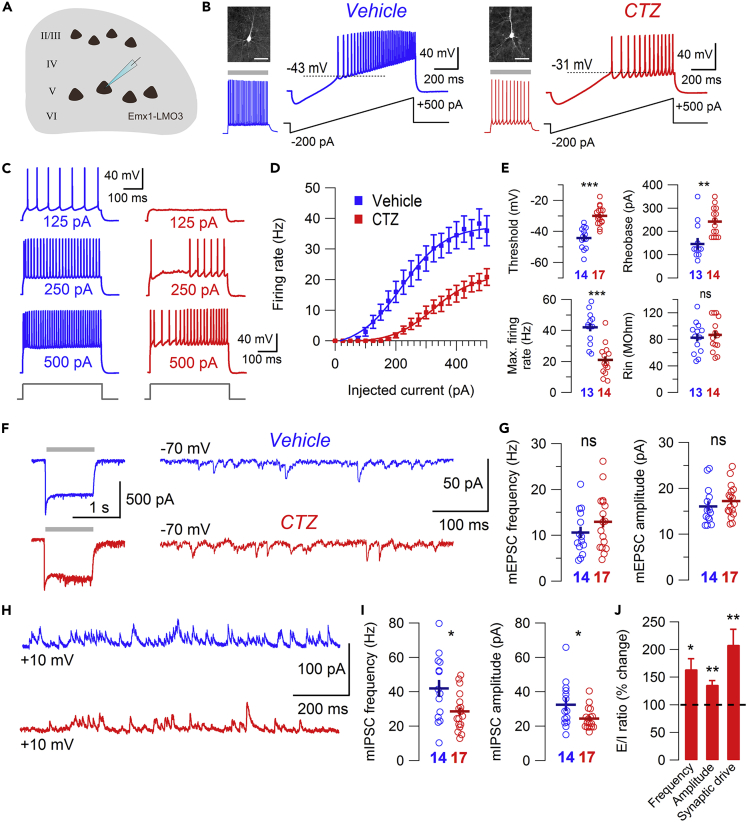
In genetic and pharmacological models of neurodevelopmental disorders, and human data, neural activity is altered within the developing neocortical network. This commonality begs the question of whether early enhancement in excitation might be a common driver, across etiologies, of characteristic behaviors. We tested this concept by chemogenetically driving cortical pyramidal neurons during postnatal days 4-14. Hyperexcitation of Emx1-, but not dopamine transporter-, parvalbumin-, or Dlx5/6-expressing neurons, led to decreased social interaction and increased grooming activity in adult animals. In vivo optogenetic interrogation in adults revealed decreased baseline but increased stimulus-evoked firing rates of pyramidal neurons and impaired recruitment of inhibitory neurons. Slice recordings in adults from prefrontal cortex layer 5 pyramidal neurons revealed decreased intrinsic excitability and increased synaptic E/I ratio. Together these results support the prediction that enhanced pyramidal firing during development, in otherwise normal cortex, can selectively drive altered adult circuit function and maladaptive changes in behavior.

Keywords: Behavioral Neuroscience; Cellular Neuroscience; Developmental Neuroscience.


Conflict of interest statement

The authors declare no competing interests.

Figures

None
Graphical abstract
Figure 1
Figure 1
Developmental hyperexcitation of Emx1 pyramidal neurons is distinctive in causing behavioral phenotypes (A) Schematics of a luminopsin (Luc, luciferase, is tethered to ChR, channelrhodopsin; FP, fluorescent protein). Application of the small molecule substrate coelenterazine (CTZ) results in production of photons and bioluminescent optogenetic activation of the nearby opsin (left). The same molecule is accessible to stimulation by a physical light source for standard fiberoptic optogenetic activation (right). (B) Experimental design. Heterozygous Cre driver mice (Cre/+) were mated with heterozygous conditional (lox-stop-lox) luminopsin-3 mice (LSL-LMO3/+), generating three groups of control mice and one group of experimental mice expressing LMO3 in cells specified by the Cre driver (Cre-LMO3). All pups of a litter were injected once a day intraperitoneally with CTZ postnatal days 4–14. Inset shows representative example of IVIS imaging of Emx1-LMO3 positive and negative pup and ROIs plotted over time. See also Figures S1 and S2. (C) Schematics of circuits targeted for developmental hyperexcitation. Color codes are used consistently for C and D: red—Emx1, green—Dlx5/6, purple—Pvalb, orange—DAT. (D) Adult behavior of developmentally hyperexcited mice. Each group of Cre (DAT, Dlx5/6, Emx1, Pvalb)-LMO3 mice is normalized to their non-LMO3 expressing controls. Bars represent mean ± SEM. See also Figure S3. N = 5-9 per group. ∗p < .05, see also Table S1.
Figure 2
Figure 2
Developmental pyramidal hyperexcitation leads to decreased cortico-striatal communication (A) Schematic of experimental setup. Laminar probes were inserted in the prelimbic area of the medial prefrontal cortex and the striatum. (B) Striatal event-related local field potentials (erLFPs) time locked to cortical action potential bursts (2 spikes in 10 ms) for adult Emx1-LMO3 mice developmentally stimulated (CTZP4-14, N = 5) and controls (VEHP4-14, N = 5). (C) erLFPs during optogenetic stimulation: CTZP4-14 mice (red) demonstrate smaller negative deflections compared with VEHP4-14 mice (blue). Shaded area represents mean ± SEM. (D) Amplitude changes of erLFPs during optogenetic stimulus normalized to baseline before stimulus. Bars represent mean ± SEM. (E) Frequency changes among erLFPs during optogenetic stimulus normalized to baseline before stimulus. Bars represent mean ± SEM. (F) Power spectra of striatal neurons during light stimulus for CTZP4-14 (red)- and VEHP4-14 (blue)-treated groups. Shaded area represents mean ± SEM. (G–I) Average power spectra for the Theta (G), Alpha (H), or Beta (I) range during baseline (bl) and stimulus (st) conditions for both CTZP4-14- and VEHP4-14-treated groups. Bars represent mean ± SEM. (J) Coherence between cortex and striatum for both CTZP4-14 (red)- and VEHP4-14 (blue)-treated mice before, during and after optogenetic stimulus. Shaded area represents mean ± SEM. ∗p < .05, see also Table S1.
Figure 3
Figure 3
Developmental pyramidal hyperexcitation leads to decreased baseline firing, enhanced stimulus-evoked firing, and decreased output connectivity in pyramidal neurons (A) Schematic of experimental setup. Laminar probes were inserted in the prelimbic area of the medial prefrontal cortex. (B) Waveforms were sorted based on time between peaks. Histogram of these peak to peak times shows a cluster of inhibitory neurons (green) and pyramidal neurons (orange). (C) Traces of waveforms from putative inhibitory (green) and pyramidal neurons (orange). (D) The group effects of optogenetic stimulation: CTZP4-14-treated mice show lower baseline levels (inset) and a consistently larger response to stimulation compared with VEHP4-14-treated mice, N = 5 per group. (E) Light-dependent responses by pyramidal and interneuron populations: CTZP4-14 mice (upper panel) show far greater pyramidal neuron response (orange trace) to light stimulation, whereas VEHP4-14 mice (lower panel) show greater interneuron response (green trace) to light stimulation. (F) Average firing rate for each group by neuron type and by time point (baseline or stimulus). Bars show mean ± SEM (upper panel—pyramidal neurons, lower panel—inhibitory neurons). (G) Time-independent power-spectra of cortical neuron LFP during light stimulus. Shaded area represents mean ± SEM. (H–K) Power over time before, during and after light stimulus for Theta (H), Alpha (I), Beta (J), and Gamma (K) frequency ranges. Shaded area represents mean ± SEM. ∗p < .05, see also Table S1.
Figure 4
Figure 4
Developmental pyramidal hyperexcitation produces enduring alterations in intrinsic excitability and synaptic E/I ratio of L5 prefrontal cortex pyramidal neurons (A) Schematic of mouse prefrontal cortex brain slice featuring LMO3 pyramidal neurons. (B) Firing response of biocytin-filled L5 prefrontal cortex pyramidal neurons to depolarizing current ramps (dotted line indicates threshold) in VEHP4-14 (blue) and CTZP4-14 (red) groups (scale bars: 100 μm). LMO3 expression confirmed with blue light stimulation. (C) Example traces of firing response to depolarizing square current injections of increasing magnitude. (D) Frequency-current relationship of L5 pyramidal neurons. Bars represent mean ± SEM. (E) Summary graphs showing effect of developmental hyperexcitation on firing threshold, rheobase, maximum firing rate, and input resistance. Bars represent mean ± SEM. (F) Example traces of mEPSCs recorded from LMO3 positive L5 pyramidal neurons (LMO3 expression confirmed with blue light stimulus at −70 mV, left). (G) Summary graphs showing effect of developmental hyperexcitation on mEPSC frequency and amplitude. Bars represent mean ± SEM. (H) Example traces of mIPSCs recorded from LMO3 positive L5 pyramidal neurons. (I) Summary graphs showing effect of developmental hyperexcitation on mIPSC frequency and amplitude. Bars represent mean ± SEM. (J) Summary graph showing effect of developmental hyperexcitation on E/I ratio of mPSC frequency, amplitude, and synaptic drive. Bars represent mean ± SEM. ∗p < 0.05, ∗∗pP < 0.01, ∗∗∗p < 0.001. See also Table S1.

References

    1. Amaral D.G. Examining the Causes of Autism. Cerebrum. 2017;2017 cer-01-17. - PMC - PubMed
    1. Andreae L.C., Burrone J. The role of neuronal activity and transmitter release on synapse formation. Curr. Opin. Neurobiol. 2014;27:47–52. - PMC - PubMed
    1. Antoine M.W., Langberg T., Schnepel P., Feldman D.E. Increased excitation-inhibition ratio stabilizes synapse and circuit excitability in four autism mouse models. Neuron. 2019;101:648–661.e4. - PMC - PubMed
    1. Atallah B.V., Scanziani M. Instantaneous modulation of gamma oscillation frequency by balancing excitation with inhibition. Neuron. 2009;62:566–577. - PMC - PubMed
    1. Backman C.M., Malik N., Zhang Y., Shan L., Grinberg A., Hoffer B.J., Westphal H., Tomac A.C. Characterization of a mouse strain expressing Cre recombinase from the 3’ untranslated region of the dopamine transporter locus. Genesis. 2006;44:383–390. - PubMed