. 2021 Jan 6:3:100041.
doi: 10.1016/j.bioflm.2020.100041. eCollection 2021 Dec.

Oral seeding and niche-adaptation of middle ear biofilms in health

Affiliations

Oral seeding and niche-adaptation of middle ear biofilms in health

Joo-Young Lee et al. Biofilm. .

Abstract

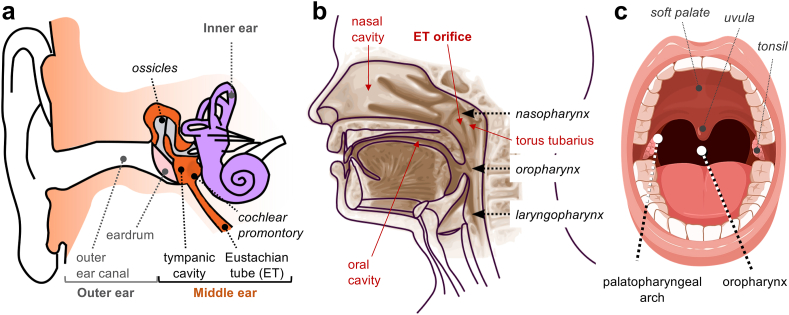
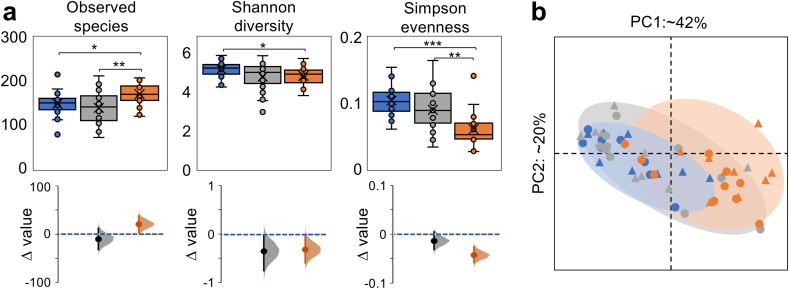
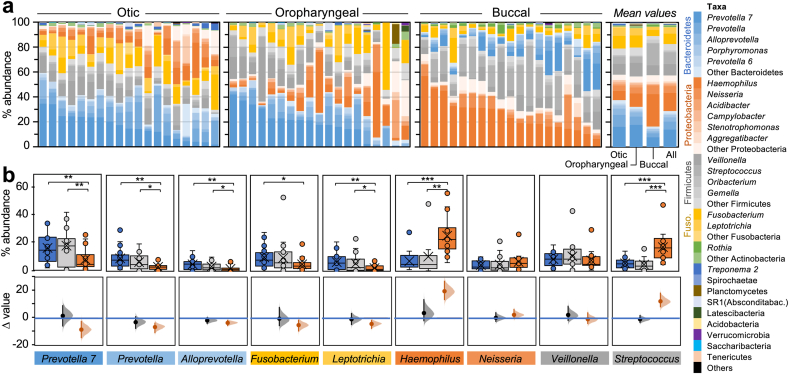
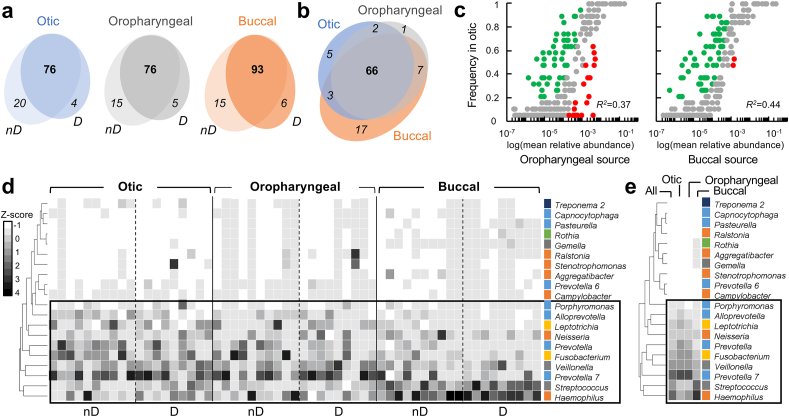
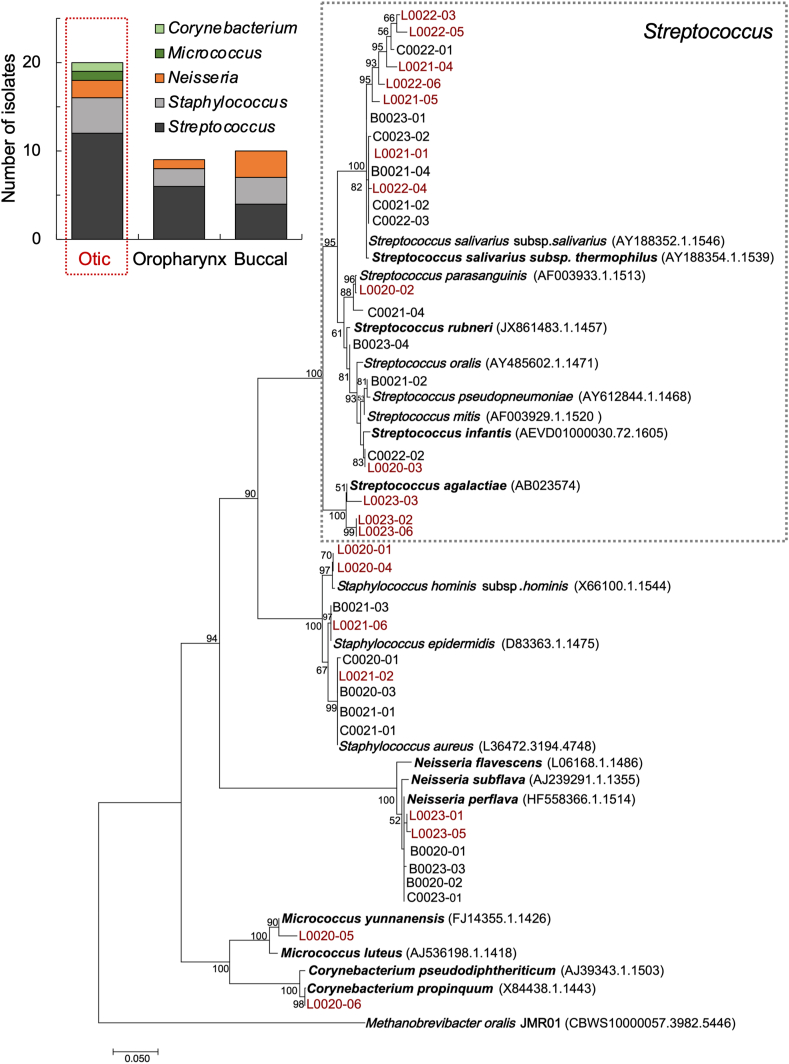
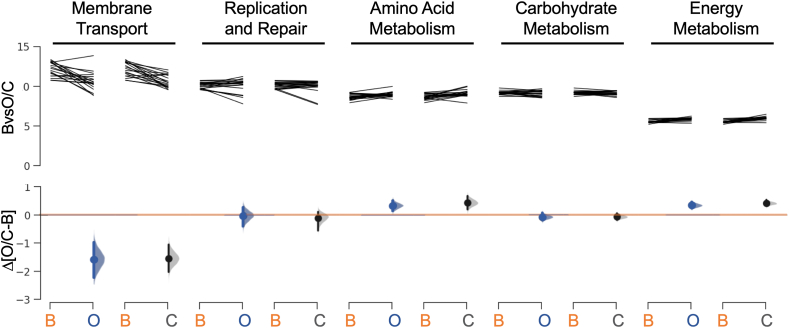
The entrenched dogma of a sterile middle ear mucosa in health is incongruent with its periodic aeration and seeding with saliva aerosols. To test this, we sequenced 16S rRNA-V4 amplicons from otic secretions collected at the nasopharyngeal orifice of the tympanic tube and, as controls, oropharyngeal and buccal samples. The otic samples harbored a rich diversity of oral keystone genera and similar functional traits but were enriched in anaerobic genera in the Bacteroidetes (Prevotella and Alloprevotella), Fusobacteria (Fusobacterium and Leptotrichia) and Firmicutes (Veillonella) phyla. Facultative anaerobes in the Streptococcus genus were also abundant in the otic and oral samples but corresponded to distinct, and sometimes novel, cultivars, consistent with the ecological diversification of the oral migrants once in the middle ear microenvironment. Neutral community models also predicted a large contribution of oral dispersal to the otic communities and the positive selection of taxa better adapted to growth and reproduction under limited aeration. These results challenge the traditional view of a sterile middle ear in health and highlight hitherto unknown roles for oral dispersal and episodic ventilation in seeding and diversifying otic biofilms.

Keywords: Divers; ET, Eustachian tube; Eustachian tube; Middle ear; OTUs, Operational taxonomic units; Oral dispersal; Otic infections; Otic microbiome; PCR, Polymerase chain reaction; PCoA, Principle coordinates analysis; rRNA, Ribosomal RNA.


Conflict of interest statement

The authors declare that they have no competing interests.

Figures

Fig. 1
Fig. 1
Anatomy of the ear, pharynx and oral cavity. (a) Anatomic structures in the outer, middle, and inner ear (illustration modified from Iain at the English Wikipedia, CC BY-SA 3.0). (b) Lateral cross section of the head showing the oral and nasal cavities, the three pharyngeal regions (naso-, oral-, and laryngo-) and the mucosal folds around the ET orifice and torus tubarius (illustration modified from Sémhur at Wikimedia Commons, CC BY-SA 3.0). (c) Frontal view of the oral cavity (licensed from Biorender and edited to add labels).
Fig. 2
Fig. 2
Genus diversity in otic secretions.(a) Alpha diversity of the otic (blue), oropharyngeal (gray) and buccal (orange) communities based on richness (observed species), diversity (Shannon index) and evenness (Simpson index). Box plots show 50% of the diversity values in boxes, 25th and 75th percentiles as whiskers, median (line across the boxes), average (cross), outliers (circles outside the boxes) and confidence value from t-test comparisons (∗, p ​< ​0.05; ∗∗, p ​< ​0.01; ∗∗∗, p ​< ​0.001; exact confidence values in Supplementary Table 4). Estimation graphics at the bottom show the mean (circle) diversity difference (Δ) of oropharyngeal or buccal samples versus the otic mean diversity (dashed blue line), the complete Δ distribution of values (shaded curve) and the 95% confidence interval of Δ (vertical line). (b) Principal Coordinates Analysis (PCoA) of weighted UniFrac distance in non-divers (circles) and divers (triangles) showing the spatial clustering of otic (blue) and buccal (orange) samples and overlap of these clusters with the central oropharyngeal samples (gray). Axes PC1 and PC2 show the proportion (%) of variance explained. (For interpretation of the references to color in this figure legend, the reader is referred to the Web version of this article.)
Fig. 3
Fig. 3
Genus-level structure of the otic communities in reference to oropharyngeal and buccal microbiomes. (a) Inter-individual differences in mean relative abundance (%) of genera (color-coded by phylum) at each collection site (b) Distribution of relative abundance values (top) and estimation plots (bottom) for dominant (>1%) otic genera. Data are color-coded for the otic (blue), oropharyngeal (gray) and buccal (orange) samples. Boxes in the bloxplots contain 50% of the values (horizontal line, median), whiskers the 25th and 75th percentiles, outliers (circles outsides the boxes) and t-test confidence values (∗, p ​< ​0.05; ∗∗, p ​< ​0.01; ∗∗∗, p ​< ​0.001). Estimation plots showing the mean difference (Δ, solid circle) between otic (blue line at zero) and oropharyngeal (gray) or buccal (orange) samples, the complete Δ distribution (shaded curve), and 95% confidence interval of Δ (vertical line). Statistic values used to assess significance of the data are shown Supplementary Table 4. (For interpretation of the references to color in this figure legend, the reader is referred to the Web version of this article.)
Fig. 4
Fig. 4
Distribution and abundance of otic, oropharyngeal and buccal genera.(ab) Core membership of genera shared by at least half of non-divers (nD) and divers (D) at each collection site (a) and among all microbiomes (b). (c) Neutral model fit of otic community assembly with the oropharyngeal or buccal communities as potential sources (R2, goodness of fit). Gray symbols represent neutrally distributed OTUs (within 95% confidence interval around the best-fit). Taxa above (green) or below (red) the confidence interval are more likely to be positively (over-represented) or negatively (under-represented) selected in the middle ear, respectively. (de) Heatmaps of individual (d) or average (e) Z-score transformed relative abundance (normalized z-score ​> ​−1.0) of the 20 dominant genera (color-coded by phylum: Bacteroidetes, blue; Fusobacteria, yellow; Firmicutes, gray; Proteobacteria, orange; Actinobacteria, green; Spirochaeta, dark blue; SR1, light blue; Planctomycetes, dark gold). (For interpretation of the references to color in this figure legend, the reader is referred to the Web version of this article.)
Fig. 5
Fig. 5
Taxonomic and phylogenetic characterization of otic, oropharyngeal and buccal cultivars. The graph shows the number and genus assignment (based on 16S rRNA sequence) of otic, oropharyngeal and buccal isolates. The maximum-likelihood tree built with 16S rRNA sequences shows the phylogenetic placement of the otic (“L” designation, in maroon), oropharyngeal (“C”) and buccal (“B”) isolates and the closest strains (accession numbers, in parentheses). The scale bar indicates 5% divergence of 16S rRNA sequences filtered to a conservation threshold above 70% using the Living Tree Project (LTP) database [51,80]. The numbers at each node are bootstrap probabilities by 1000 replications above 50%. (For interpretation of the references to color in this figure legend, the reader is referred to the Web version of this article.)
Fig. 6
Fig. 6
Taxonomic-based prediction of dominant metabolic functions. Pairwise comparisons of the abundance of the top 5 metabolic functions represented in the buccal (B) versus otic (O) or oropharyngeal (C; for center of the oropharynx) samples. Data from the statistical analyses is available in Supplementary Table 4.

Similar articles

Cited by

References

    1. Bassis C.M., Erb-Downward J.R., Dickson R.P., Freeman C.M., Schmidt T.M., Young V.B., Beck J.M., Curtis J.L., Huffnagle G.B. Analysis of the upper respiratory tract microbiotas as the source of the lung and gastric microbiotas in healthy individuals. mBio. 2015;6 doi: 10.1128/mBio.00037-15. - DOI - PMC - PubMed
    1. Bluestone C.D. BC Decker Inc; Hamilton, Ontario: 2005. The Eustachian Tube: structure, function, and role in the middle ear.
    1. Bomar L., Brugger S.D., Lemon K.P. Bacterial microbiota of the nasal passages across the span of human life. Curr Opin Microbiol. 2018;41:8–14. doi: 10.1016/j.mib.2017.10.023. - DOI - PMC - PubMed
    1. Caporaso J.G., Kuczynski J., Stombaugh J., Bittinger K., Bushman F.D., Costello E.K., Fierer N., Pena A.G., Goodrich J.K., Gordon J.I., Huttley G.A., Kelley S.T., Knights D., Koenig J.E., Ley R.E., Lozupone C.A., McDonald D., Muegge B.D., Pirrung M., Reeder J., Sevinsky J.R., Turnbaugh P.J., Walters W.A., Widmann J., Yatsunenko T., Zaneveld J., Knight R. QIIME allows analysis of high-throughput community sequencing data. Nat Methods. 2010;7:335–336. doi: 10.1038/nmeth.f.303. - DOI - PMC - PubMed
    1. Christensen-Dalsgaard J., Carr C.E. Evolution of a sensory novelty: tympanic ears and the associated neural processing. Brain Res Bull. 2008;75:365–370. doi: 10.1016/j.brainresbull.2007.10.044. - DOI - PMC - PubMed

LinkOut - more resources