. 2021 Feb 6:3:100044.
doi: 10.1016/j.bioflm.2021.100044. eCollection 2021 Dec.

Topography quantifications allow for identifying the contribution of parental strains to physical properties of co-cultured biofilms

Affiliations

Topography quantifications allow for identifying the contribution of parental strains to physical properties of co-cultured biofilms

Elif N Hayta et al. Biofilm. .

Abstract

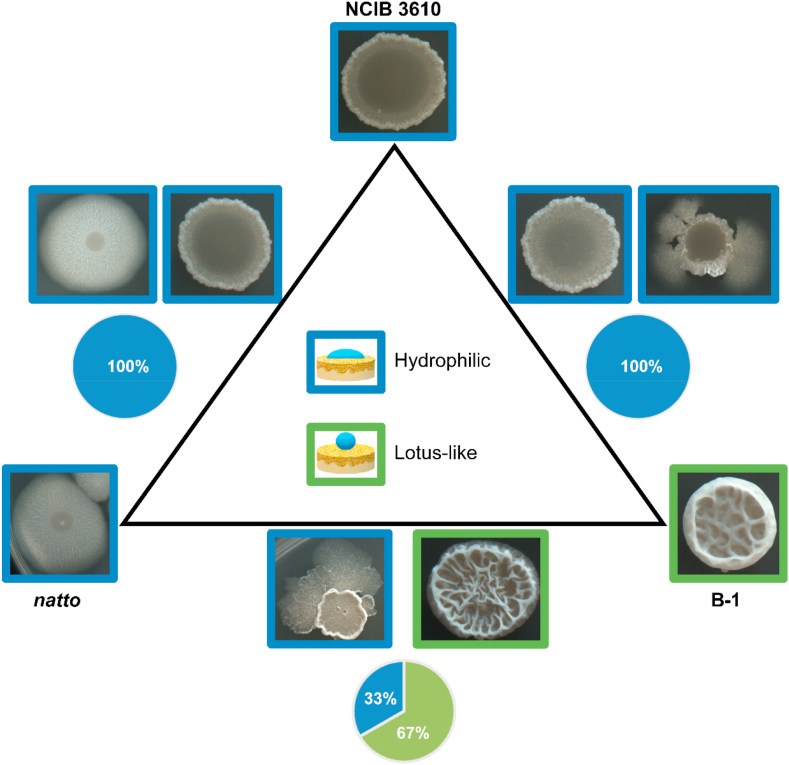
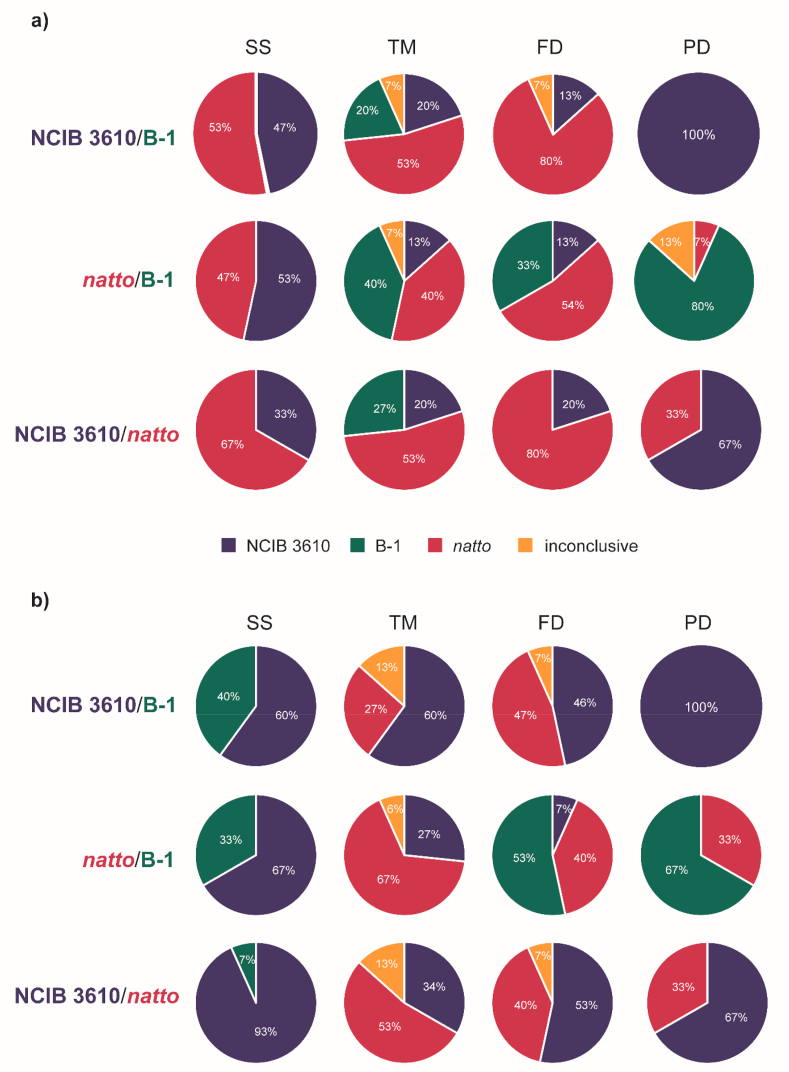
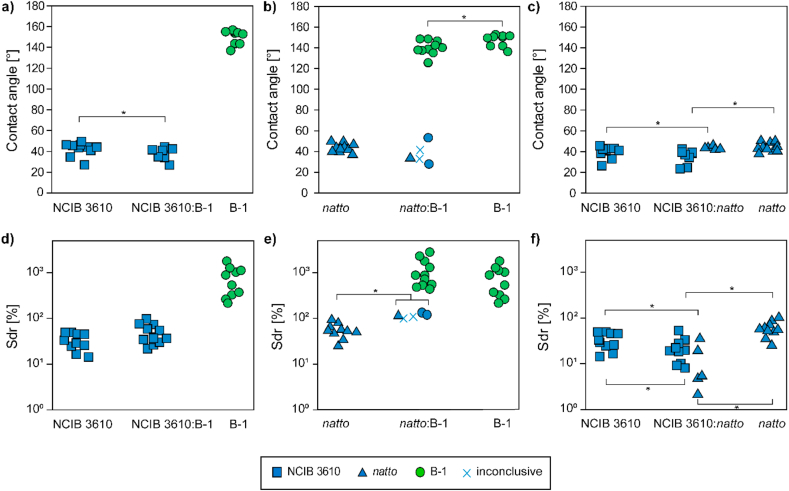
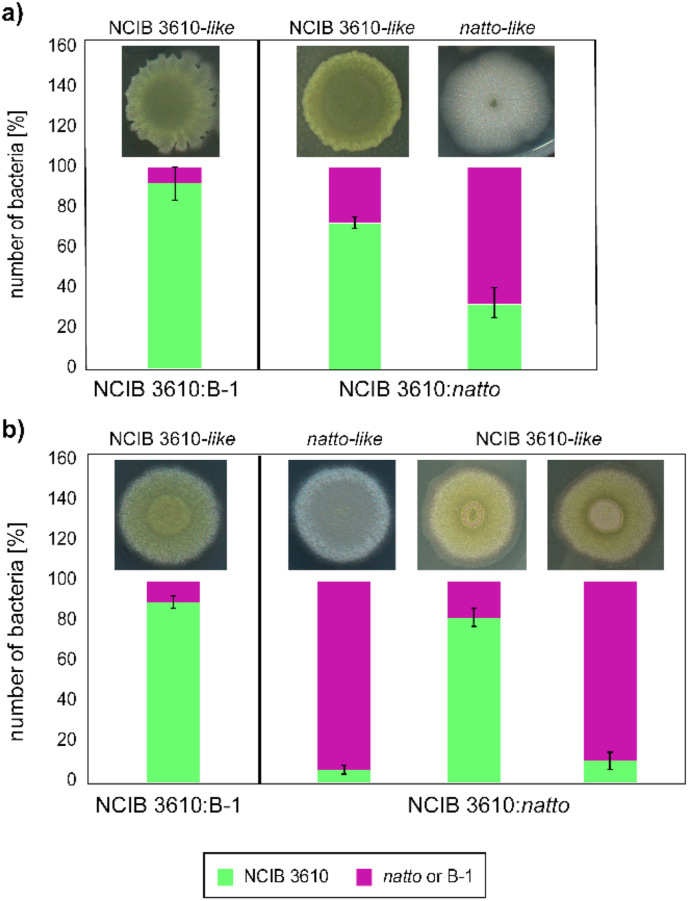
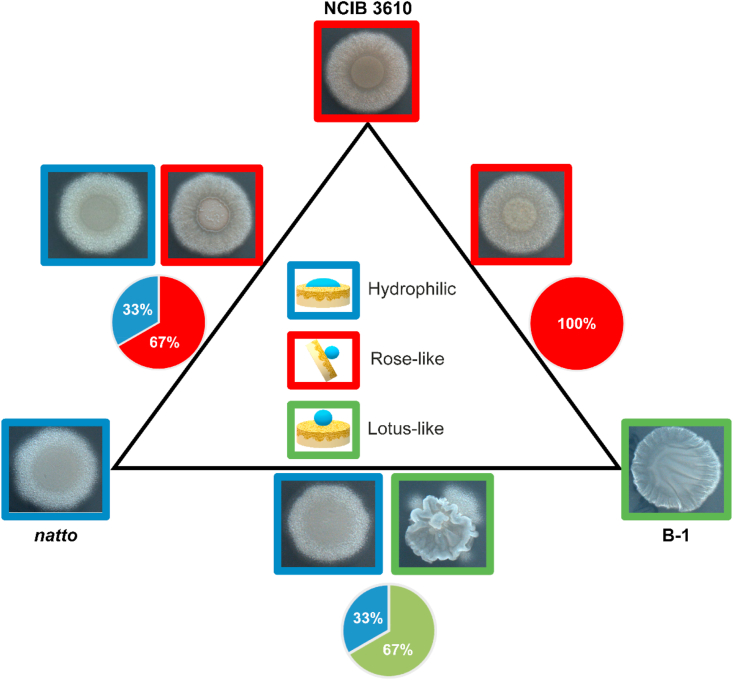
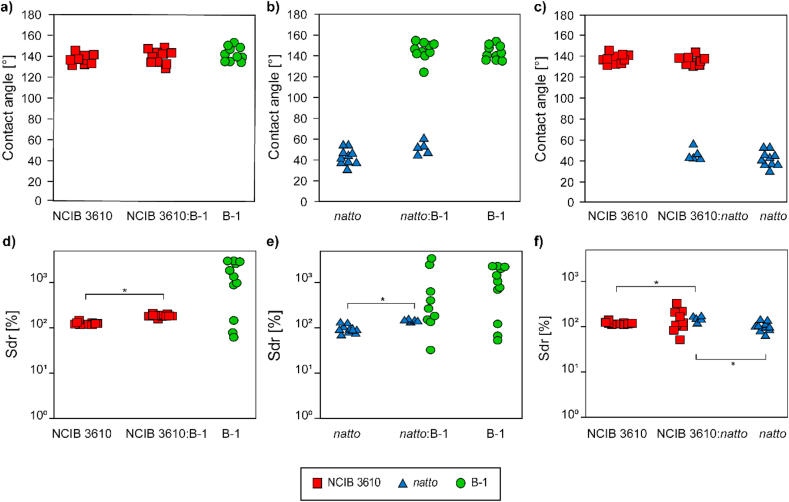
Most biofilm research has so far focused on investigating biofilms generated by single bacterial strains. However, such single-species biofilms are rare in nature where bacteria typically coexist with other microorganisms. Although, from a biological view, the possible interactions occurring between different bacteria are well studied, little is known about what determines the material properties of a multi-species biofilm. Here, we ask how the co-cultivation of two B. subtilis strains affects certain important biofilm properties such as surface topography and wetting behavior. We find that, even though each daughter colony typically resembles one of the parent colonies in terms of morphology and wetting, it nevertheless exhibits a significantly different surface topography. Yet, this difference is only detectable via a quantitative metrological analysis of the biofilm surface. Furthermore, we show that this difference is due to the presence of bacteria belonging to the 'other' parent strain, which does not dominate the biofilm features. The findings presented here may pinpoint new strategies for how biofilms with hybrid properties could be generated from two different bacterial strains. In such engineered biofilms, it might be possible to combine desired properties from two strains by co-cultivation.

Keywords: Biofilms; Computational image classification; Feature detection; Synergy; Topography; Wetting behavior.


Conflict of interest statement

The authors declare that they have no known competing financial interests or personal relationships that could have appeared to influence the work reported in this paper.

Figures

Fig. 1
Fig. 1
Overview of single-species and binary mixtures of co-cultured B. subtilis NCIB 3610, natto and B-1 biofilm colonies grown on LB agar. In each corner of the triangle, a typical example of a single strain colony is shown; in between, example images of mixture colonies are shown. The color of the image frames denotes the wetting behavior of the respective biofilm colonies; hydrophilic biofilms are indicated in blue and lotus-like superhydrophobic biofilms in green, respectively. The pie charts below the images describe the frequency at which the different wetting behaviors occur. Wetting tests on co-cultivated biofilm samples are conducted on 15 colonies grown from 3 different batches. (For interpretation of the references to color in this figure legend, the reader is referred to the Web version of this article.)
Fig. 2
Fig. 2
Biofilm colony classifications based on panel decisions (PD) and computational methods evaluating the macromorphological appearance of the co-cultured colonies. The three algorithms make use of structural similarity (SS), template matching (TM) and feature detection (FD) equations (see SI for details). The pie charts depict pooled results from 15 co-cultured colonies grown on LB (a) and MSgg agar (b).
Fig. 3
Fig. 3
Quantitative characterization of different biofilm colonies grown on LB agar. Contact angle and surface roughness (Sdr) values are obtained on the center biofilm colonies generated from co-cultured NCIB 3610/B-1 (a,d), natto/B-1 (b,e) and NCIB 3610/natto (c,f) colonies and compared to values obtained from single-strain colonies. Each symbol denotes the average value of three technical replicates obtained from one colony. The data is sorted according to the panel decision regarding the morphological dominance of either NCIB 3610 (□), natto (Δ) or B-1 (○) in the co-cultured colonies. If the panel voting did not lead to a conclusive result, those colonies are indicated by a cross (X). The detailed wetting behavior of the biofilm colonies is indicated by the color of the marker: green color represents lotus-like superhydrophobic behavior and blue color represents hydrophilic behavior. Asterisks denote statistical significances based on a p-value of p ​= ​0.05. Even though we find significant differences between the contact angles and Sdr values of all single-strain ‘parent’ colonies (when compared pair-wise), this is not marked in the figure for simplicity. (For interpretation of the references to color in this figure legend, the reader is referred to the Web version of this article.)
Fig. 4
Fig. 4
Microbial growth of planktonic B. subtilis NCIB 3610, natto and B-1 bacteria at 37 ​°C. Growth in LB (a) and MSgg (b) media is quantified by determining the optical density (OD600). Error bars indicate the standard deviation as obtained from 3 biological replicates.
Fig. 5
Fig. 5
Strain identification in the center of co-cultured B. subtilis biofilm colonies as assessed by fluorescence microscopy. The coexistence ratio of fluorescent NCIB 3610 bacteria and another, non-fluorescent strain (either natto or B-1) is shown for different sub-groups (see main text) of co-cultured biofilm colonies grown on LB (a) and MSgg (b) agar. Error bars represent the standard deviation as obtained from at least 5 different colonies.
Fig. 6
Fig. 6
Overview of single-species and binary mixtures of co-cultured B. subtilis NCIB 3610, natto and B-1 biofilm colonies grown on MSgg agar. In each corner of the triangle, a typical example of a single strain colony is shown; in between, example images of mixture colonies are shown. The color of the image frames denotes the wetting behavior of the respective biofilm colonies; hydrophilic biofilms are indicated in blue, rose-like superhydrophobic biofilms in red, and lotus-like superhydrophobic biofilms in green. The pie charts below the images describe the frequency at which the different wetting behaviors occur. Wetting tests on co-cultivated biofilm samples are conducted on at least 15 colonies grown from 3 different batches. (For interpretation of the references to color in this figure legend, the reader is referred to the Web version of this article.)
Fig. 7
Fig. 7
Quantitative characterization of different biofilm colonies grown on MSgg agar. Contact angle and surface roughness (Sdr) values are obtained on the center biofilm colonies generated from co-cultured NCIB 3610/B-1 (a,d), natto/B-1 (b,e) and NCIB 3610/natto (c,f) colonies and compared to values obtained from single-strain colonies. Each symbol denotes the average value of three technical replicates obtained from one colony. The data is sorted according to the panel decision regarding the morphological dominance of either NCIB 3610 (□), natto (Δ) or B-1 (○) in the co-cultured colonies. The detailed wetting behavior of the biofilm colonies is indicated by the color of the marker: green color represents lotus-like superhydrophobic behavior, red color indicates rose-like superhydrophobic behavior, and blue color represents hydrophilic behavior. Asterisks denote statistical significances based on a p-value of p ​= ​0.05. Even though we find significant differences between the contact angles and Sdr values of all single-strain ‘parent’ colonies (when compared pair-wise), this is not marked in the figure for simplicity. (For interpretation of the references to color in this figure legend, the reader is referred to the Web version of this article.)

Similar articles

Cited by

References

    1. Edmunds M. On the association between Myrmarachne spp. (Salticidae) and ants. Bull Br Arachnol Soc. 1978;4:149–160.
    1. Shamble P.S., Hoy R.R., Cohen I., Beatus T. Walking like an ant: a quantitative and experimental approach to understanding locomotor mimicry in the jumping spider Myrmarachne formicaria. Proc R Soc B Biol Sci. 2017;284:20170308. doi: 10.1098/rspb.2017.0308. - DOI - PMC - PubMed
    1. Bhushan B., Nosonovsky M. The rose petal effect and the modes of superhydrophobicity. Philos Trans R Soc A Math Phys Eng Sci. 2010;368:4713–4728. doi: 10.1098/rsta.2010.0203. - DOI - PubMed
    1. Wang S., Jiang L. Definition of superhydrophobic states. Adv Mater. 2007;19:3423–3424. doi: 10.1002/adma.200700934. - DOI
    1. Shim M.H., Kim J., Park C.H. The effects of surface energy and roughness on the hydrophobicity of woven fabrics. Textil Res J. 2014;84:1268–1278. doi: 10.1177/0040517513495945. - DOI

LinkOut - more resources