. 2021 May;20(5):623-634.
doi: 10.1080/14760584.2021.1899818. Epub 2021 Mar 18.

Immunization and Drug Metabolizing Enzymes: Focus on Hepatic Cytochrome P450 3A

Affiliations

Immunization and Drug Metabolizing Enzymes: Focus on Hepatic Cytochrome P450 3A

Kristina Jonsson-Schmunk et al. Expert Rev Vaccines. 2021 May.

Abstract

Objective: Infectious disease emergencies like the 2013-2016 Ebola epidemic and the 2009 influenza and current SARS-CoV-2 pandemics illustrate that vaccines are now given to diverse populations with preexisting pathologies requiring pharmacological management. Many natural biomolecules (steroid hormones, fatty acids, vitamins) and ~60% of prescribed medications are processed by hepatic cytochrome P450 (CYP) 3A4. The objective of this work was to determine the impact of infection and vaccines on drug metabolism.

Methods: The impact of an adenovirus-based vaccine expressing Ebola glycoprotein (AdEBO) and H1N1 and H3N2 influenza viruses on hepatic CYP 3A4 and associated nuclear receptors was evaluated in human hepatocytes (HC-04 cells) and in mice.

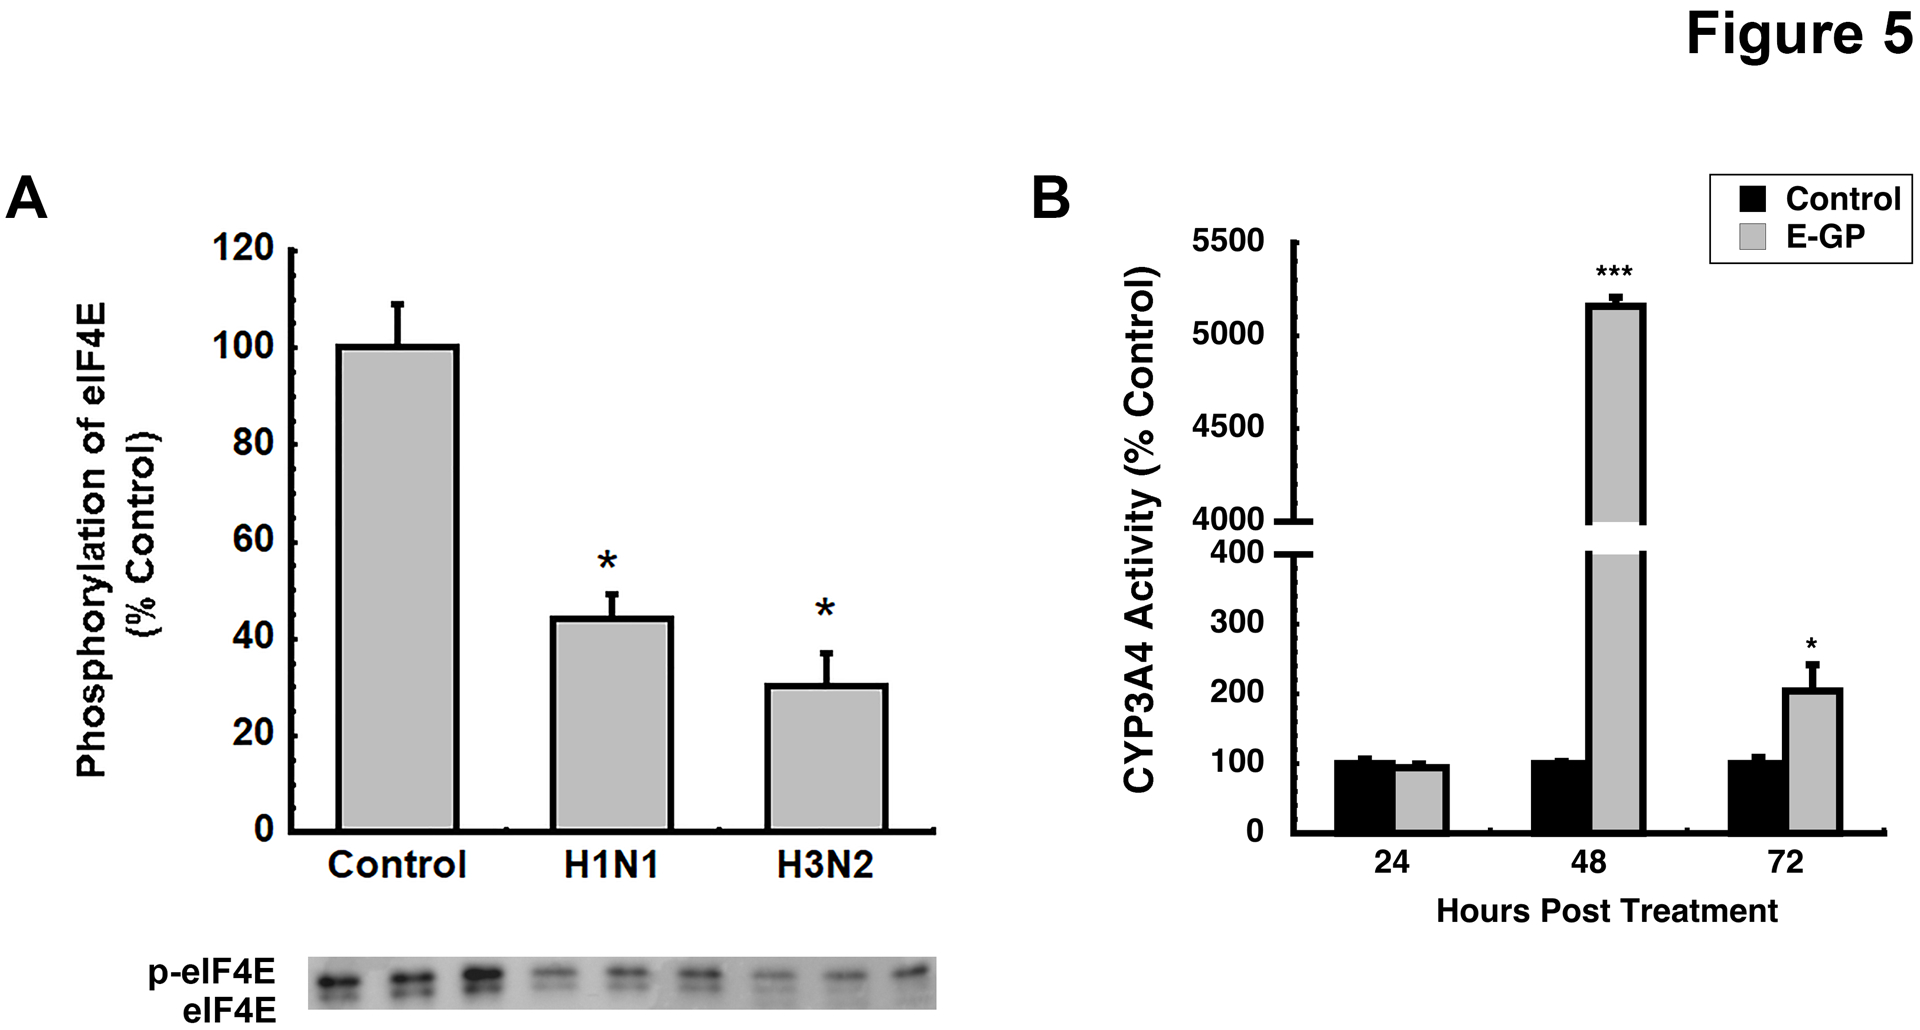
Results: CYP3A activity was suppressed by 55% in mice 24 h after administration of mouse-adapted H1N1, while ˂10% activity remained in HC-04 cells after infection with H1N1 and H3N2 due to global suppression of cellular translation capacity, indicated by reduction (70%, H1N1, 56%, H3N2) of phosphorylated eukaryotic translation initiation factor 4e (eIF4E). AdEBO suppressed CYP3A activity in vivo (44%) and in vitro (26%) 24 hours after infection.

Conclusion: As the clinical evaluation of vaccines for SARS-CoV-2 and other global pathogens rise, studies to evaluate the impact of new vaccines and emerging pathogens on CYP3A4 and other metabolic enzymes are warranted to avoid therapeutic failures that could further compromise the public health during infectious disease emergencies.

Keywords: Cytochrome P450 3A4; drug metabolism; ebola; influenza; liver; vaccine.


Conflict of interest statement

Conflicts of Interest Statement: The authors have no competing interests to declare.

Figures

Figure 1.
Figure 1.. Immunization with an Adenovirus-Based Vaccine or Infection with a Mouse-Adapted Influenza A Virus (PR8/H1N1) Significantly Suppresses Hepatic CYP3A Activity.
Six-week old C57BL/6 mice were intranasally immunized with an E1/E3 deleted recombinant adenovirus serotype 5 vector expressing a codon optimized full-length Ebola virus glycoprotein sequence under the control of the chicken β-actin promoter (AdEBO, A) and eight-week old BALB/c mice were infected intranasally with 100,000 CEID50 of the PR8/H1N1 virus (B). Twenty-four hours later, animals were euthanized along with uninfected, healthy age matched mice and livers immediately excised. Following isolation of microsomal proteins, CYP3A catalytic activity was determined. Data are reported as the mean ± standard error of values obtained from three mice for each treatment group. *p < 0.05 with respect to uninfected, saline treated mice.
Figure 2.
Figure 2.. An Adenovirus-Based Vaccine and Influenza A Viruses Significantly Suppress CYP3A4 Activity and Expression in HC-04 Cells.
Catalytic activity of CYP3A4 72 hours after (A) AdEBO infection and 48 hours after (B) H1N1 and (C) H3N2 virus infection. In panels A-C, results are reported as the ratio of activity readings of infected cells over activity readings of uninfected cells of the same passage number. CYP3A4 protein levels in (D) AdEBO infected HC-04 cells 72 hours after infection and (E) H1N1 or H3N2-infected cells 48 hours after infection. Representative blots illustrating band intensity for each treatment condition are shown under plots in the following loading order: (D) lanes 1–3 uninfected control, 4–6 AdEBO or (E) lanes 1–3 control, 4–6 H1N1 and 7–9 H3N2. (F) CYP3A4 mRNA levels 72 hours after infection with AdEBO or 48 hours after infection with H1N1 or H3N2 viruses. In each panel, data are reported as the mean ± standard error of values obtained from three culture plates per condition. *p < 0.05, **p < 0.01 and ***p < 0.001 with respect to uninfected control cells, Bonferroni Dunn post hoc test.
Figure 3.
Figure 3.. AdEBO Infection Has an Opposing Effect on Protein and mRNA Levels of Two Key Regulators of CYP3A4 Expression.
Seventy-two hours after treatment with 100 MOI of AdEBO, cell lysates were collected and analyzed for (A) RXRα, (B) PXR and (C) CAR protein content by Western blot. Representative blots illustrating band intensity for each treatment condition is shown under plots in panels (A-C) with the following loading order: lanes 1–3 uninfected control and 4–6 AdEBO infected cells. (D) mRNA levels of nuclear receptors in infected cells with respect to uninfected cells (control) as determined by qRT-PCR. In all panels (A-D), data are reported as the mean ± standard error of values obtained from 3 culture plates per condition. *p < 0.05 and **p < 0.01 Bonferroni Dunn post hoc test.
Figure 4.
Figure 4.. Infection with Influenza Viruses Significantly Alters mRNA and Protein Expression Patterns of Nuclear Receptors Involved in the Regulation of Human Hepatic CYP3A4.
HC-04 cell lysates were collected 48 hours after infection with 50 MOI of either H1N1 or H3N2 virus and assessed for protein levels of nuclear receptors: (A) RXRα, (B) PXR and (C) CAR by Western blot. Representative blots illustrating band intensity for each treatment condition is shown under each plot in panels A-C with the following loading order: lanes 1–3 control, 4–6 H1N1, 7–9 H3N2. (D) mRNA expression patterns for each nuclear receptor as determined from cellular extracts harvested 48 hours after influenza infection by qRT-PCR. Data in all panels (A-D) are reported as the mean ± standard error of values obtained from three culture plates per condition. Statistical significance was determined between individual treatment groups and uninfected controls by one-way analysis of variance with a Bonferroni/Dunn post hoc test. *p < 0.05 and **p < 0.01.
Figure 5.
Figure 5.. Mechanistic Evaluation of Changes in Hepatic Drug Metabolism During Exposure to Viruses and Expressed Antigens. A. Influenza A Virus Infection Inhibits Host Translational Machinery via eIF4E in Human Hepatocytes.
HC-04 cells were infected with either the H1N1 or H3N2 virus 48 hours before protein lysates were collected. Two different antibodies were used, one that detects eIF4E and one that specifically detects phosphorylated eIF4E at Ser209. Representative blots illustrating band intensity for each treatment condition is shown under the plot in the following loading order: lanes 1–3 uninfected control, lanes 4–6 H1N1-infected cells and lanes 7–9 H3N2-infected cells. Band intensities were measured and the ratio of phosphorylated eIF4E over total eIF4E calculated. Uninfected control cells were set to 100% and each of the treatment groups were compared to this value. B. Impact of the Ebola Glycoprotein Transgene Product on CYP3A4 Activity in Human Hepatocytes 48 and 72 Hours After Treatment. HC-04 cells were treated with 0.4 mg/ml of purified recombinant Ebola virus glycoprotein (GP33–637ΔTM-HA) and CYP3A4 activity was measured after 24, 48, and 72 hours. Since the recombinant glycoprotein carries a HA-tag, HC-04 cells were also treated with 0.4 mg/ml of HA peptide alone to eliminate any extraneous effect on CYP3A4 activity. CYP3A4 activity was also normalized against cell viability. Results are reported as the ratio of activity readings of infected cells over activity readings of uninfected cells of the same passage number. In each panel, data are reported as the mean ± standard error of values obtained from three wells per condition. *p < 0.05 and ***p < 0.001 with respect to untreated control cells using a Bonferroni Dunn post hoc test.

Similar articles

Cited by

References

    1. Ortiz de Montellano PR (2019) The Cytochrome P450 Oxidative System In Pearson PG, Wienkers LC (Eds.), Handbook of Drug Metabolism, Third Edition, Boca Raton, FL, CRC Press, pp. 57–83.
    1. Coleman MD (2020) Drug Biotransformational Systems – Origins and Aims, In Human Drug Metabolism Third Edition, Hoboken, NJ, Wiley-Blackwell, pp.17–97.
    1. Saiz-Rodríguez M, Almenara S, Navares-Gómez M, Ochoa D, et al. Effect of the Most Relevant CYP3A4 and CYP3A5 Polymorphisms on the Pharmacokinetic Parameters of 10 CYP3A Substrates. Biomedicines. 2020. 8(4):94. doi: 10.3390/biomedicines8040094. - DOI - PMC - PubMed
    1. Wright WC, Chenge J, Chen T. Structural Perspectives of the CYP3A Family and Their Small Molecule Modulators in Drug Metabolism. Liver Res. 2019. 3(3–4):132–142. - PMC - PubMed
    1. United States Food and Drug Administration, 2020, Drug Development and Drug Interactions: Table of Substrates, Inhibitors and Inducers, accessed 26 January 2021, <https://www.fda.gov/drugs/drug-interactions-labeling/drug-development-an...>

Publication types

Substances