. 2021 Mar 5:10:e59594.
doi: 10.7554/eLife.59594.

Systematic functional analysis of rab GTPases reveals limits of neuronal robustness to environmental challenges in flies

Affiliations

Systematic functional analysis of rab GTPases reveals limits of neuronal robustness to environmental challenges in flies

Friederike E Kohrs et al. Elife. .

Abstract

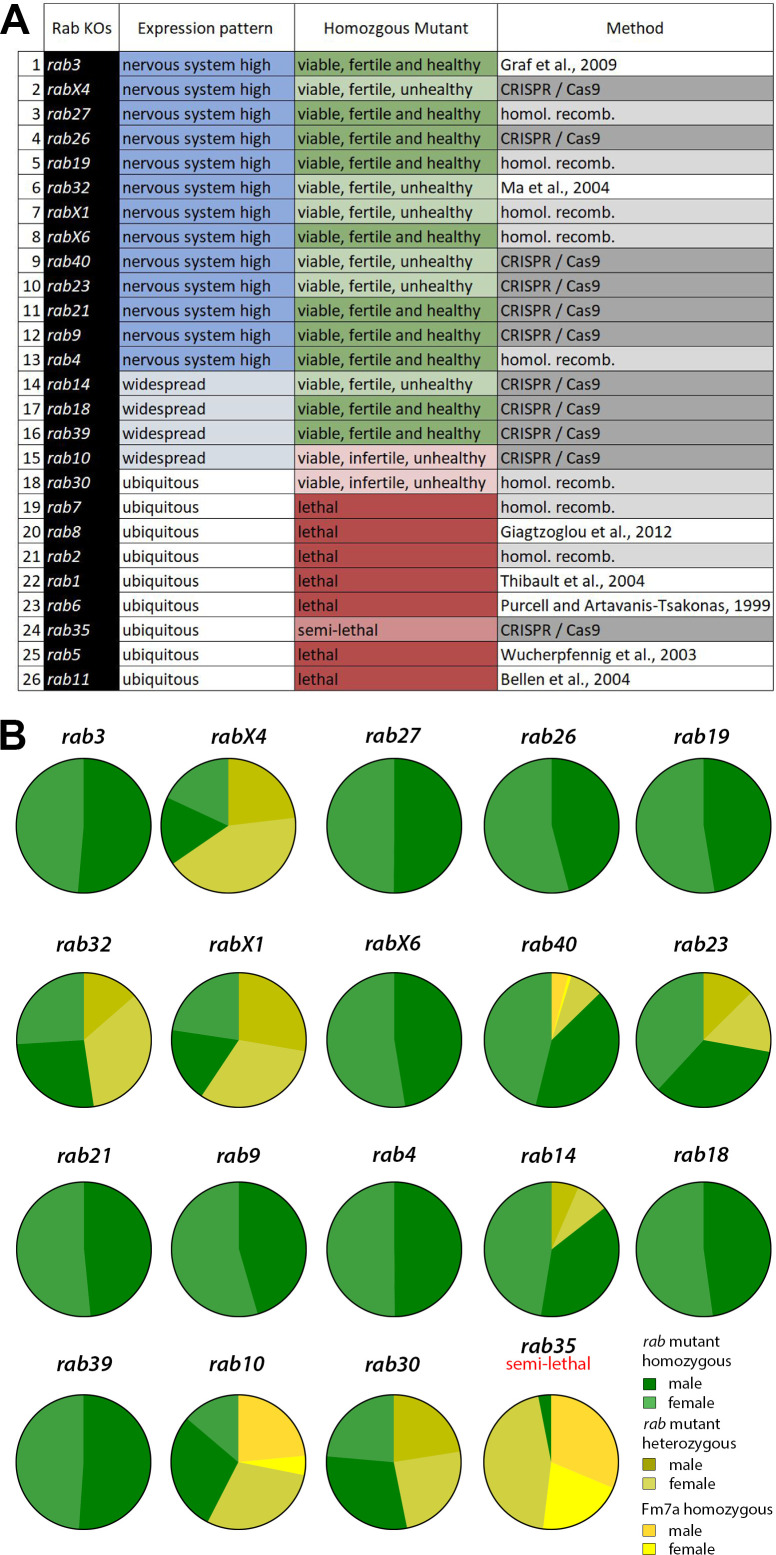
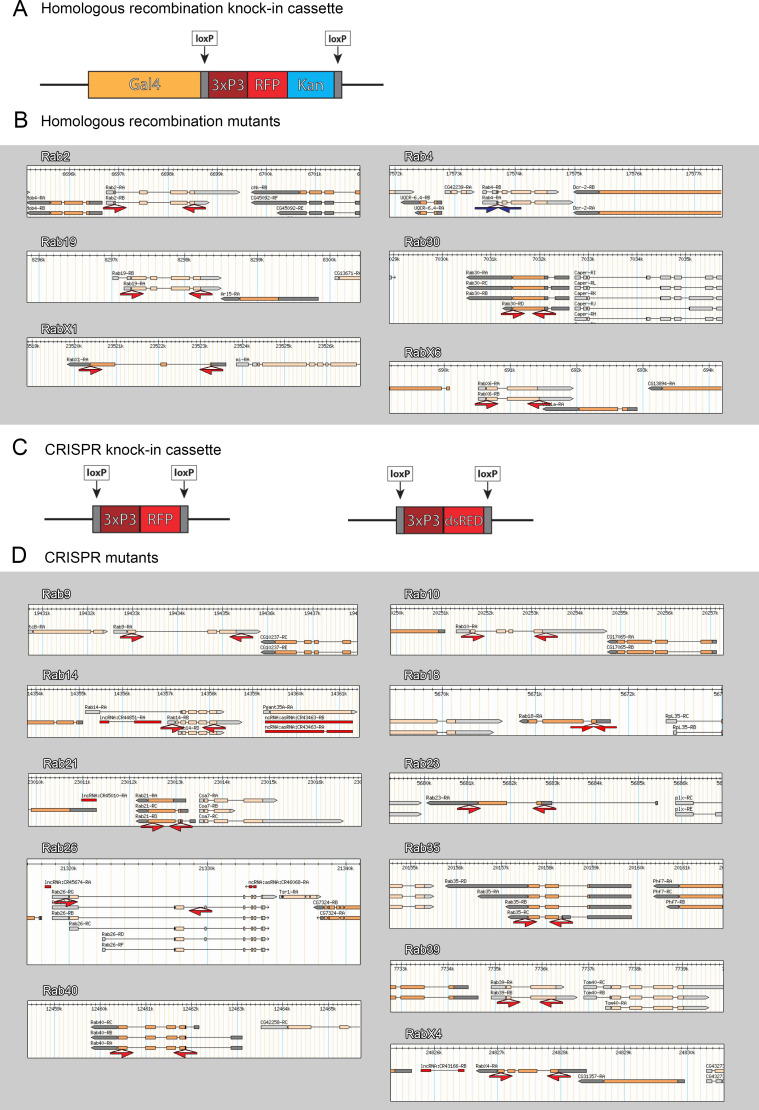
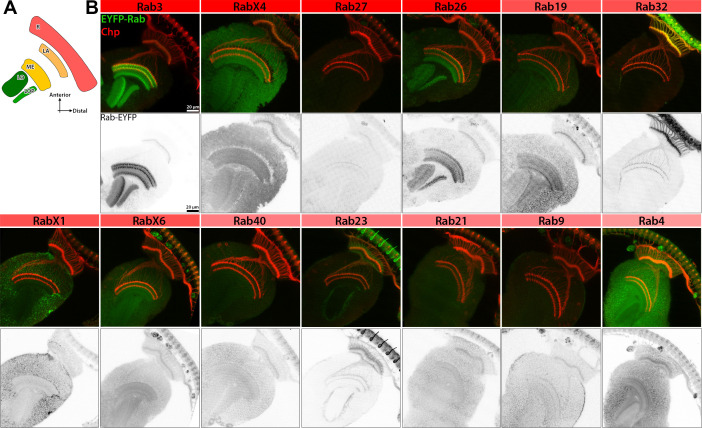
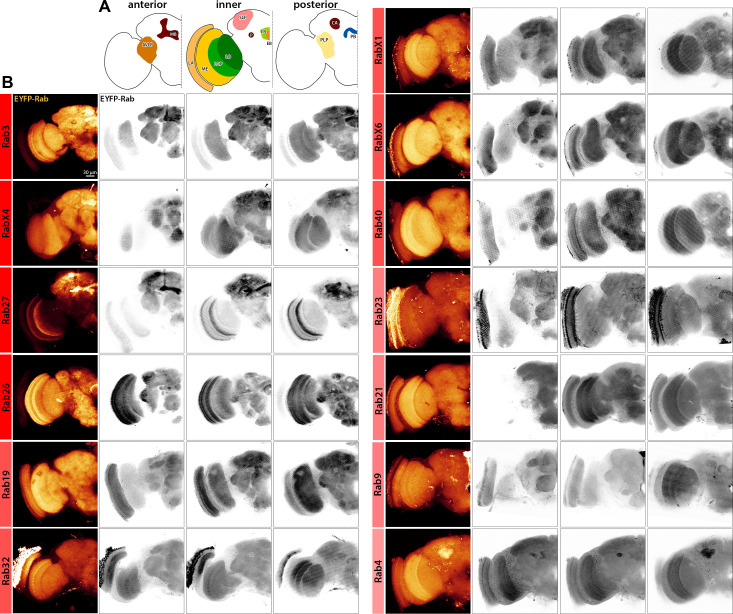
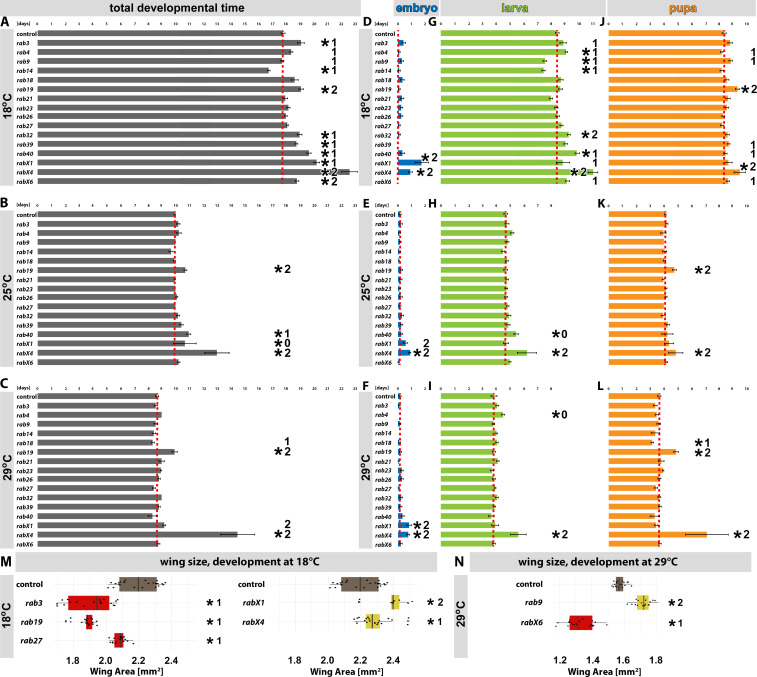
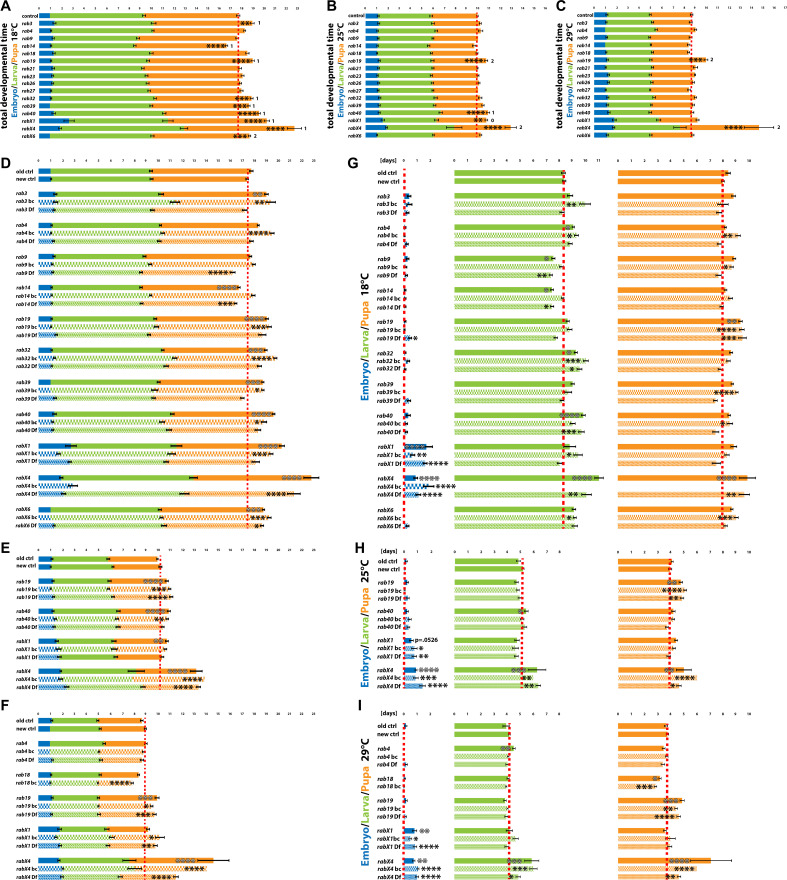
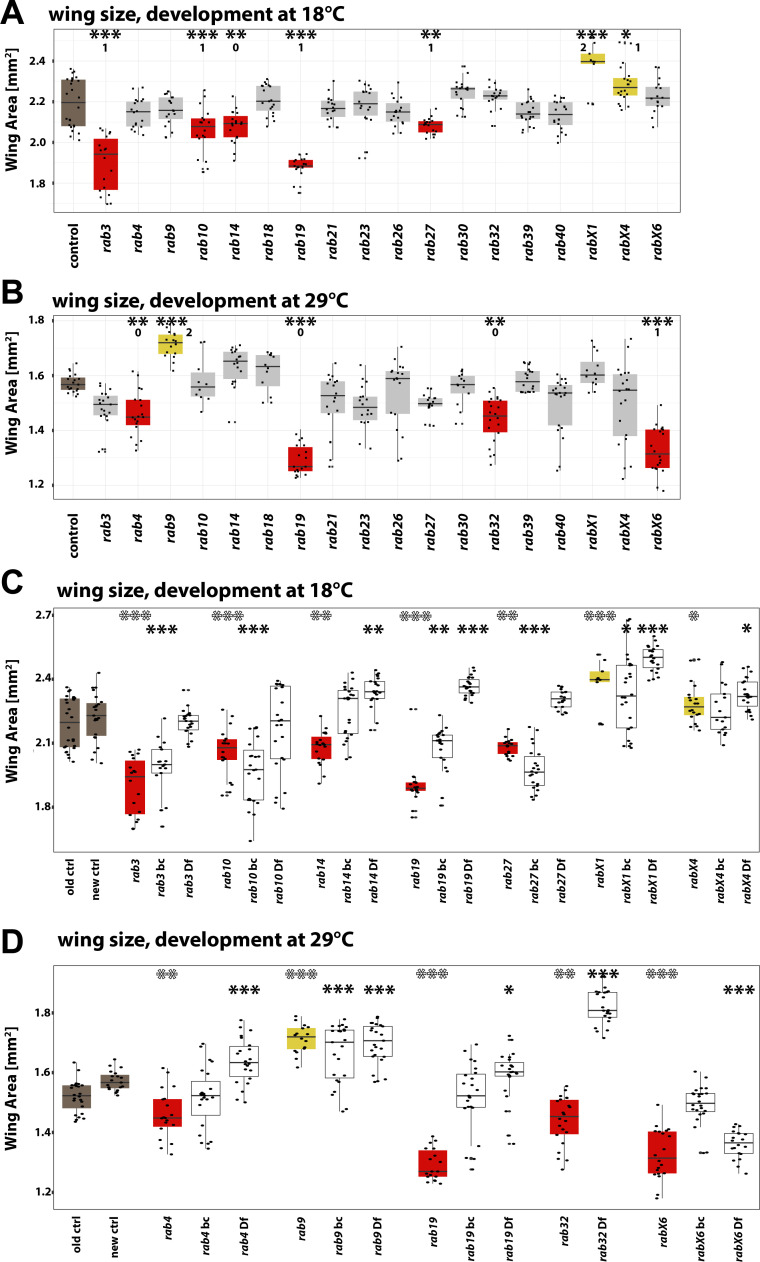
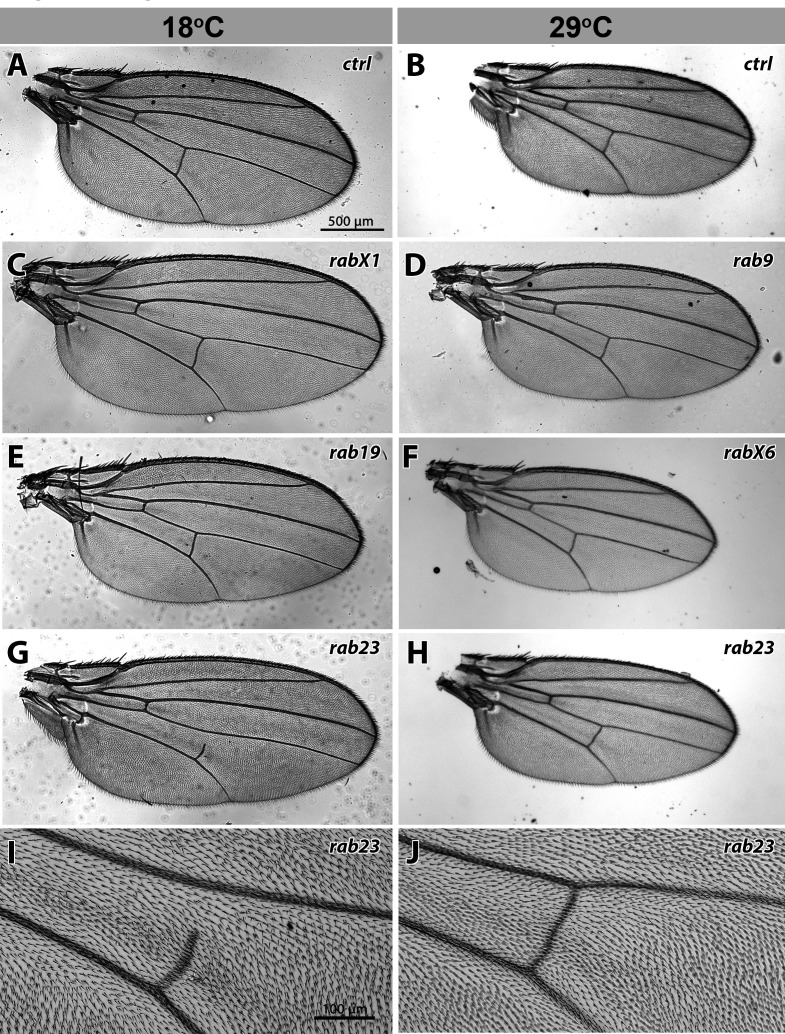
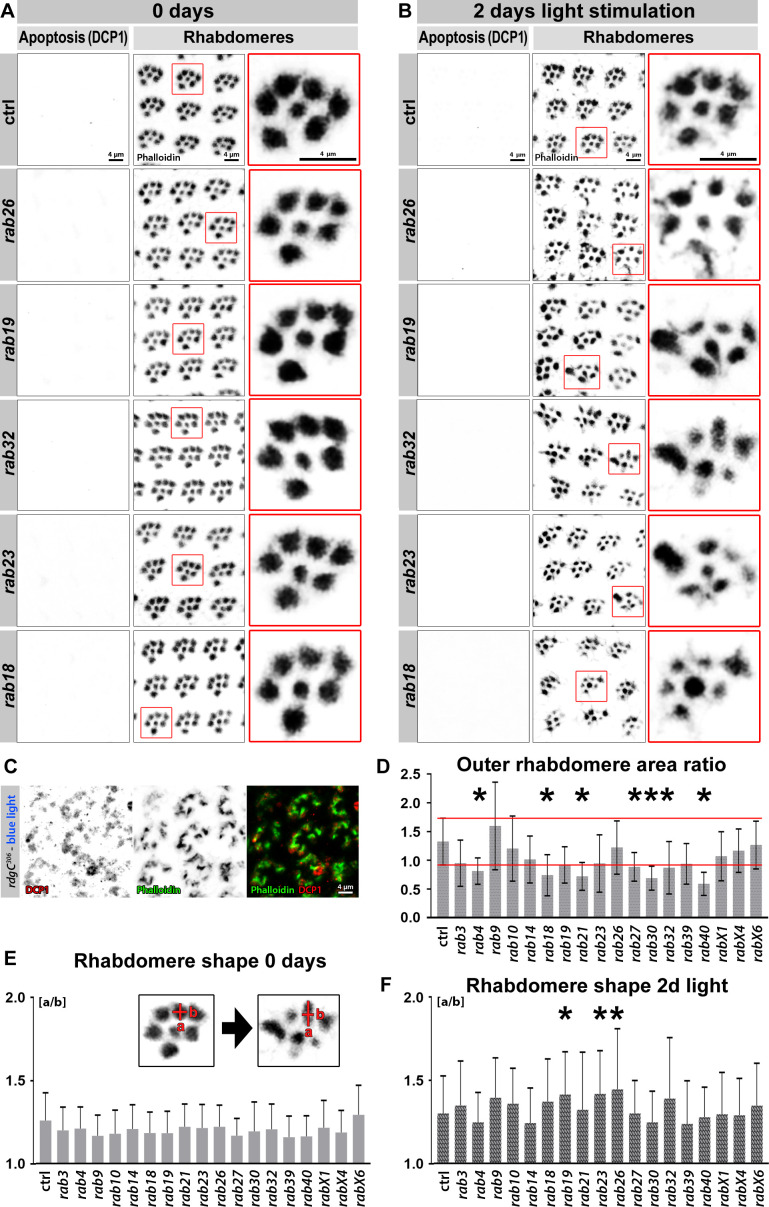
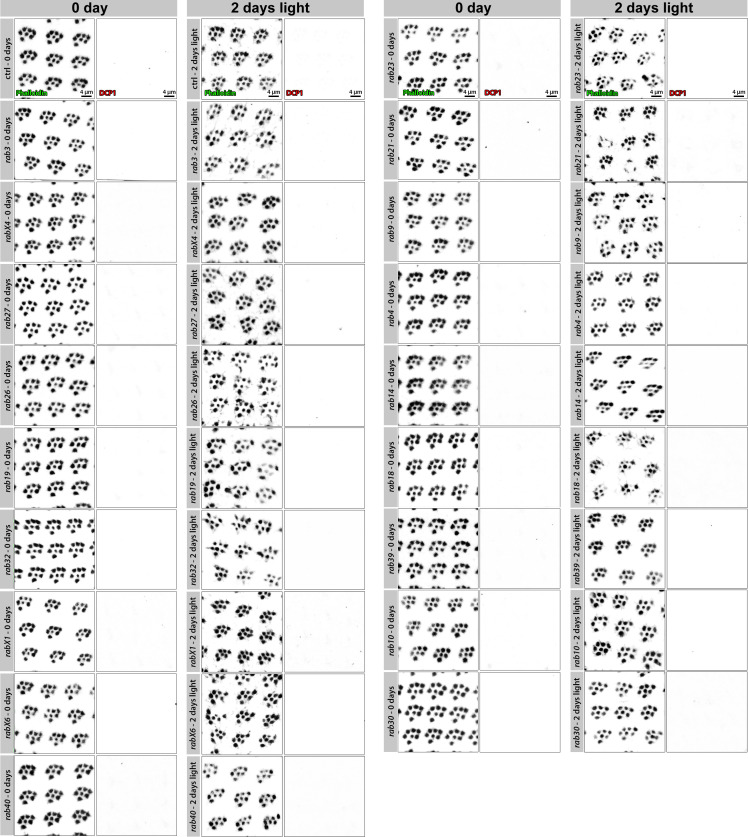
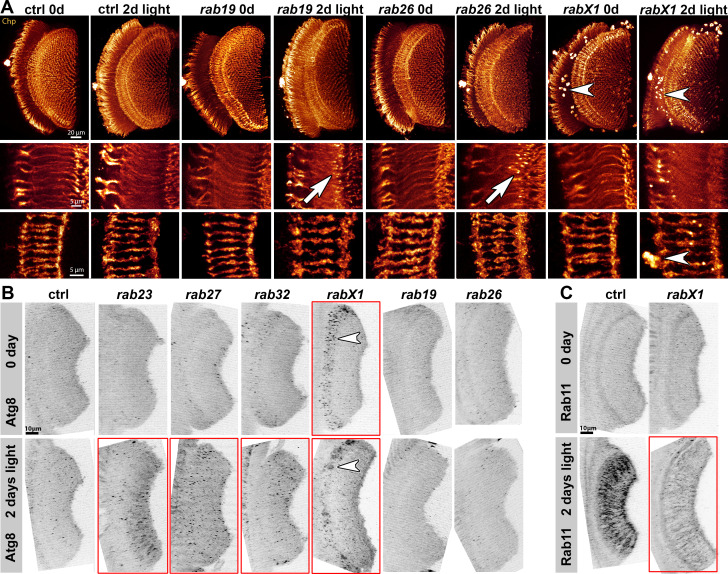
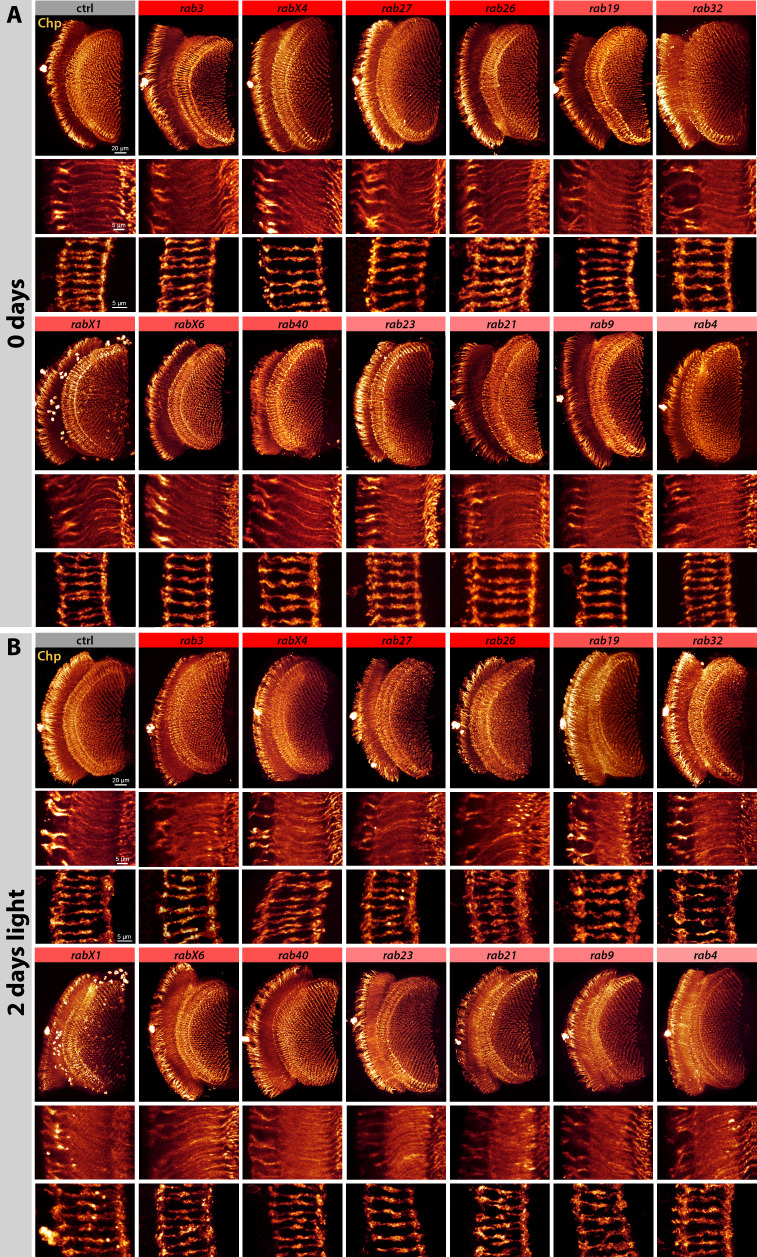
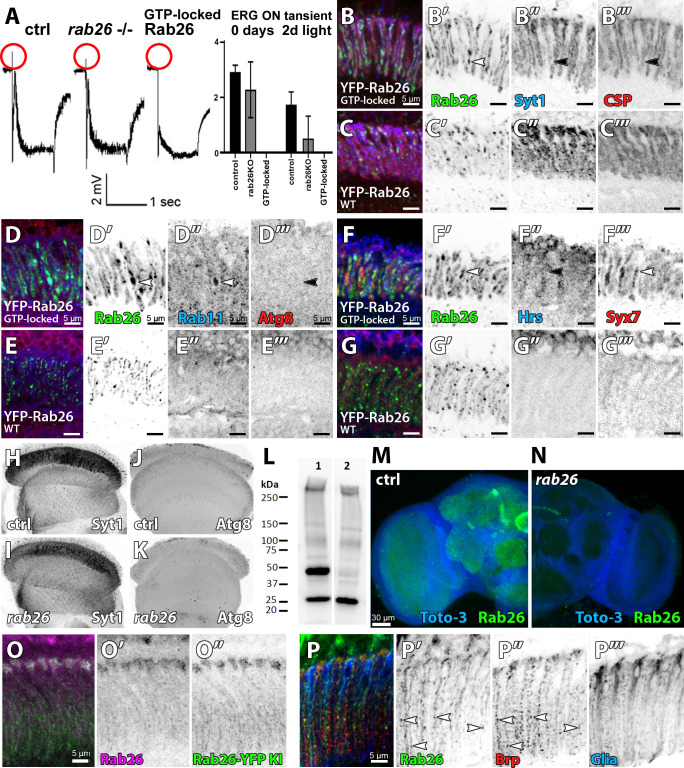
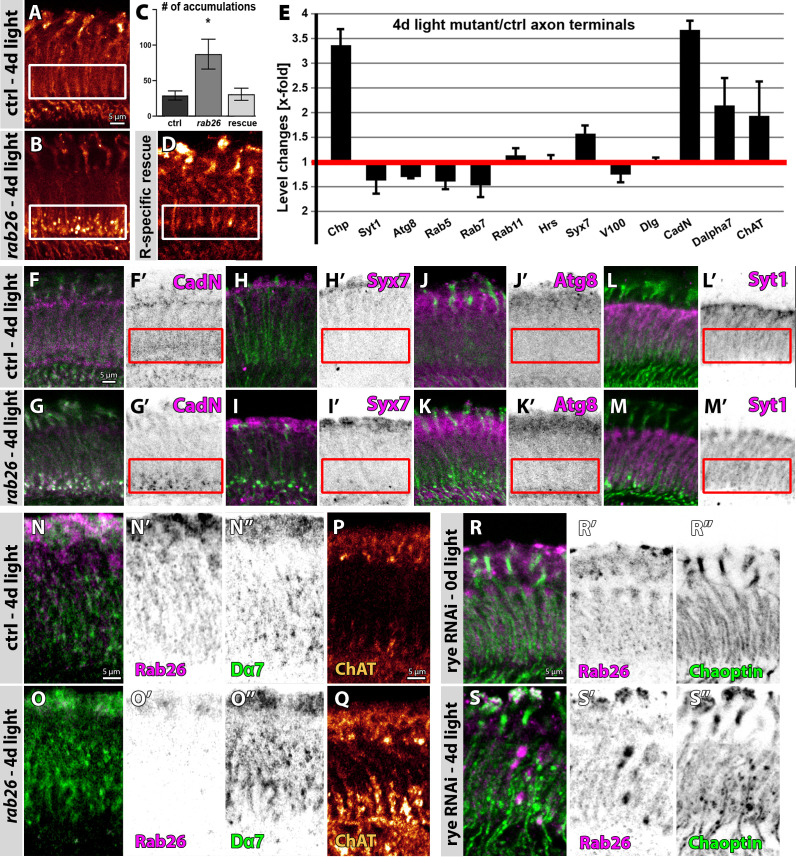
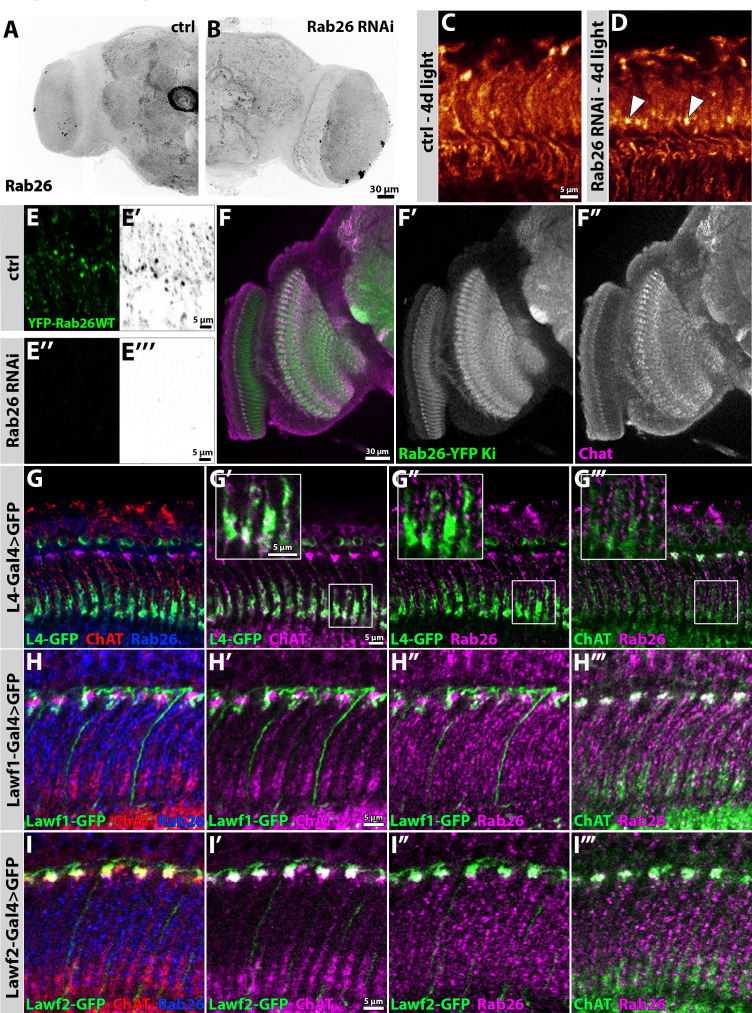
Rab GTPases are molecular switches that regulate membrane trafficking in all cells. Neurons have particular demands on membrane trafficking and express numerous Rab GTPases of unknown function. Here, we report the generation and characterization of molecularly defined null mutants for all 26 rab genes in Drosophila. In flies, all rab genes are expressed in the nervous system where at least half exhibit particularly high levels compared to other tissues. Surprisingly, loss of any of these 13 nervous system-enriched Rabs yielded viable and fertile flies without obvious morphological defects. However, all 13 mutants differentially affected development when challenged with different temperatures, or neuronal function when challenged with continuous stimulation. We identified a synaptic maintenance defect following continuous stimulation for six mutants, including an autophagy-independent role of rab26. The complete mutant collection generated in this study provides a basis for further comprehensive studies of Rab GTPases during development and function in vivo.

Keywords: D. melanogaster; Drosophila; Rab GTPase; cell biology; mutant collection; neuroscience.


Conflict of interest statement

FK, ID, BP, EJ, FK, SL, FP, HW, TM, GL, CC, MB No competing interests declared, PH Reviewing editor, eLife

Figures

Figure 1.
Figure 1.. Generation and viability analysis of the rab null mutant collection.
(A) List of all 26 Drosophila rab null mutants, sorted by expression pattern from 'nervous system-enriched' to ubiquitous based on Chan et al., 2011; Jin et al., 2012. Two-thirds of the rab mutants are homozygous viable and fertile. Eight rab mutants are lethal in homozygosity. The origin of the mutants is indicated in the third column. (B) Pie charts showing the ratios of homozygous versus balanced flies after ten generations. Ten of the 18 viable or semi-lethal rab mutants are fully homozygous, while the others still retain their balancer chromosome (shades of yellow) to varying degrees. At least 1000 flies per rab mutant were counted.
Figure 1—figure supplement 1.
Figure 1—figure supplement 1.. Design of newly generated rab mutants.
(A and C) Schematic depiction of the inserted knock-in cassettes. For ends-out homologous recombination a Gal4-3xP3-RFP-Kanamycin cassette, with loxP-sites flanking the 3xP3-RFP-Kan region, was inserted. For CRISPR/Cas9-mediated mutagenesis a 3xP3-RFP- or 3xP3-dsRed (for rab26) cassette, flanked by loxP-sites, was inserted. (B and D) Schematics of genomic loci as depicted on FlyBase GBrowse (https://flybase.org/cgi-bin/gbrowse2/dmel/). The exon/intron region, with exon as wide orange bars, introns as black lines and 5’ UTRs and 3’UTRS as grey wide bars. The red half-arrows highlight regions replaced for ‘ORF knock-ins’ (B) or ‘CRISPR knock-ins’ (D); blue half-arrows highlight regions replaced for ‘ATG knock-ins’ (rab4 in B).
Figure 1—figure supplement 2.
Figure 1—figure supplement 2.. Pupal expression patterns of nervous system-enriched Rabs based on endogenously tagged Rabs generated by Dunst et al., 2015.
(A) Schematic of the main optic neuropils and retina of the developing pupal brain. (B) Expression pattern of EYFP-tagged Rabs (green) in ~P+40% pupal brains. Immunolabeling of pupal photoreceptor projections with Chaoptin (red). Inverted channel shows expression of EYFP-tag. Scale bar = 20 µm; number of brains n = 3–6. Abbreviations: R = retina, LA = lamina, ME = medulla, LO = lobula and LOP = lobula plate. See Supplementary file 1 listing regions with EYFP-Rab expression.
Figure 1—figure supplement 3.
Figure 1—figure supplement 3.. Adult expression patterns of nervous system-enriched Rabs based on endogenously tagged Rabs generated by Dunst et al., 2015.
Dunst et al., 2015. (A) Illustrations of the main anterior, inner and posterior neuropil regions of the adult brain exhibit strong Rab expression (shown in B). (B) Expression pattern of EYFP-tagged Rabs (green) in newly hatched adult brains. Inverted channels show expression of EYFP-tag. Scale bar = 30 µm; number of brains n = 3–6. AVLP = anterior ventrolateral protocerebrum, MB = mushroom body, LA = lamina, ME = medulla, LOP = lobula plate, LO = lobula, P = pedunculus, SLP = superior medial protocerebrum, FB = fan-shaped body, EB = ellipsoid body, PLP = posterior lateral protocerebrum, CA = calyx and PB = protocerebral bridge. See Supplementary file 1 listing regions with EYFP-Rab expression.
Figure 2.
Figure 2.. Developmental analyses of all viable rab mutants at different temperatures.
(A–C) Developmental time from embryogenesis to adults at 18°C (A), 25°C (B), and 29°C (C) for all homozygous viable rab mutants. (D, G, and J) Developmental time at 18°C for all homozygous viable rab mutants, separated into embryonal (blue, D), larval (green, G) and pupal (orange, J) phases. (E, H, and K) Developmental time at 25°C for all homozygous viable rab mutants, separated into embryonal (blue, E), larval (green, H) and pupal (orange, K) phases. (F, I, and L) Developmental time at 29°C for all homozygous viable rab mutants, separated into embryonal (blue, F), larval (green, I) and pupal (orange, L) phases. (A–L) Dashed red line = mean of control. Mean ± SEM; *p<0.05 (for the specific statistical values see Figure 2—figure supplement 1); 0, 1, or 2 indicate if the specific phenotype could not be validated (0), could be validated by either backcrossing or mutant over deficiency (1) or could be validated by both (2); Unpaired non-parametric Kolmogorov-Smirnov test. (M–N) Wing surface area measurement for validated homozygous viable rab mutants at 18°C (M) and 29°C (N). Wild type (brown) and rab mutant with significantly reduced (red) and increased wing sizes (yellow) compared to control. Boxplot with horizontal line representing the median; individual data points are represented as dots. Fifteen to 22 wings per genotype were quantified; *p<0.05 (for the specific statistical values see Figure 2—figure supplement 2); 0, 1, or 2 indicate if the specific phenotype could not be validated (0), could be validated by either backcrossing or mutant over deficiency (1) or could be validated by both (2); ordinary one-way ANOVA with pair-wise comparison.
Figure 2—figure supplement 1.
Figure 2—figure supplement 1.. Validation of developmental timing phenotypes of viable rab mutants at different temperatures.
(A–C) Total developmental time of control and viable rab mutants at 18°C (A), 25°C (B) and 29°C (C). 0, 1, or 2 indicate if the specific phenotype could not be validated (0), could be validated by either backcrossing or mutant over deficiency (1) or could be validated by both (2). (D–I) Validation of developmental timing phenotypes with either backcrossed mutants (bc, chequered pattern) or/and rab mutant over deficiency (Df, shaded pattern). Shown are total development and the specific developmental stages at 18°C (D and G), 25°C (E and H), and 29°C (F and I). (A–I) Dashed red line = mean of control. Developmental stages: embryo (blue), larva (green) and pupa (orange). Mean ± SEM; *p<0.05, **p<0.01, ***p<0.001, ****p<0.0001; Unpaired non-parametric Kolmogorov-Smirnov test.
Figure 2—figure supplement 2.
Figure 2—figure supplement 2.. Wing surface area measurement for all homozygous viable rab mutants at 18°C and 29°C.
(A–B) Wing surface area measurement for all homozygous viable rab mutants at 18°C (A) and 29°C (B). Wild type (brown) and rab mutant (gray) wing size. Significantly reduced (red) and increased wing sizes (yellow) compared to control are highlighted. 0, 1, or 2 indicate if the specific phenotype could not be validated (0), could be validated by either backcrossing or mutant over deficiency (1) or could be validated by both (2). (C–D) Wing surface area measurements of either backcrossed mutants (bc) or/and rab mutant over deficiency (Df) showing significant altered wing size at 18°C (C) and 29°C (D). rab mutants with significantly reduced wing size are highlighted in red and with an increased wing size in yellow. (A–D) Boxplot with horizontal line representing the median; individual data points are represented as dots. Ten to 22 wings per genotype were quantified; *p<0.05, **p<0.01, ***p<0.001, ****p<0.0001; ordinary one-way ANOVA with pair-wise comparison.
Figure 2—figure supplement 3.
Figure 2—figure supplement 3.. Examples of wing defects after development at different temperatures.
(A–J) Wing sizes of rab mutants at 18°C and 29°C. Flies at 29°C have on average 30% smaller wings than flies at 18°C (A–B). At 18°C, rabX1 has significantly larger wings than control, while rab19 has significantly smaller wings than control (C, E). At 29°C, rab9 has larger wings than control, while rabX6 has smaller wings than control (D, F). rab23 shows, in addition to the PCP phenotype that is consistent at both temperatures, a p-cv vein shortening that is present in 90% of cases at 18°C (G, I), but is reduced to 12% at 29°C (H, J). Scale bar = 500 µm (A–H), 100 µm (I–J).
Figure 3.
Figure 3.. Analysis of neuronal function and maintenance based on electroretinograms.
(A–B) Sensitization curves for light stimulated (orange curve) and dark-reared (black curve) wild type flies generated by electroretinogram (ERG) recordings. ‘on’ transient signal is lost after 4 days of light stimulation. Complete loss of depolarization signal after 5 days of light stimulation. 0 day, 2 days light stimulation and 4 days dark-rearing are highlighted in red. Mean ± SEM; 25–30 flies were recorded for each day (0–7 days) and each condition (light and dark); Ordinary one-way ANOVA with pair-wise comparison. (C–D) ‘on’ transient and depolarization of newly hatched (0 day) flies. Wild type control in black, all homozygous viable rab mutants in grey. (E–F) ‘on’ transient and depolarization of wild type (black) and homozygous viable rab mutants (grey) after 2 days of light stimulation. (G–H) ‘on’ transient and depolarization of wild type (black) and homozygous viable rab mutants (grey) after 4 days of dark-rearing. (C–H) Mean ± SD; *p<0.05; 25–30 flies were recorded for each genotype and condition; ordinary one-way ANOVA with group-wise comparison.
Figure 4.
Figure 4.. Viable rab mutants show no apoptosis based on DCP-1 immunolabeling but display morphological changes in rhabdomeres after continuous light stimulation.
(A–B) Examples of rab mutant retinas which show rhabdomere changes and no increased levels in the apoptotic marker DCP-1 after 2 days of light stimulation compared to control (B) and newly hatched flies (A). Zoom-ins of single ommatidia are highlighted by red boxes. Scale bar = 4 µm; number of retinas n = 5–7 from different animals per antibody staining. (C) rdgC306 mutant ommatidia show high levels of DCP-1 (red) after continuous blue light stimulation. Labeling with phalloidin (green) reveals highly disrupted rhabdomere morphology. Scale bar = 4 µm; number of retinas n = 4 per antibody staining. (D) Area ratio of outer rhabdomeres R1-R6. The standard deviation range of wild type control is highlighted by red lines. Outer rhabdomere area ratio was calculated as described in Materials and methods. Mean ± SD; *p<0.05 (only significances outside SD range are marked); number of outer rhabdomeres counted n = 150 from three to six animals. Ordinary one-way ANOVA with group-wise comparison. (E–F) After 2 days of light stimulation outer rhabdomere shape exhibited increased variability (F) compared to newly eclosed flies (E). Outer rhabdomere shape was calculated as described in Materials and methods and examples of single ommatidia (left: 0 day, right: 2 days of light stimulation) are shown in the zoom-ins (E). Mean + SD; *p<0.05; number of outer rhabdomeres counted n = 150 from three to six animals. Ordinary one-way ANOVA with group-wise comparison.
Figure 4—figure supplement 1.
Figure 4—figure supplement 1.. No viable rab mutants show apoptosis based on DCP-1 immunolabeling, some display morphological changes in rhabdomeres after 2 days of continuous light stimulation.
Labeling of newly hatched wild type and rab mutant retinas with Phalloidin and DCP-1 reveals normal rhabdomere development and no indication of apoptosis. No apoptotic cell death can be observed after 2 days of light stimulation. A number of rab mutants reveal morphological changes of the rhabdomeres (for rhabdomere area and shape quantification see Figure 4). Shown are representative examples of ommatidia. Scale bar = 4 µm; number of retinas n = 5–7 from different animals per antibody staining.
Figure 5.
Figure 5.. Analyses of morphology, recycling endosomal function (Rab11) and autophagy (Atg8) at photoreceptor axon terminals after continuous light stimulation.
(A) Examples of Chaoptin-labeling (Chp) of 0 day and 2 days light stimulated wild type and rab mutant photoreceptor projections (overview top panel, R1-R6 middle panel, R7-R8 bottom panel). The rabX1 mutant exhibits Chaoptin accumulations in non-photoreceptor cell bodies independent of stimulation (arrowheads). After 2 days of light stimulation, rab26 and rab19 mutants display membrane accumulations in their axon terminals (arrows). Scale bar = 20 µm (top panel), 5 µm (middle and bottom panel); number of brains n = 3–5 per antibody staining. (B) Examples of Atg8 labeling of photoreceptor projections in retina-lamina preparations of newly hatched and 2 days light stimulated wild type flies and six rab mutants. Only rab23, rab27, and rab32 show significant increases in Atg8-positive compartments after 2 days of light stimulation (highlighted by red boxes). rabX1 flies exhibit Atg8-positive compartments in cell bodies (arrowheads). Scale bar = 10 µm; number of retina-lamina preparations n = 3 for each condition and staining. (C) Examples of Rab11 labeling of photoreceptor projections in retina-lamina preparations of newly hatched and 2 days light stimulated wild type and rabX1 flies. Increase in Rab11 levels is suppressed in rabX1 mutants after 2 days of light stimulation (highlighted by red box). Scale bar = 10 µm; number of retina-lamina preparations n = 3 for each condition and staining.
Figure 5—figure supplement 1.
Figure 5—figure supplement 1.. Systematic analysis of photoreceptor axon morphology of newly eclosed adults and after 2 days of continuous light stimulation.
(A) Labeling of newly hatched wild type and mutant photoreceptor projections with Chaoptin (Chp) reveals no noticeable morphological differences. Chaoptin-positive accumulations in non-photoreceptor cells are visible in rabX1. Optic lobe overview (top panel), lamina cross-section with R1-R6 axon terminals (middle panel), and R7-R8 axon terminals (bottom panel). Scale bar top panel = 20 µm, middle and bottom panel = 5 µm; number of brains n = 3–5 per antibody staining. (B) Labeling of wild type and mutant photoreceptor projections with Chaoptin (Chp) after 2 days of light stimulation. Chaoptin-positive accumulations in non-photoreceptor cells are visible in rabX1. Only rab19 and rab26 display morphological differences in their photoreceptor projection terminals, showing membrane accumulations in the tips of R1-R6 axon terminals. Optic lobe overview (top panel), lamina cross-section with R1-R6 axon terminals (middle panel), and R7-R8 axon terminals (bottom panel). Scale bar top panel = 20 µm, middle and bottom panel = 5 µm; number of brains n = 3–5 per antibody staining.
Figure 6.
Figure 6.. Loss of rab26 does not discernibly affect markers for synaptic vesicles or autophagy in the adult brain.
(A) Representative ERG traces of recordings of 2 days light stimulated wild type, rab26 mutant, and Rab26 GTP-locked overexpression flies. Only the Rab26 GTP-locked flies show a complete loss of ‘on’ transient (highlighted in red). Quantification of the ‘on’ transient is shown right. (B–G) Labeling of lamina cross-sections of Rab26 GTP-locked (B, D, and F) and YFP-tagged Rab26WT (C, E, and G) against Syt1 and CSP (B and C), Rab11 and ATG8 (D and E), and Hrs and Syx7/Avalanche (F and G). GTP-locked Rab26 shows colocalization with Rab11 and Syx7/Avalanche (white arrowheads), but not with Syt1, CSP, Atg8 nor Hrs (black arrowheads). Scale bar = 5 µm; number of brains n = 3–5 per antibody staining. (H–K) Intensity comparison of optic lobes of newly hatched wild type and rab26 mutant flies, stained against Syt1 (H and I) and Atg8 (J and K). Number of brains n = 3–5 per antibody staining. (L) Validation of the rab26 null mutant by Western Blot with the newly generated Rab26 antibody. Wild type control shows the Rab26 band at around 45 kDa (1), which is lost in the rab26 mutant (2). (M and N) Validation of the rab26 null mutant by immunohistochemistry with the newly generated Rab26 antibody. The Rab26 antibody labels synaptic neuropil in different regions of wild type brains (green, M), which is lost in the rab26 null mutant (N). Labeling of nuclei/ cell bodies with Toto-3 (blue). Scale bar = 30 µm; number of brains n = 3 per antibody staining. (O) Immunolabeling of Rab26 (red) shows high colocalization with the endogenously YFP-tagged Rab26 (green). Lamina cross-section of newly hatched flies. Scale bar = 5 µm; number of brains n = 3–5 per antibody staining. (P) Co-labeling of wild type lamina with Rab26 (green), Brp (synaptic marker, red), and ebony (glia marker, blue) reveals few synapses, positive for Rab26 and Brp in the proximal region of the lamina (white arrowheads, P’ and P’’). No colocalization between Rab26 and ebony could be observed (P’’’). Scale bar = 5 µm; number of brains n = 3–5 per antibody staining.
Figure 6—figure supplement 1.
Figure 6—figure supplement 1.. Rab26 colocalizes with synaptic vesicle and endosomal markers at larval neuromuscular junction (NMJ) boutons.
(A) Immunolabeling of Rab26 (magenta) reveals its presence in NMJ boutons labeled by the active zone marker nc82 (green). The loss of Rab26 seems to have no effect on the overall NMJ morphology. Scale bar = 5 µm; number of NMJs n = 5–12 from three to six larvae per antibody staining. (B–F) Colocalization of Rab26 (green) with several markers (red) in larval NMJs which are labeled by nc82, HRP, or CSP (blue). (B) Endogenous Rab26 partially colocalizes with synaptic vesicle markers (CSP, Syt1), with endosomal (Syx7) and recycling endosomal (Rab11) markers, but not the postsynaptic marker DPAK. (C) GDP-locked Rab26 is more diffusely localized and partially colocalizes with CSP. (D) The autophagosomal marker Atg8 is not enriched in larval NMJs and does not colocalize with endogenous or overexpressed Rab26. Rab26 overexpression or the rab26 mutant do not affect Atg8 immunolabeling. (E–F) Overexpressed WT and GTP-locked forms of Rab26 colocalize with Syt1, CSP, Syx7, and Rab11, but not with the postsynaptic marker DPAK. Scale bar = 2 µm; number of NMJs n = 5–12 from three to six larvae per antibody staining.
Figure 7.
Figure 7.. Rab26 is required for membrane receptor turnover associated with cholinergic synapses.
(A–D) rab26 mutant R1-R6 photoreceptor terminals (B) exhibit Chaoptin-positive accumulations in the proximal lamina after 4 days of light stimulation (highlighted with white boxes), which are rescued by photoreceptor-specific Rab26 expression (C and D). (C) Quantification. Mean ± SEM; *p<0.05; number of lamina per genotype n = 8; ordinary one-way ANOVA with pair-wise comparison. Scale bar = 5 µm; number of brains n = 5. (E) Quantification of level changes of 13 membrane-associated proteins in the rab26 mutant axon terminals after 4 days of light stimulation. (F–M) Examples of lamina cross-sections of wild type (F, H, J and L) and rab26 mutant (G, I, K and M) after 4 days of light stimulation, showing proteins that are upregulated in R1-R6 terminals (CadN, (F–G); Syx7 (H–I)) and proteins that are unaffected (Atg8, (J–K); Syt1, (L–M)). The proximal lamina region is highlighted by red boxes. Scale bar = 5 µm; number of brains n = 3–5 per antibody staining. (N–O) The rab26 mutant exhibits an increase of Dα7 (green) across the lamina compared to wild type after 4 days of light stimulation. Shown are lamina cross-sections. Scale bar = 5 µm; number of brains n = 3–5 per antibody staining. (P–Q) The rab26 mutant shows an increase of ChAT in the proximal lamina compared to wild type after 4 days of light stimulation. Scale bar = 5 µm; number of brains n = 3–5 per antibody staining. (R–S) Photoreceptor-specific knock down of rye leads to an increase of Chaoptin and Rab26 in the lamina after 4 days of light stimulation (S) compared to newly hatched flies (R). Rab26 accumulates throughout the lamina (S’), whereas Chaoptin accumulates in the proximal lamina (S’’). Scale bar = 5 µm; number of brains n = 3–5 per antibody staining.
Figure 7—figure supplement 1.
Figure 7—figure supplement 1.. Rab26 RNAi recapitulates the null mutant lamina phenotype.
Endogenous Rab26 protein localizes to Lawf2-neurons in the lamina and strongly colocalizes with choline acetyl transferase throughout the adult brain. (A–B) Rab26 RNAi leads to reduced anti-Rab26 immunolabeling when driven by elav-Gal4 (B). Scale bar = 30 µm; number of brains n = 3–5. (C–D) Photoreceptor-specific expression of Rab26 RNAi leads to Chaoptin-accumulations in the proximal lamina after days of light stimulation (D, white arrowheads) compared to control (C, driver only) mimicking the rab26 mutant phenotype. Scale bar = 5 µm; number of brains n = 4–5 per antibody staining. (E) In flies, expressing both the YFP-tagged wild type form of Rab26 (green (E, E’’), gray (E’, E’’’)) and Rab26 RNAi driven by GMR-Gal4 (E’’–E’’’), the YFP signal is strongly decreased compared to the control (GMR-Gal4 driving only expression of Rab26 WT, E–E’). Scale bar = 5 µm; number of brains n = 3–5. (F) Across the optic lobe, the expression pattern of Rab26 (green) is similar to ChAT immunolabeling (magenta). Ki = knock in; Scale bar = 30 µm; number of brains n = 3–5 per antibody staining. (G) Co-labeling of L4 monopolar cells (green) with Rab26 (blue) and ChAT (red) in newly hatched flies. Proximal L4 terminals (green) in the lamina colocalize with ChAT (magenta) (G’), while Rab26 (magenta) labeling is complementary to the L4 terminals (green) (G’’). Bulbous processes in the distal lamina are positive for Rab26 (magenta) and ChAT (green) (G’’’). Zoom-ins of the L4 terminal region, are indicated by the white boxes. Scale bar = 5 µm; number of brains n = 3–5 per antibody staining. (H) Co-labeling of lamina wide-field feedback neurons type 1 (Lawf1, green) with Rab26 (blue) and ChAT (red) in newly hatched flies. Lawf1-processes in the distal lamina only partially colocalize with ChAT (H’) and Rab26 (H’’). Rab26 and ChAT strongly colocalize in bulbous-like structures in the distal lamina (H’’’). Scale bar = 5 µm; number of brains n = 3–5 per antibody staining. (I) Co-labeling of lamina wide-field feedback neurons type 2 (Lawf2, green) with Rab26 (blue) and ChAT (red) in newly hatched flies. Lawf2-processes in the distal lamina strongly colocalize with ChAT (I’) and Rab26 (I’’). Rab26 and ChAT strongly colocalize in bulbous-like structures in the distal lamina (I’’’). Scale bar = 5 µm; number of brains n = 3–5 per antibody staining.

Similar articles

Cited by

References

    1. Azevedo RB, French V, Partridge L. Temperature modulates epidermal cell size in Drosophila melanogaster. Journal of Insect Physiology. 2002;48:231–237. doi: 10.1016/S0022-1910(01)00168-8. - DOI - PubMed
    1. Bellen HJ, Levis RW, Liao G, He Y, Carlson JW, Tsang G, Evans-Holm M, Hiesinger PR, Schulze KL, Rubin GM, Hoskins RA, Spradling AC. The BDGP gene disruption project: single transposon insertions associated with 40% of Drosophila genes. Genetics. 2004;167:761–781. doi: 10.1534/genetics.104.026427. - DOI - PMC - PubMed
    1. Best BT, Leptin M. Multiple requirements for rab GTPases in the development of Drosophila Tracheal Dorsal Branches and Terminal Cells. G3: Genes, Genomes, Genetics. 2020;10:1099–1112. doi: 10.1534/g3.119.400967. - DOI - PMC - PubMed
    1. Binotti B, Pavlos NJ, Riedel D, Wenzel D, Vorbrüggen G, Schalk AM, Kühnel K, Boyken J, Erck C, Martens H, Chua JJ, Jahn R. The GTPase Rab26 links synaptic vesicles to the autophagy pathway. eLife. 2015;4:e05597. doi: 10.7554/eLife.05597. - DOI - PMC - PubMed
    1. Chan CC, Scoggin S, Wang D, Cherry S, Dembo T, Greenberg B, Jin EJ, Kuey C, Lopez A, Mehta SQ, Perkins TJ, Brankatschk M, Rothenfluh A, Buszczak M, Hiesinger PR. Systematic discovery of rab GTPases with synaptic functions in Drosophila. Current Biology. 2011;21:1704–1715. doi: 10.1016/j.cub.2011.08.058. - DOI - PMC - PubMed

Publication types

MeSH terms

LinkOut - more resources