. 2021 May-Jun;10(3):168-184.
doi: 10.4103/eus.eus_80_20.

General principles of image optimization in EUS

Affiliations

General principles of image optimization in EUS

Malay Sharma et al. Endosc Ultrasound. 2021 May-Jun.

Abstract

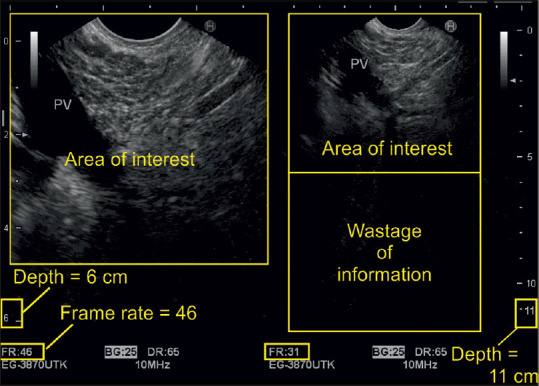
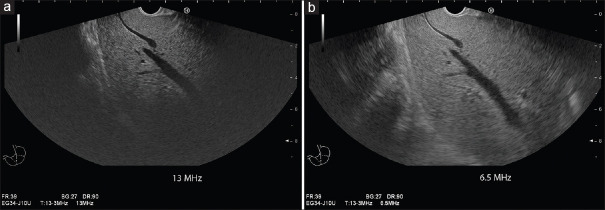
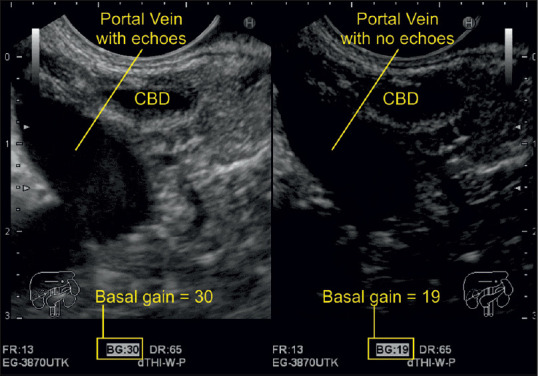
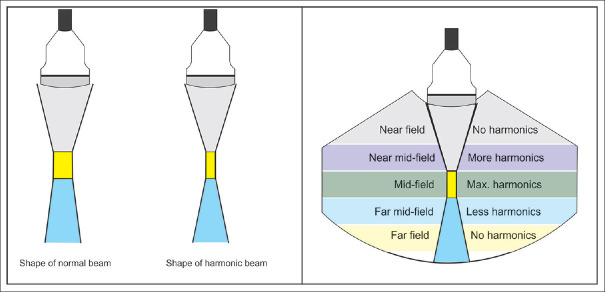
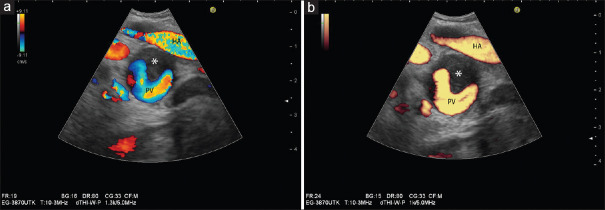
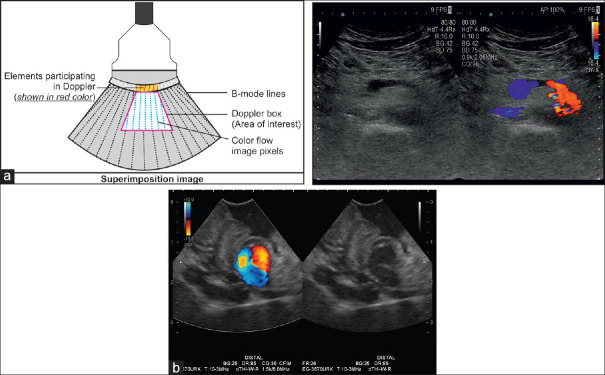
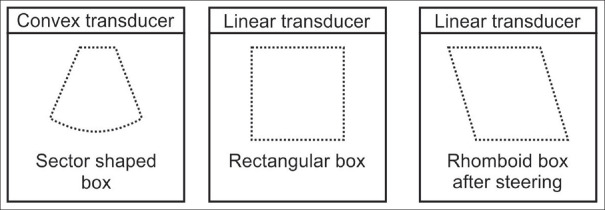
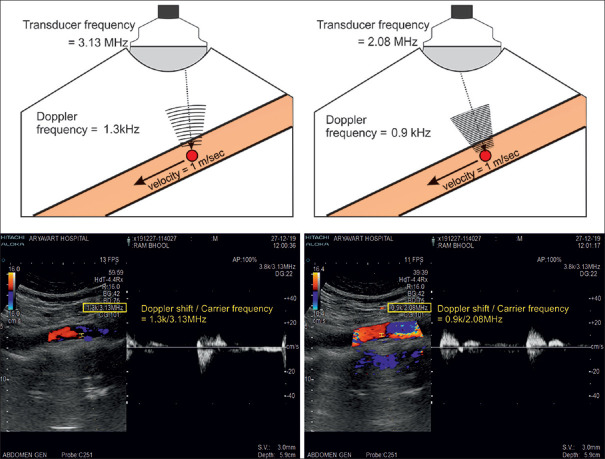
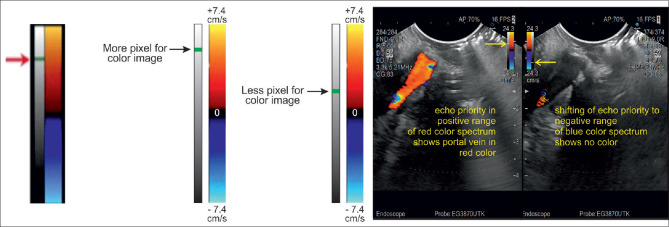
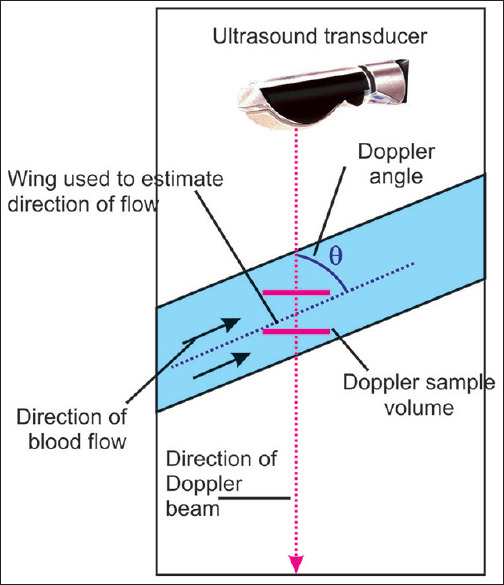
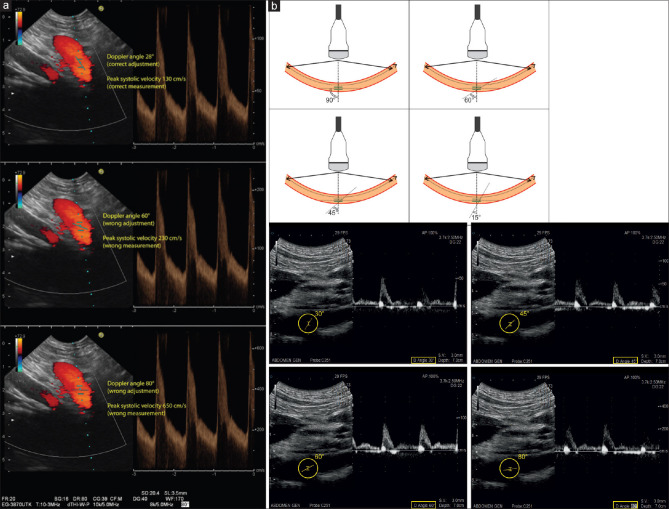
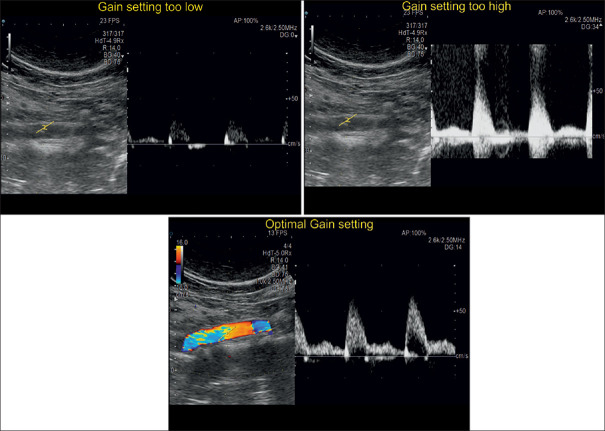
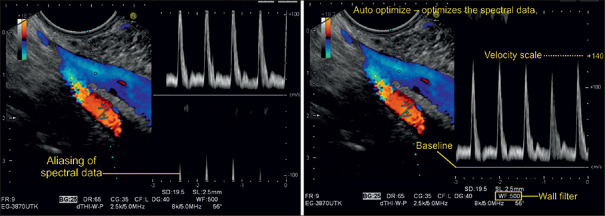
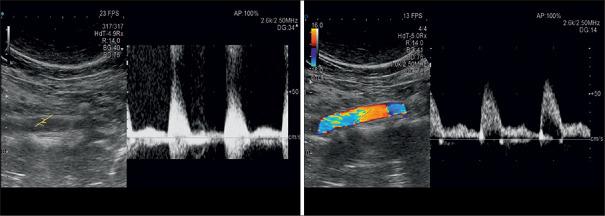
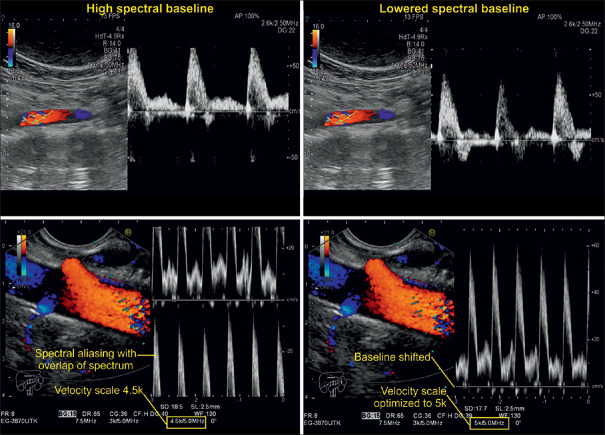
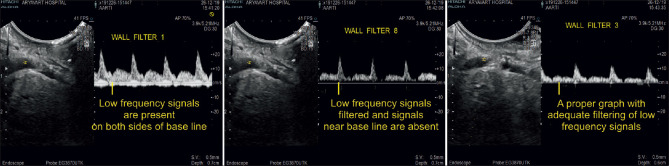
With the development of modern EUS, multiple imaging functions, transducer settings, and examination modes have become available for clinical settings. While the major determinants of the ultrasound beam are still comprised of the signal wavelength, its frequency range, and its amplitude, other modifications and calculations have gained more interest for advanced users, such as tissue harmonic imaging (THI), spatial and frequency compounding, certain versions of speckle reduction, and various Doppler/duplex settings. The goal of such techniques is a better, perhaps more realistic image, with reduced artifacts (such as speckle), better image contrast, and an improved signal-to-noise ratio. In addition, "add-ons" such as THI, which is based on the phenomenon of nonlinear distortion of acoustic signals as they travel through tissues, provide greater contrast and an enhanced spatial resolution than conventional EUS. Finally, optimization of spectral and color Doppler imaging in EUS requires experience and knowledge about the basic principles of Doppler/duplex phenomena. For these purposes, factors such as adjustment of Doppler controls, Doppler angle, color gain, spectral wall filters, and others require special attention during EUS examinations. Incorporating these advanced techniques in EUS examinations may be time-consuming and cumbersome. Hence, practical guidelines enabling endosonographers to steer safely through the large quantity of technological properties and settings (knobology) are appreciated. This review provides an overview of the role of important imaging features to be adjusted before, during, and after EUS procedures.

Keywords: B-mode; EUS; doppler; guideline; image quality.


Conflict of interest statement

None

Figures

Figure 1
Figure 1
The image shows on the right side that setting the depth to 11 cm exceeds the area of interest by a wide margin. This leads to a lot of unnecessary information whose processing reduces the frame rate and temporal resolution. On the left side, adjustment of region of interest allows for much better resolution of the desired image
Figure 2
Figure 2
Portal vein thrombus (*): Use of the zoom function improves frame rate and temporal resolution
Figure 3
Figure 3
Influence of transducer frequency on penetration depth: Using the highest frequency of 13 MHz, despite deep focus position, there is marked attenuation within the liver, and liver accessibility is limited to 4–5 cm depth. There is a high spatial resolution within the near field (a). Changing the frequency to 6.5 MHz improves liver accessibility markedly up to a depth of 7–8 cm at the cost of lower spatial resolution (b)
Figure 4
Figure 4
A decrease of gain from 30 to 19 caused the echoes from inside the portal vein to disappear. The right-sided image is optimized for vessel examination, whereas the left-sided images are optimized for studying its surrounding parenchymal organs
Figure 5
Figure 5
Single-focus zones are on a line, whereas dual-focus zones constitute an area where the ultrasound waves are narrowest. It is the site of best resolution
Figure 6
Figure 6
The frame rate is doubled once the user switches from dual to single focus. However, in this case, there was no need to do so, as the frame rate was already above 20 frames per second
Figure 7
Figure 7
The figure shows that the same crystal can send beams in different directions (spatial compound imaging). The change in direction can be 5°–10°
Figure 8
Figure 8
Compound imaging improves the spatial resolution but reduces the frame rate by half in this case
Figure 9
Figure 9
The shape of a normal and harmonic ultrasound beam from a percutaneous probe (the same applies to the echoendoscope ultrasound transducer). Maximum harmonics are generated at the focus that translate into a superior resolution in the focal zone
Figure 10
Figure 10
Comparison between color Doppler velocity and color Doppler energy in a case of partial thrombosis (*) of the portal vein: Color Doppler velocity provides information on flow direction, flow velocities, and distribution of flow velocities within vessels (a). Note the higher velocity in the hepatic artery (hepatic artery showing alias phenomenon) compared to the portal vein, different directions of blood flow (red and yellow: onto the transducer; blue: away from the transducer). Color Doppler energy displays flow independent of direction (b)
Figure 11
Figure 11
The color box is superimposed on the B-mode sonogram. In the resulting merged image, few elements are responsible for color formation only (a). As shown in this example of a gastric varix, flow onto the transducer is coded red; flow away from the transducer is coded blue (b)
Figure 12
Figure 12
Different shapes of the color-sampling box depending on transducer type. Each transducer type has a distinct shape of the sampling box. It is square or rhomboid in linear transducers and sector shaped in curvilinear probes. Linear transducers are not available for flexible EUS
Figure 13
Figure 13
The user can manually scale the color box size by dragging the right lower corner of the box along the X- and Y-axis with the trackball or touchpad
Figure 14
Figure 14
In color Doppler imaging, the examiner should first move the probe to improve the Doppler angle (<60°). Afterward, fine adjustments are practicable by using the respective control/knob. This is true for conventional transcutaneous and EUS
Figure 15
Figure 15
The saying goes: “A sleeping vessel is the sonographer's enemy and a standing vessel his/her friend.” The vascular structure in this figure, dubbed a “sleeping vessel,” lies at a 90° angle in the field of vision in parallel to the crystal arrays of the linear probe. Initially, the examiner should attempt to reduce the Doppler angle below 60° by re-positioning the probe. The more perpendicular the vascular structure is geared toward the probe (standing vessel), the better the Doppler signal becomes. If this maneuver fails to improve the orientation, technical shifting of the angle of insonation, image steering) might help (a). The example shows measurement of flow velocity in the superior mesenteric artery. After optimal positioning of the probe, an insonation angle of 67° results. The measured peak systolic velocity of 171 cm/s is not correct (b). Using the “image steering” function, an insonation angle of 60° is possible with more reliable measurement of peak systolic velocity of 134 cm/s (c)
Figure 16
Figure 16
Doppler examination of the portal vein with different signal gain settings. In this case, a color gain of 18 shows no flow within the portal vein, whereas a color gain of 56 leads to a flurry of pixels outside of it, the so-called “color bleed” or “blooming”
Figure 17
Figure 17
The red color indicates movement toward the transducer, whereas blue illustrates movement away from the probe. The shades of color closer to the baseline are darker. The extremes of the bar mark the Nyquist limit
Figure 18
Figure 18
A Doppler examination of the portal vein with different pulse repetition frequency settings and their effect on the illustration of the blood flow. At high peak velocity of 59.7 cm/s and PRF of 8000 kHz, no flow can be detected (a). After reducing the peak velocity to 21.9 cm/s, blood flow is only detectable near the wall because of high-amplitude and low-frequency movements along the vascular walls. The lumen appears void because the high-frequency shift there corresponds to a velocity beyond the illustrated spectrum (b). Further reduction of the peak velocity leads to full-scale coloring of the entire venous lumen with increasing intensity near the center where lighter signals indicate a higher frequency shift and hence higher velocity (c). Even further reduction of the peak velocity to 7.46 cm/s makes color signals to appear outside the portal vein. A white color change becomes evident, the so-called “aliasing” (d)
Figure 19
Figure 19
The ultrasound image is included to show how an inversion of color bar can change the color within the vessel. This inversion of color is given as a function in all ultrasound machines and generally the inversion has no practical significance (a). Inversion of Doppler colors in a frozen image of a small gastric varix: on the left part of the image, red is on top of the color bar (arrowhead), and inflow in the varix (directed onto the transducer) is coded red (arrowhead). On the right part of the image, the color box was inverted, with red now displayed at the bottom (arrowhead). Therefore, now, outflow from the varix (away from the transducer) is coded red (arrowhead) (b)
Figure 20
Figure 20
In low-flow scenarios like the examination of a portal vein in this picture, the wall filter should not be set too high as it may inadvertently lead to cutting out relevant blood flow signals
Figure 21
Figure 21
The figure illustrates that Doppler frequency shift and transmission frequency are directly proportional
Figure 22
Figure 22
The gray-scale bar sits left of the color scale. The arrow marks the threshold, which indicates whether more or less pixels are used for the color image
Figure 23
Figure 23
After activating the spectral Doppler function, the insonation axis and Doppler sample volume (gate) are visualized on the screen
Figure 24
Figure 24
The Doppler angle can be changed by moving the spectral Doppler switch control. With correct adjustment of the Doppler angle to 28° in line with the course of the vessel (celiac trunk), peak systolic velocity is measured properly with 130 cm/s (a). Wrong adjustment of Doppler angles to 60° (b) or to 80° (c) results in wrong measurements of peak systolic velocity (230 and 650 cm/s, respectively)
Figure 25
Figure 25
Different signals gain settings during a spectral Doppler examination. The optimal adjustment leads to a clearly visualized blood flow pattern
Figure 26
Figure 26
Spectral Doppler examination of the mesenteric vein, which is depicted mainly in blue color. The “negative” velocity spectrum (blood moving away from the probe) correlates with the hepatopetal flow pattern that is a normal finding for the mesenteric vein. The superior mesenteric artery shows a color change from light orange to light blue, which indicates aliasing. The upper limit of the velocity scale is 18.2 cm/s. Higher velocity measurements are inaccurate and appear negative (aliasing effect), as the PRF is too low in comparison to the measured Doppler shift. To avoid aliasing, the PRF requires adjustment. In newer ultrasound systems, the auto optimization function spontaneously adjusts the baseline for spectral Doppler to picture the graph without an offset
Figure 27
Figure 27
The left image shows excessive gain with the resulting background noise by additional frequencies. In the right illustration, the gain setting is better which leads to a sharper spectral Doppler graph. The color code shows an aliasing effect, which is most likely explained by a directional change of the vessel
Figure 28
Figure 28
Triplex imaging examinations of abdominal vessels. The two illustrations on the left depict spectral Doppler graphs whose peaks appear cut off and folded over to the negative side of the spectrum (spectral aliasing). After lowering the baseline, the graphs on the right-sided images are visualized in their entirety without any offsets. Note that the velocity scale and color coding do not differ in the images taken before and after the baseline adjustment
Figure 29
Figure 29
Spectral Doppler imaging with wall filter settings of increasing sensitivity. Wall filter 1 (image on the left) does not filter out low-frequency signals generated by vascular wall movements, which are displayed prominently alongside the spectral Doppler graph. At the other end of the sensitivity spectrum, wall filter 8 (illustration in the middle) eliminates low-frequency information from both the vascular walls and the central blood flow signal, which translates into a faint, discontinuous spectral Doppler graph. Wall filter 3 (image on the right) is the setting of choice, which suppresses almost exclusively low frequencies from vascular wall movements

Similar articles

Cited by

References

    1. Dietrich CF, Bartsch L, Turco V, et al. Knöpfologie in der B-Bild-Sonografie. Gastroenterologie up 2date. 2018;14:347–64.
    1. Ishikawa H, Hirooka Y, Itoh A, et al. A comparison of image quality between tissue harmonic imaging and fundamental imaging with an electronic radial scanning echoendoscope in the diagnosis of pancreatic diseases. Gastrointest Endosc. 2003;57:931–6. - PubMed
    1. Ohno E, Kawashima H, Hashimoto S, et al. Current status of tissue harmonic imaging in endoscopic ultrasonography (EUS) and EUS-elastography in pancreatobiliary diseases. Dig Endosc. 2015;27(Suppl 1):68–73. - PubMed
    1. Matsumoto K, Katanuma A, Maguchi H, et al. Performance of novel tissue harmonic echo imaging using endoscopic ultrasound for pancreatic diseases. Endosc Int Open. 2016;4:E42–50. - PMC - PubMed
    1. Bang JY, Hawes RH, Varadarajulu S. Objective evaluation of a new endoscopic ultrasound processor. Dig Endosc. 2013;25:554–5. - PubMed