

Home range, sleeping site use, and band fissioning in hamadryas baboons: Improved estimates using GPS collars
- PMID: 33666273
- PMCID: PMC8244037
- DOI: 10.1002/ajp.23248
Home range, sleeping site use, and band fissioning in hamadryas baboons: Improved estimates using GPS collars
Abstract
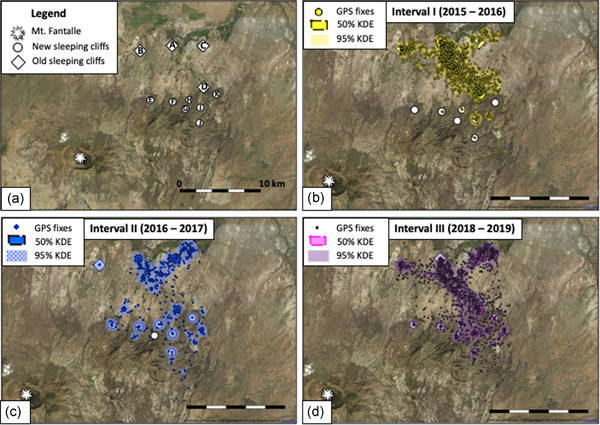
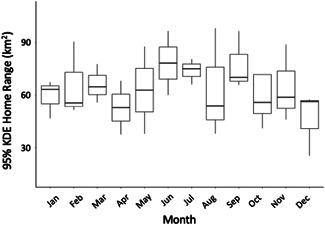
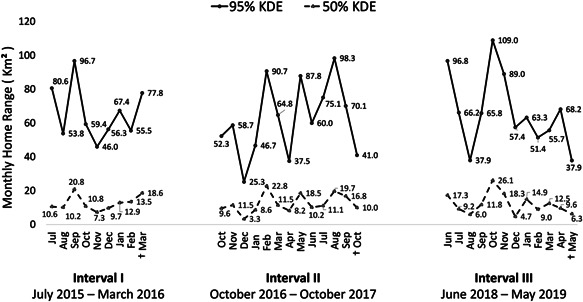
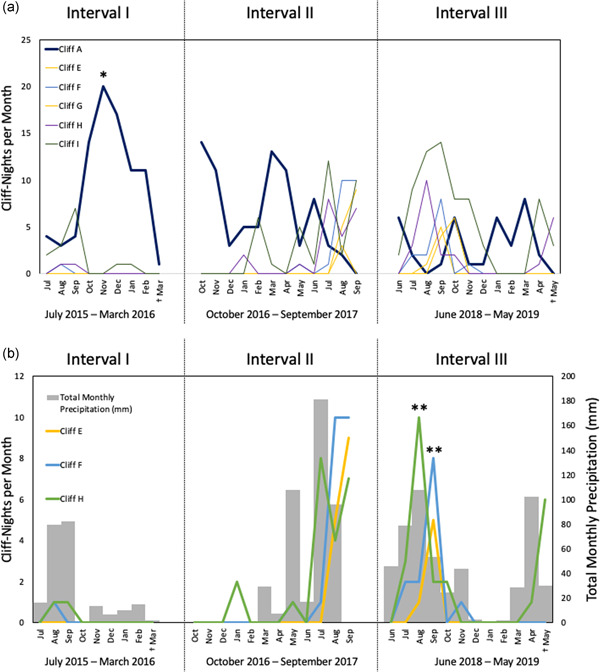
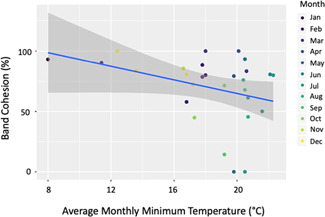
Variation in spatial and temporal distribution of resources drives animal movement patterns. Links between ecology and behavior are particularly salient for the multilevel society of hamadryas baboons, in which social units cleave and coalesce over time in response to ecological factors. Here, we used data from GPS collars to estimate home range size and assess temporal patterns of sleeping site use in a band of hamadryas baboons in Awash National Park, Ethiopia. We used GPS data derived from 2 to 3 collared baboons over three 8-12-month collaring intervals to estimate annual and monthly home ranges using kernel density estimators (KDEs) and minimum convex polygons (MCPs). The 95% KDE home range was 64.11 km2 for Collaring Interval I (July 2015-March 2016), 85.52 km2 for Collaring Interval II (October 2016-October 2017), 76.43 km2 for Collaring Interval III (July 2018-May 2019), and 75.25 km2 across all three collaring intervals. MCP home ranges were 103.46 km2 for Collaring Interval I, 97.90 km2 for Collaring Interval II, 105.22 km2 for Collaring Interval III, and 129.33 km2 overall. Ninety-five percent KDE home range sizes did not differ across months, nor correlate with temperature or precipitation, but monthly MCP home ranges increased with monthly precipitation. Our data also revealed a southward home range shift over time and seven previously unknown sleeping sites, three of which were used more often during the wet season. Band cohesion was highest during dry months and lowest during wet months, with fissioning occurring more frequently at higher temperatures. One pair of collared individuals from Collaring Interval III spent 95% of nights together, suggesting they were members of the same clan. Our results both suggest that previous studies have underestimated the home range size of hamadryas baboons and highlight the benefits of remote data collection.
Keywords: fission fusion; home range size; movement patterns; remote sensing; spatial ecology.
© 2021 The Authors. American Journal of Primatology published by Wiley Periodicals LLC.
Figures
References
-
- Abegglen, J. J. (1984). On socialization in hamadryas baboons: A field study. Lewisburg, PA: Bucknell University Press.
-
- Alberts, S. C. , & Altmann, J. (1995). Balancing costs and opportunities: Dispersal in male baboons. The American Naturalist, 145(2), 279–306. 10.1086/285740 - DOI
-
- Alberts, S. C. , & Altmann, J. (2006). The evolutionary past and the research future: Environmental variation and life history flexibility in a primate lineage. In Swedell L., & Leigh S. R. (Eds.), Reproduction and fitness in baboons: Behavioral, ecological, and life history perspectives (pp. 277–303). Springer.
-
- Altmann, S. A. (1974). Baboons, space, time, and energy. American Zoologist, 14(1), 221–248. 10.1093/icb/14.1.221 - DOI
Publication types
MeSH terms
LinkOut - more resources
Full Text Sources
Other Literature Sources
Miscellaneous
