. 2021 Mar 21;21(6):1036-1048.
doi: 10.1039/d0lc01133a. Epub 2021 Mar 5.

Microfluidic electrical impedance assessment of red blood cell-mediated microvascular occlusion

Affiliations

Microfluidic electrical impedance assessment of red blood cell-mediated microvascular occlusion

Yuncheng Man et al. Lab Chip. .

Abstract

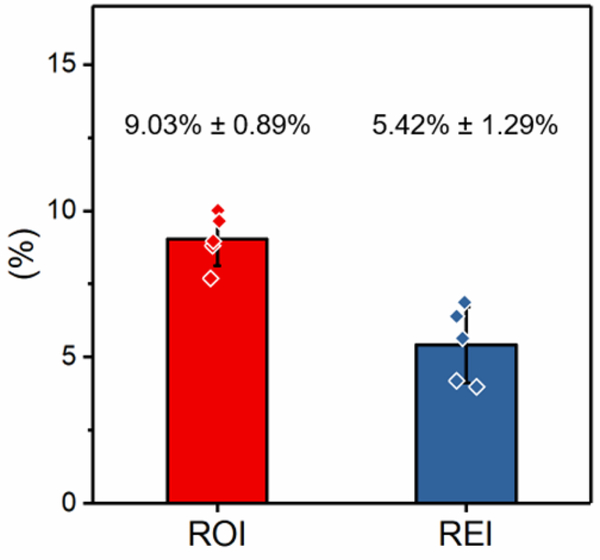
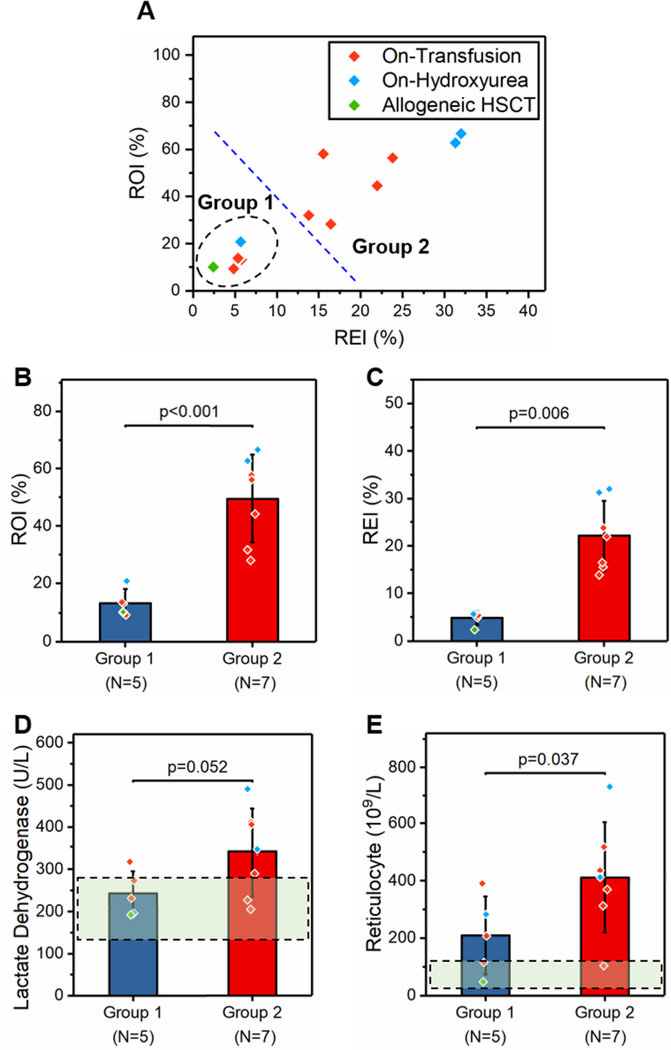
Alterations in the deformability of red blood cells (RBCs), occurring in hemolytic blood disorders such as sickle cell disease (SCD), contribute to vaso-occlusion and disease pathophysiology. There are few functional in vitro assays for standardized assessment of RBC-mediated microvascular occlusion. Here, we present the design, fabrication, and clinical testing of the Microfluidic Impedance Red Cell Assay (MIRCA) with embedded capillary network-based micropillar arrays and integrated electrical impedance measurement electrodes to address this need. The micropillar arrays consist of microcapillaries ranging from 12 μm to 3 μm, with each array paired with two sputtered gold electrodes to measure the impedance change of the array before and after sample perfusion through the microfluidic device. We define RBC occlusion index (ROI) and RBC electrical impedance index (REI), which represent the cumulative percentage occlusion and cumulative percentage impedance change, respectively. We demonstrate the promise of MIRCA in two common red cell disorders, SCD and hereditary spherocytosis. We show that the electrical impedance measurement reflects the microvascular occlusion, where REI significantly correlates with ROI that is obtained via high-resolution microscopy imaging of the microcapillary arrays. Further, we show that RBC-mediated microvascular occlusion, represented by ROI and REI, associates with clinical treatment outcomes and correlates with in vivo hemolytic biomarkers, lactate dehydrogenase (LDH) level and absolute reticulocyte count (ARC) in SCD. Impedance measurement obviates the need for high-resolution imaging, enabling future translation of this technology for widespread access, portable and point-of-care use. Our findings suggest that the presented microfluidic design and the integrated electrical impedance measurement provide a reproducible functional test for standardized assessment of RBC-mediated microvascular occlusion. MIRCA and the newly defined REI may serve as an in vitro therapeutic efficacy benchmark for assessing the clinical outcome of emerging RBC-modifying targeted and curative therapies.


Conflict of interest statement

CONFLICT OF INTEREST

A patent application has been filed by Case Western Reserve University for this technology.

Figures

Fig. 1.
Fig. 1.
Microfluidic electrical impedance assessment of RBC-mediated microvascular occlusion. (A) Electrical impedance across two electrodes placed on either side of the micropillar array is measured before and after sample perfusion. The resultant impedance change depends on microcapillary occlusion in the array. (B) The Microfluidic Impedance Red Cell Assay (MIRCA) consists of six micropillar arrays comprising microcapillaries ranging from 12 μm down to 3 μm, which mimic key dimensions of small blood vessels observed in the capillary bed. The 12 μm array is designed to trap potential large-cell aggregates that may cause microchannel clogging. Inset: schematic of the capillary-inspired micropillar array. The 40 μm-wide side pathway is designed to mimic arteriovenous anastomoses to help regulate flow and to prevent upstream blockage. Schematics are not drawn to scale, and all dimensions are in microns. (C) Photograph of MIRCA is shown. The arrow indicates flow direction. Inset: close-up views of the microcapillary occlusion within the 3 μm array induced by glutaraldehyde-stiffened RBCs or healthy RBCs. (D) Temporal variation in electrical impedance of the 3 μm array observed at 10 kHz is shown for a sample with 2% stiff RBCs and 98% healthy RBCs, a sample with 100% healthy RBCs, and PBS. Each sample was perfused for 20 min, which was followed by post-perfusion wash with PBS for another 20 min. The initial impedance reading was taken at the start point of each test (time = 0 min), and the second impedance reading was taken at the endpoint (time = 40 min).
Fig. 2.
Fig. 2.
MIRCA system characterization using glutaraldehyde-stiffened RBCs (stiff RBCs) and analysis of the microcapillary occlusion and impedance data. (A) Profiles of microcapillary occlusion in the 3 μm to 10 μm arrays shown as histograms for the tested RBC samples with 100% healthy RBCs, with 99% healthy RBCs and 1% stiff RBCs, or with 98% healthy RBCs and 2% stiff RBCs. (B) The ROI of samples with 98% healthy RBCs and 2% stiff RBCs was significantly higher compared to that of samples with 99% healthy RBCs and 1% stiff RBCs or 100% healthy RBCs, and the ROI of samples with 99% healthy RBCs and 1% stiff RBCs was significantly higher compared to that of 100% healthy RBCs (p < 0.05, paired t-test). (C) Profiles of impedance change in those arrays shown as histograms for the tested RBC samples. (D) The REI of samples with 98% healthy RBCs and 2% stiff RBCs was significantly higher compared to that of samples with 99% healthy RBCs and 1% stiff RBCs or 100% healthy RBCs, and the REI of samples with 99% healthy RBCs and 1% stiff RBCs was significantly higher compared to that of 100% healthy RBCs (p < 0.05, paired t-test). (E) The REI significantly correlates with the ROI in the tested samples (PCC = 0.987, p < 0.0001, N = 12). ROI: RBC occlusion index. REI: RBC electrical impedance index. PCC: Pearson correlation coefficient. Error bars represent standard deviation. N = 4 for each group.
Fig. 3.
Fig. 3.
Measurement reproducibility was assessed by repeatedly testing one RBC sample from a single healthy donor using five different devices. Shown are the ROI and REI results of the five repeats (mean ± standard deviation). ROI: RBC occlusion index. REI: RBC electrical impedance index. Error bars represent standard deviation.
Fig. 4.
Fig. 4.
Assessment of RBC deformability and microvascular occlusion in two common red cell disorders, sickle cell disease (SCD) and hereditary spherocytosis (HS). (A) Histograms of microcapillary occlusion for the tested RBC samples from healthy donors and subjects with SCD or HS. (B) The ROI of RBCs from subjects with SCD or HS is significantly higher compared to that from healthy donors (p < 0.05, one-way ANOVA). (C) Histograms of impedance change for the tested RBC samples from healthy donors and subjects with SCD or HS. (D) The REI of RBCs from subjects with SCD or HS is also significantly higher compared to that from healthy donors (p < 0.05, one-way ANOVA). (E) The REI significantly correlates with the ROI in the tested samples (PCC = 0.946, p < 0.0001, N = 19). ROI: RBC occlusion index. REI: RBC electrical impedance index. PCC: Pearson correlation coefficient. Error bars represent standard deviation. N = 5 for healthy, N = 12 for SCD, and N = 2 for HS.
Fig. 5.
Fig. 5.
MIRCA assessment of RBC-mediated microvascular occlusion as an in vitro therapeutic efficacy benchmark to assess the clinical outcome of treatments in SCD. (A) A subpopulation (group 1, N = 5) with distinct ROI and REI profiles compared to the rest (group 2, N = 7) was identified. Group 1 subjects had significantly lower (B) ROI (p < 0.001, one-way ANOVA) and (C) REI (p = 0.006, Mann–Whitney) compared to group 2 subjects. Moreover, group 1 subjects had relatively lower (D) serum lactate dehydrogenase (LDH) levels (p = 0.052, Mann–Whitney) and (E) absolute reticulocyte counts (ARCs) (p = 0.037, Mann–Whitney) compared to group 2 subjects. The dashed rectangular regions represent typical normal ranges for the given clinical parameters. HSCT: hematopoietic stem-cell transplantation. ROI: RBC occlusion index. REI: RBC electrical impedance index. Error bars represent standard deviation.

References

    1. Diez-Silva M, Dao M, Han JY, Lim CT and Suresh S, Mrs Bull, 2010, 35, 382–388. - PMC - PubMed
    1. Tomaiuolo G, Biomicrofluidics, 2014, 8, 051501. - PMC - PubMed
    1. Guo P and Fu BM, Journal of biomechanical engineering, 2012, 134, 041003. - PMC - PubMed
    1. Lacelle PL, Semin Hematol, 1970, 7, 355–371. - PubMed
    1. Mohandas N, Clark MR, Jacobs MS and Shohet SB, J Clin Invest, 1980, 66, 563–573. - PMC - PubMed

Publication types