. 2021 May 3;218(5):e20200817.
doi: 10.1084/jem.20200817.

Group 2 innate lymphoid cells support hematopoietic recovery under stress conditions

Affiliations

Group 2 innate lymphoid cells support hematopoietic recovery under stress conditions

Takao Sudo et al. J Exp Med. .

Abstract

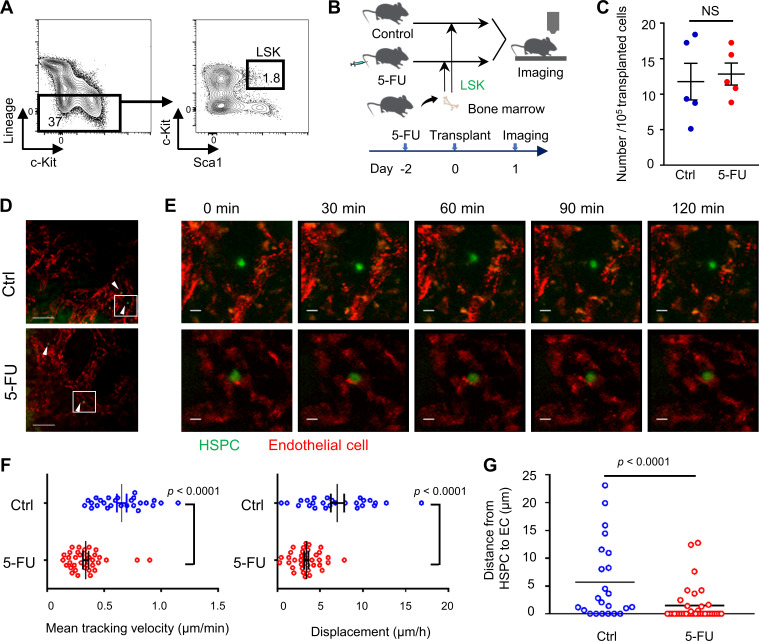
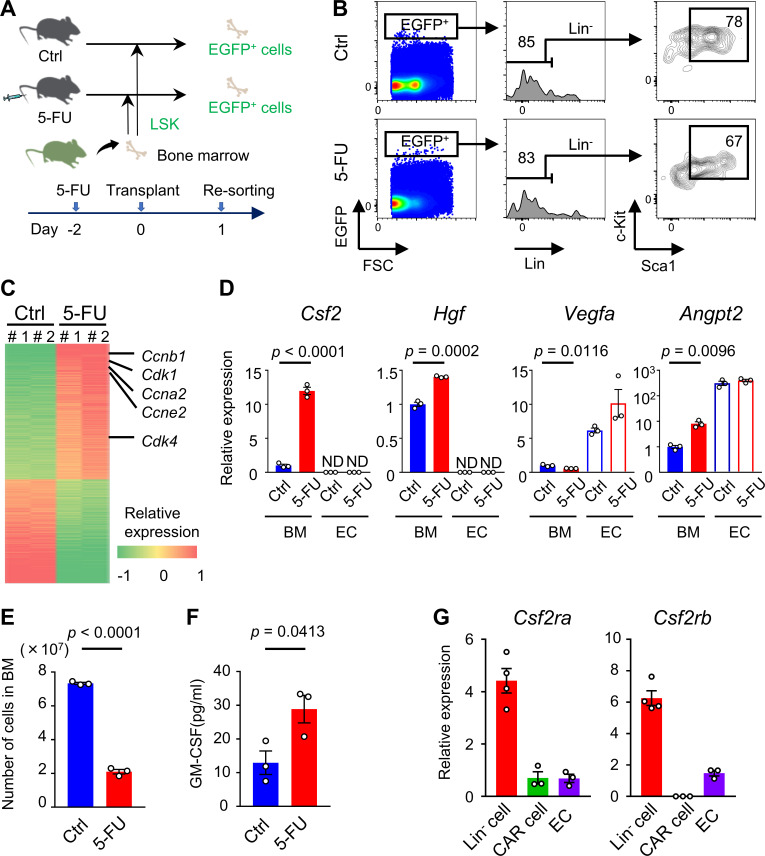
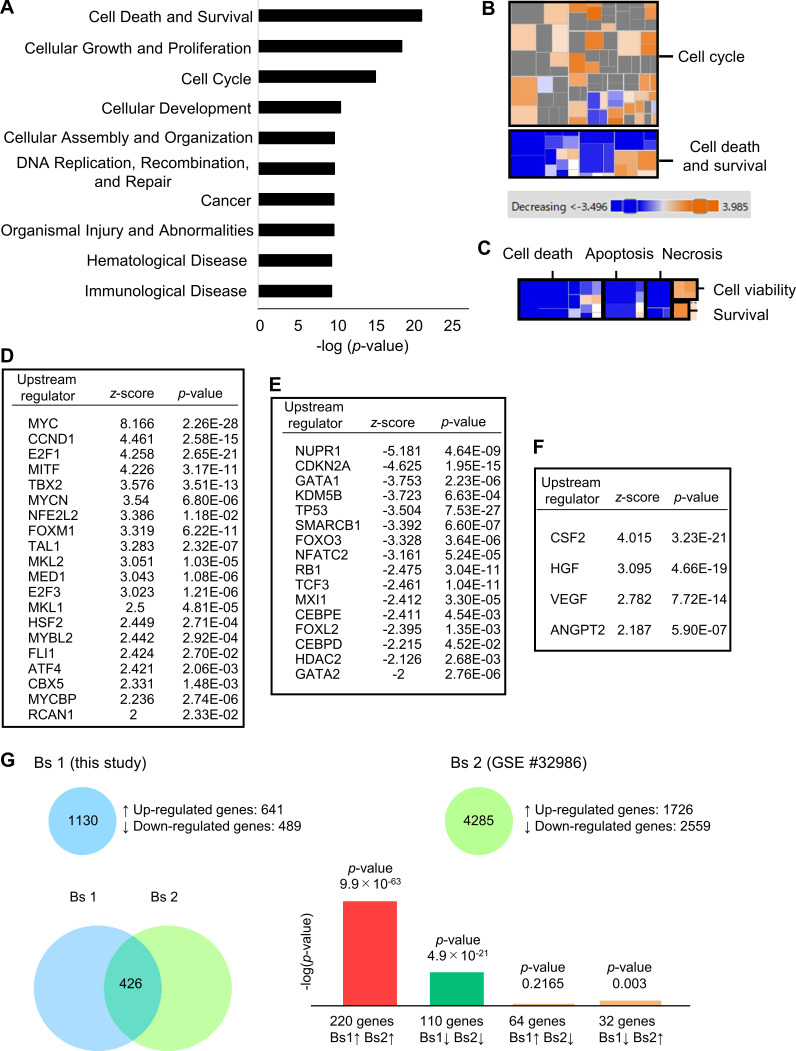
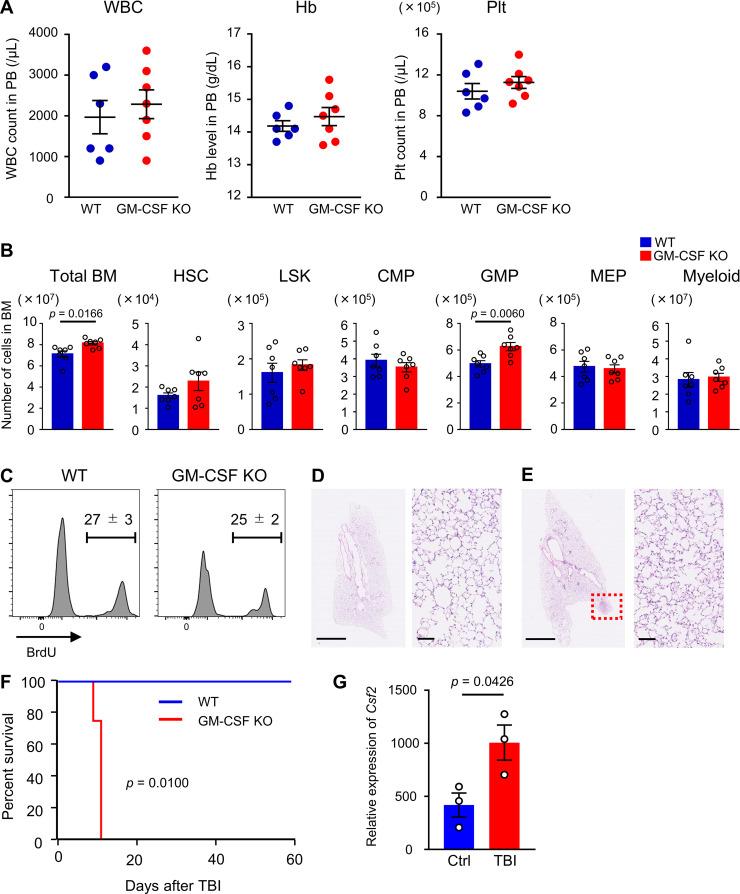
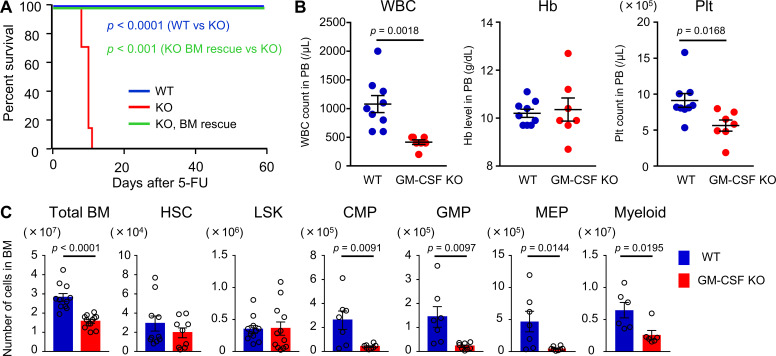
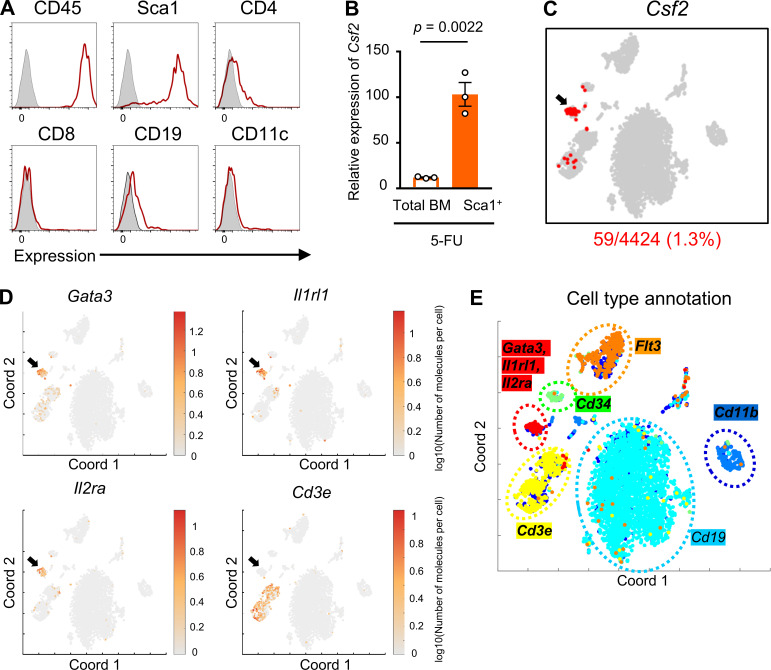
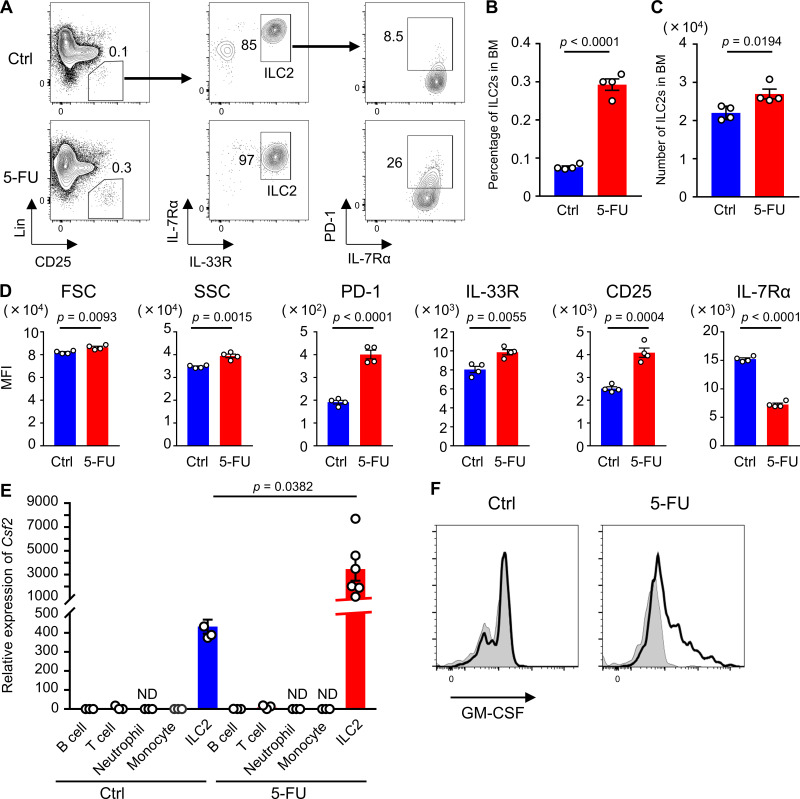
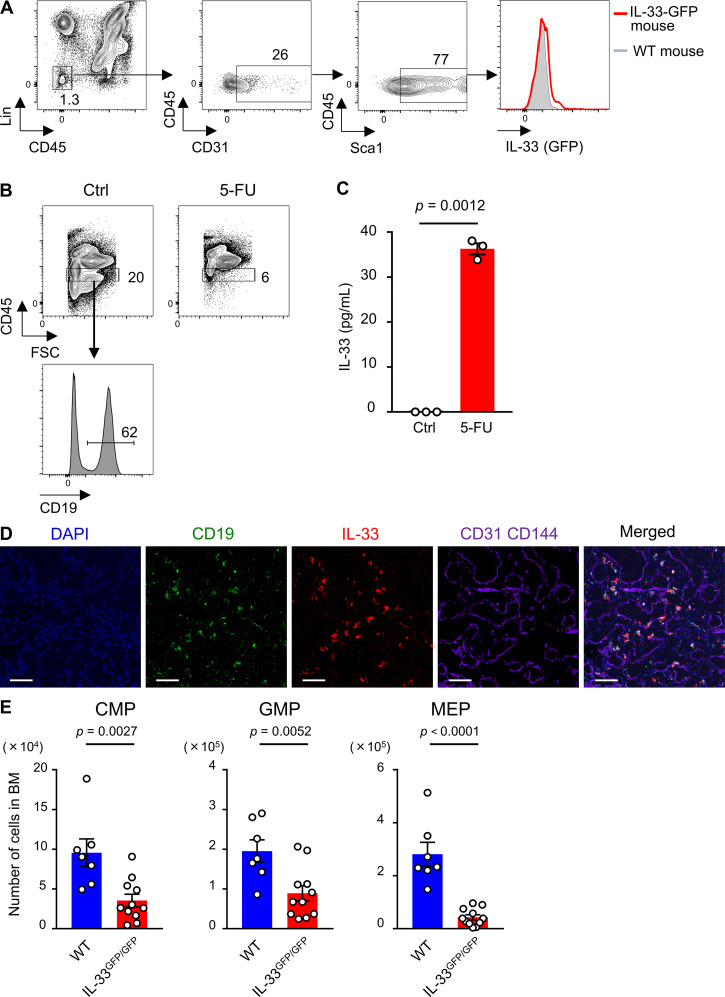
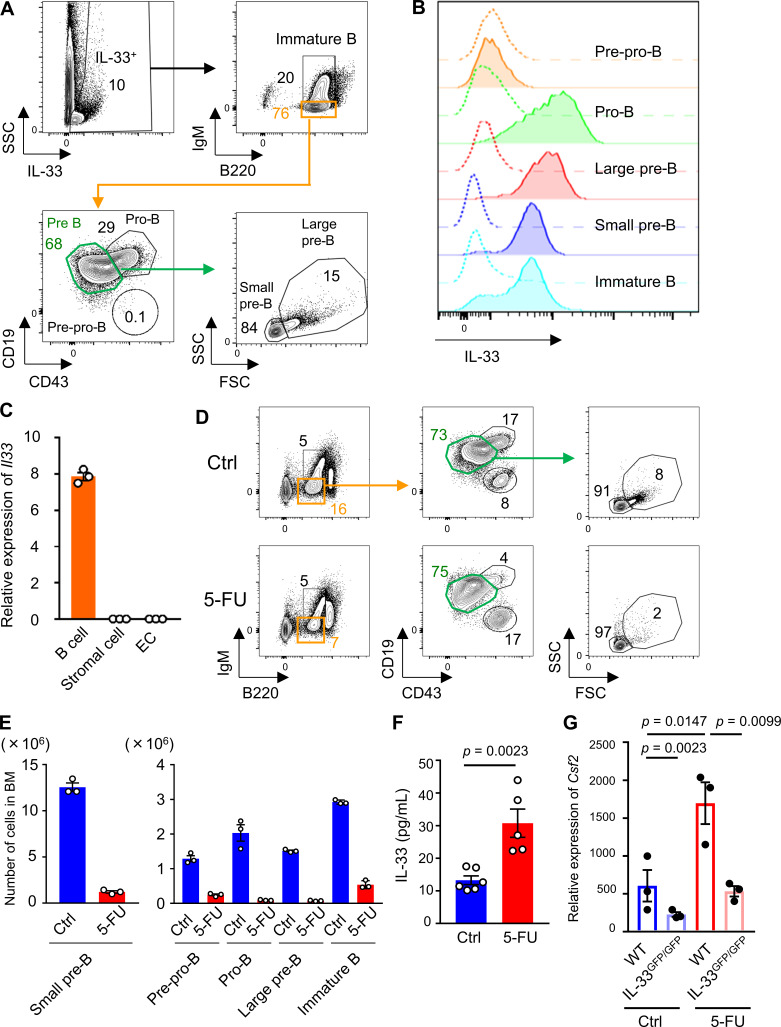
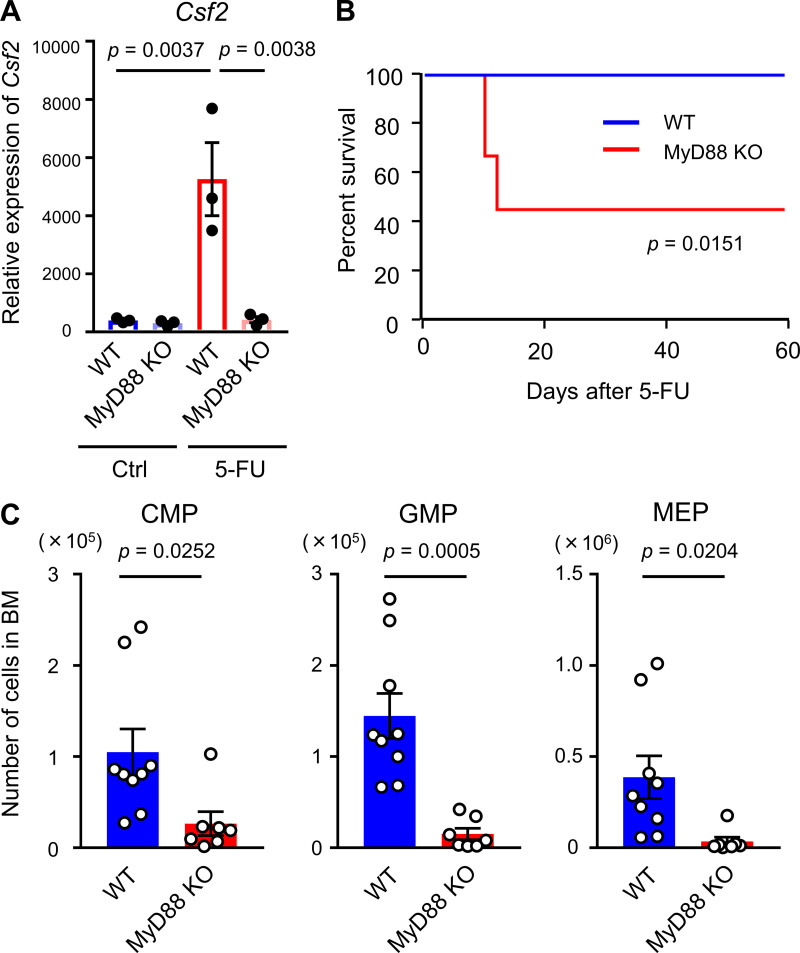
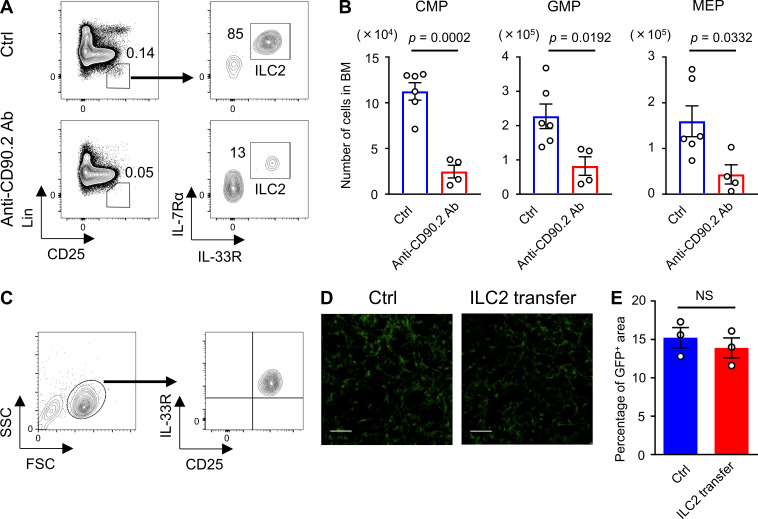
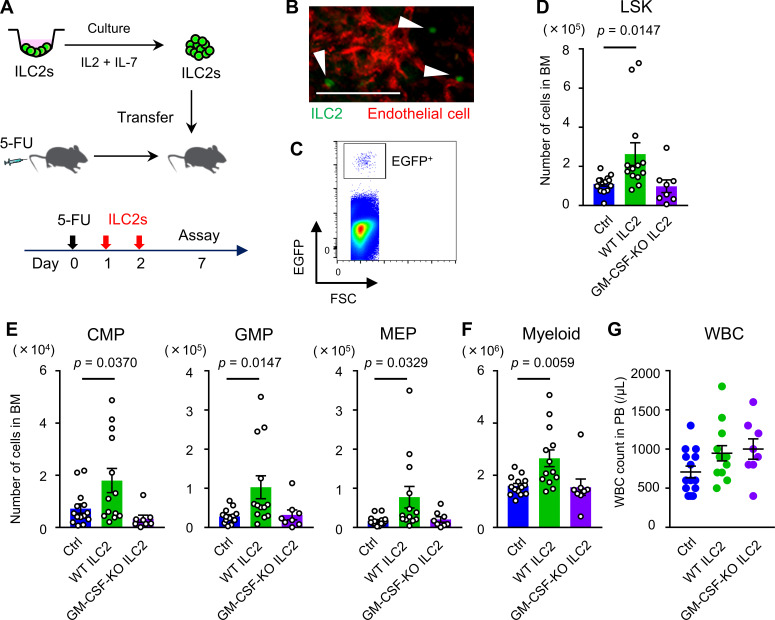
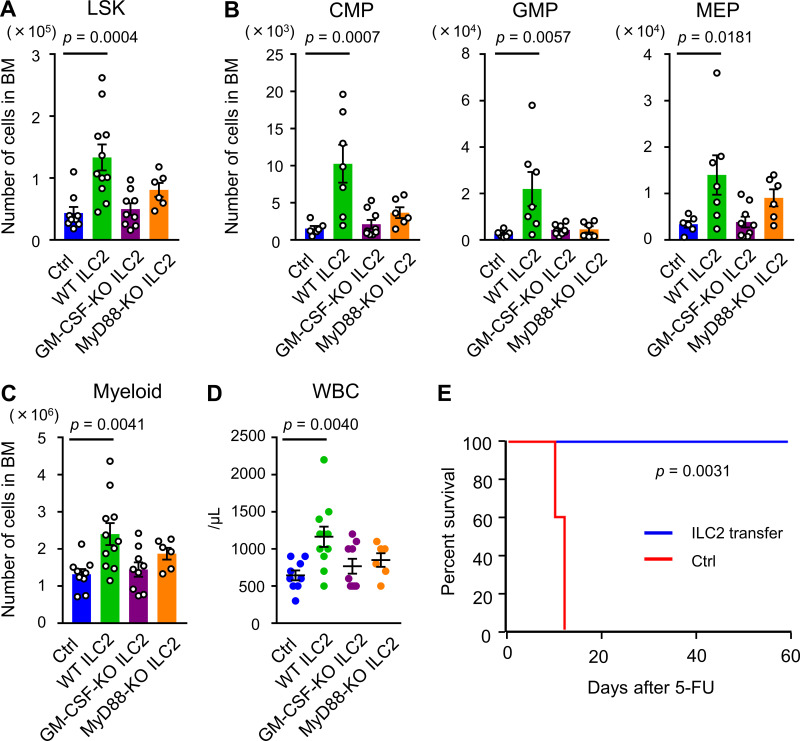
The cell-cycle status of hematopoietic stem and progenitor cells (HSPCs) becomes activated following chemotherapy-induced stress, promoting bone marrow (BM) regeneration; however, the underlying molecular mechanism remains elusive. Here we show that BM-resident group 2 innate lymphoid cells (ILC2s) support the recovery of HSPCs from 5-fluorouracil (5-FU)-induced stress by secreting granulocyte-macrophage colony-stimulating factor (GM-CSF). Mechanistically, IL-33 released from chemo-sensitive B cell progenitors activates MyD88-mediated secretion of GM-CSF in ILC2, suggesting the existence of a B cell-ILC2 axis for maintaining hematopoietic homeostasis. GM-CSF knockout mice treated with 5-FU showed severe loss of myeloid lineage cells, causing lethality, which was rescued by transferring BM ILC2s from wild-type mice. Further, the adoptive transfer of ILC2s to 5-FU-treated mice accelerates hematopoietic recovery, while the reduction of ILC2s results in the opposite effect. Thus, ILC2s may function by "sensing" the damaged BM spaces and subsequently support hematopoietic recovery under stress conditions.


Conflict of interest statement

Disclosures: The authors declare no competing interests exist.

Figures

Figure S1.
Figure S1.
Myelosuppressive BM environments influence the behavior of HSPCs. (A–G) LSK cells, which were sorted from WT mice and labeled with green dye CMFDA, were transplanted into steady-state (control [Ctrl]) or conditioned mice treated with 5-FU 2 d before transplantation. On the day following transplantation, in vivo two-photon microscopic imaging of skull BM was performed. (A) Sorting strategy of LSK cells. (B) Schematic of the procedure. (C) The number of HSPCs per 105 transplanted cells in visualized skull bone area of control and 5-FU–treated recipient mice (n = 5 each). Results are shown as mean ± SEM. (D) Representative snapshots. Green (arrowhead) and red cells are HSPCs and ECs, respectively. Scale bars, 100 µm. (E) Magnified images from the outlined region in D. Scale bars, 10 µm. See also Video 1 and Video 2. (F) Three-dimensional motility of each transplanted cell was calculated. Results are shown as mean ± SEM, and each dot represents speed (μm/min) or displacement (μm/h) of an individual cell (n = 26 from seven experiments in control; n = 36 from five experiments in 5-FU). (G) The maximum distance from EC to each HSPC during 2-h live imaging (n = 23 from nine experiments in control; n = 36 from seven experiments in 5-FU). Results are shown as mean. Each dot represents an individual cell. Statistical significance was determined by unpaired Student’s t test (C, F, and G).
Figure 1.
Figure 1.
HSPCs in stressed BM receive strong GM-CSF signals. (A–C) LSK cells, which were sorted from CAG-EGFP mice, were transplanted into steady-state control (Ctrl) or 5-FU–treated WT mice. Then, EGFP+ cells in the recipient BM were sorted from two groups, and RNA-seq analyses were conducted. (A) Schematic of the procedure. (B) Flow cytometry plots of BMMNCs of untreated (control) or 5-FU–treated recipient WT mice that were transplanted with LSK cells from CAG-EGFP mice. Results shown are representative of two independent experiments. (C) Heat map of differentially expressed genes in RNA-seq analyses of HSPCs transplanted and homed into recipient BM (5-FU versus control); n = 2 per group. (D–F) Phenotypical changes of WT mice through a single 5-FU (200 mg/kg) injection. Each experiment was performed on day 0 (control) and day 2. (D) qRT-PCR analyses for the expression of indicated genes of total BM cells and ECs; n = 3, representative of two independent experiments. (E) The numbers of total BM cells in femurs and tibias; n = 3, representative of two independent experiments. (F) GM-CSF protein levels in femur analyzed by ELISA; n = 3, representative of two independent experiments. (G) qRT-PCR analyses for the expression of Csf2ra and Csf2rb genes in Lin cells, CAR cells, and ECs that were collected from BM of WT mice 2 d following 200 mg/kg 5-FU injection; n = 3 or 4, representative of two independent experiments. In the bar charts, the results are shown as mean ± SEM, and each dot represents an individual mouse. Statistical significance was determined by unpaired Student’s t test. ND, not detectable.
Figure S2.
Figure S2.
Bioinformatic analysis of HSPCs homed into 5-FU–treated BM to determine activated signals. (A–F) Bioinformatic analyses of RNA-seq data were conducted. Sequencing data shown here are overlapped with data shown in Fig. 1 C. (A) The top 10 enriched biological functional categories between two groups, according to the Ingenuity Knowledge Base, are listed. The x axis shows the significance, which is the value of –log(P value). (B) Color-coded heat map analyses regarding “cell cycle” and “cell death and survival” among enriched biological functional categories. (C) Subcategories in the highlighted heat map of “cell death and survival” category within B. (D and E) Upstream transcriptional regulators that were significantly activated (z-score > 2; D) or inhibited (z-score < −2; E) in HSPCs transplanted into 5-FU–treated mice compared with those into control mice. (F) Upstream cytokine/growth factors that were significantly activated (z-score > 2) in HSPCs transplanted into 5-FU–treated mice compared with those into control mice. (G) Differentially expressed genes from RNA-seq in this study (bioset 1) were compared with those in another study (bioset 2), in which gene expression of GM-CSF–stimulated versus unstimulated dendritic cells in vitro was analyzed (Min et al., 2012), using the BaseSpace Correlation Engine (Illumina). A strong positive correlation was observed between the two biosets. The Venn diagram shows the number of differentially expressed genes that are overlapped in the two biosets. The bar graph shows the significance levels of overlapped or unique genes by –log(P value). GSE, Gene Expression Omnibus Series.
Figure S3.
Figure S3.
Phenotype of GM-CSF–KO mice. (A and B) PB and BM cellularity in WT and GM-CSF–KO mice in the steady-state. (A) WBC, hemoglobin (Hb), and platelet (Plt) counts in PB; n = 6 in WT, n = 7 in GM-CSF–KO. Data are pooled from two independent experiments. (B) The numbers of total BM cells, HSCs (CD48CD150+ LSK cells), LSK cells, CMPs, GMPs, MEPs, and Gr1+ or CD11b+ myeloid cells from femurs and tibias; n = 7, pooled from two independent experiments. (C) BrdU incorporation in LSK cells from WT and GM-CSF–KO mice; n = 3, representative of two independent experiments. (D and E) Lung tissues from 5-FU–treated (200 mg/kg) WT and GM-CSF–KO mice at day 5 were dissected after perfusion-fixation with 4% PFA. Dissected tissues were further fixed in 4% PFA overnight and embedded in paraffin. Sections from WT (D) and GM-CSF–KO (E) mice stained with hematoxylin and eosin are shown. Scale bars, 2.5 mm in left panels, 100 µm in right panels. Dotted red square in E shows tubercule composed of eosinophilic protein. (F) Kaplan–Meier survival curves of WT (blue line) or GM-CSF–KO mice (red line) that received 5.5 Gy of TBI; n = 4, representative of two independent experiments. (G) qRT-PCR analyses for the expression of Csf2 in WT ILC2s from control (Ctrl) or TBI (5.5 Gy) day 2 mice; n = 3, representative of two independent experiments. In the bar charts, the results are shown as mean ± SEM, and each dot represents an individual mouse. Statistical significance was determined by unpaired Student’s t test (A–C and G) or log-rank test (F).
Figure 2.
Figure 2.
GM-CSF is crucial for BM recovery. (A) Kaplan–Meier survival curves. WT (blue line, n = 10) or GM-CSF–KO mice (red line, n = 7) were treated with a single dose of 200 mg/kg 5-FU. In the BM rescue group, KO mice were treated with 5-FU, and 2 d later, they were transplanted with 1 × 10⁷ BM cells from WT mice treated with 200 mg/kg 5-FU 2 d prior (green line, n = 6). Data are pooled from two independent experiments. (B and C) WT and GM-CSF–KO mice were treated with 150 mg/kg 5-FU. PB counts and BM cellularity were analyzed on day 8. (B) WBC, hemoglobin (Hb), and platelet (Plt) counts in PB; n = 9 in WT, n = 7 in KO. Data are pooled from two independent experiments. (C) The numbers of total BM cells, HSCs (CD48CD150+ LSK cells), LSK cells, CMPs, GMPs, MEPs, and Gr1+ or CD11b+ myeloid cells from femurs and tibias; n = 6–12, pooled from two independent experiments. In the bar charts, the results are shown as mean ± SEM, and each dot represents an individual mouse. Statistical significance was determined by the log-rank test (A) or unpaired Student’s t test (B and C).
Figure 3.
Figure 3.
The BM Csf2-positive cluster is composed of ILC2s. (A) Histograms of surface markers in GM-CSF+ BM cells from 5-FU–treated WT mice. The tinted lines show the background level. Results shown are representative of two independent experiments. (B) qRT-PCR analyses for the expression of Csf2 in total BM cells and Sca1+ BM cells from 5-FU–treated mice; n = 3, representative of two independent experiments. Bars indicate expression level relative to that in total BM cells at day 0. (C–E) Single-cell RNA-seq analysis of Sca1+ BMMNCs sorted from 5-FU–treated WT mice. (C) t-SNE projection highlighting Csf2 expressing cells (number of detected mRNA molecules >0). The arrow shows a cluster expressing Csf2. (D) t-SNE projection of the expression pattern for Gata3, Il1rl1, Il2ra, and Cd3e. The color of each cell represents the log10(number of molecules per cell). The arrows are in the same position as in C. (E) Six main clusters generated by t-SNE analysis. Each cluster expressed Cd11b, Cd19, Cd34, Cd3e, Flt3, and a combination of Gata3, Il1rl1, and Il2ra. For the 5-FU–treated mice groups, mice were injected intravenously with 200 mg/kg 5-FU 2 d before being euthanized (A–E). Results are shown as mean ± SEM, and each dot represents an individual mouse. Statistical significance was determined by unpaired Student’s t test (B). Coord, t-SNE coordinate.
Figure 4.
Figure 4.
BM ILC2s become activated and produce GM-CSF after BM stress. (A) Representative flow cytometry plots of BM cells to identify LinCD25+IL-7Rα+IL-33R+ ILC2s. (B) Percentage of ILC2s among BMMNCs; n = 4, representative of two independent experiments. (C) Number of ILC2s in femurs and tibias; n = 4, representative of two independent experiments. (D) Mean fluorescence intensity (MFI) of markers in ILC2 population; n = 4, representative of two independent experiments. (E) qRT-PCR analyses for the expression of Csf2 in B cells, T cells, neutrophils, monocytes, and ILC2s; n = 3–6, representative of two independent experiments. Bars indicate expression level relative to that in total BM cells at day 0. (F) Intracellular GM-CSF levels in LinIL-33R+ population. The tinted lines show the background levels. Results shown are representative of two independent experiments. For the 5-FU–treated mice groups, mice were injected intravenously with 200 mg/kg 5-FU 2 d before being euthanized (A–F). In the bar charts, results are shown as mean ± SEM, and each dot represents an individual mouse. Statistical significance was determined between the control (Ctrl) and 5-FU–treated mice by unpaired Student’s t test (B–E). ND, not detectable.
Figure S4.
Figure S4.
B cell progenitors are a source of IL-33 in injured BM. (A) Flow cytometry of collagenase-treated BM samples from IL-33–GFP mice. In the histogram, IL-33–GFP levels in LinCD45CD31+Sca1+ ECs of IL-33–GFP (red line) and control (Ctrl) WT (gray-tinted line) mice are shown. Results shown are representative of three independent experiments. (B) Flow cytometry of flushed BM cells from WT mice on day 0 (Ctrl) and day 2 after 200 mg/kg 5-FU injection. In upper panels, gated fraction represents CD45Lo BM cell. Lower histogram shows the expression level of CD19 in CD45Lo cells of homeostatic WT mice. Results shown are representative of three independent experiments. (C) CD19+ B cells from BM of WT mice were seeded in the presence of 5-FU. IL-33 levels of supernatants and control culture medium were measured by ELISA; n = 3, representative of two independent experiments. (D) Immunohistochemical analyses of BM sections from 5-FU–treated mice (200 mg/kg, day 2). Scale bars, 50 µm. Results shown are representative of two independent experiments. (E) WT and IL-33GFP/GFP mice were treated with 150 mg/kg 5-FU. BM cellularity was analyzed on day 8. The numbers of CMPs, GMPs, and MEPs from femurs and tibias are shown; n = 7 in WT, n = 11 in IL-33GFP/GFP. Data are pooled from two independent experiments. In the bar charts, the results are shown as mean ± SEM, and each dot represents an individual mouse. Statistical significance was determined by unpaired Student’s t test (C and E).
Figure 5.
Figure 5.
IL-33 secreted by B cell progenitors activates BM ILC2s after 5-FU treatment. (A) Flow cytometry of BM cells from IL-33–GFP mice showing B cell progenitors, including pre-pro-B, pro-B, large pre-B, small pre-B, and immature B cells. Each number indicates the percentage of each fraction. Results shown are representative of three independent experiments. (B) IL-33–GFP levels in each B cell progenitor fraction of IL-33–GFP mice. Dashed lines represent background levels in WT mice. Results shown are representative of three independent experiments. (C) qRT-PCR analyses for the expression of Il33 in CD19+ B cells, stromal cells, and ECs sorted from WT mice; n = 3, representative of two independent experiments. (D) Flow cytometry plots of BM cells from control (Ctrl) or 5-FU–treated WT mice to evaluate the size of each B cell progenitor. Results shown are representative of three independent experiments. (E) The numbers of each B cell progenitor fraction from femurs and tibias of control or 5-FU–treated WT mice; n = 3, representative of two independent experiments. (F) IL-33 protein levels in femur analyzed by ELISA; n = 6 in control, n = 5 in 5-FU, representative of two independent experiments. (G) qRT-PCR analyses for the expression of Csf2 in BM ILC2s from WT and IL-33GFP/GFP mice; n = 3, representative of two independent experiments. In 5-FU–treated groups, mice were intravenously injected with 200 mg/kg 5-FU 2 d before euthanization. Results are shown as mean ± SEM. Statistical significance was determined by unpaired Student’s t test (F) or ANOVA with the Bonferroni post hoc test (G).
Figure 6.
Figure 6.
MyD88 deficiency shows a phenocopy of GM-CSF deficiency upon stress by 5-FU. (A) qRT-PCR analyses for the expression of Csf2 in BM ILC2s from WT and MyD88-KO mice; n = 3, representative of two independent experiments. (B) Kaplan–Meier survival curves. WT (blue line) or MyD88-KO mice (red line) were treated with a single dose of 200 mg/kg 5-FU; n = 8 in WT, n = 9 in KO. Data are pooled from two independent experiments. (C) WT and MyD88-KO mice were treated with 150 mg/kg 5-FU, and BM cellularity was analyzed on day 8. The numbers of CMPs, GMPs, and MEPs from femurs and tibias are shown; n = 9 in WT, n = 7 in KO. Data are pooled from two independent experiments. In the bar charts, the results are shown as mean ± SEM, and each dot represents an individual mouse. Statistical significance was determined by ANOVA with the Bonferroni post hoc test (A), log-rank test (B), or unpaired Student’s t test (C). Ctrl, control.
Figure S5.
Figure S5.
ILC2s are responsible for hematopoietic recovery. (A) Flow cytometry plots of BM cells from control (Ctrl) or anti-CD90.2 Ab-treated WT mice. Mice received four injections of 200 µg anti-CD90.2 Ab intraperitoneally every other day until 1 d before being euthanized. Control mice were injected with PBS. Results shown are representative of three independent experiments. (B) Control and anti-CD90.2 Ab-treated WT mice were injected with 150 mg/kg 5-FU. BM cellularity was analyzed on day 8 after 5-FU treatment. CMP, GMP, and MEP numbers from femurs and tibias; n = 6 in controls, n = 4 in Ab-treated mice. Results shown are representative of two independent experiments. (C) Flow cytometry plots of cultured ILC2s. Results shown are representative of three independent experiments. (D and E) CXCL12-GFP mice were treated with 150 mg/kg 5-FU, and whole-mount confocal microscopy BM analysis was performed on day 7. In the ILC2 transfer group, mice were transferred with 2 × 10⁵ ILC2s from WT mice on days 1 and 2. Control mice were injected with PBS. (D) Representative MIP images of the CXCL12-GFP mice femoral bones. Green, CAR cells. Scale bars, 50 µm. (E) CXCL12-GFP+ area fractions relative to the whole visual field; n = 3, representative of two independent experiments. In the bar charts, the results are shown as mean ± SEM, and each dot represents an individual mouse. Statistical significance was determined by unpaired Student’s t test (B and E).
Figure 7.
Figure 7.
BM ILC2s accelerate hematopoietic recovery after 5-FU treatment. ILC2s from WT, CAG-EGFP, or GM-CSF–KO mice were sorted and cultured in medium supplemented with 10 ng/ml IL-2 and 10 ng/ml IL-7 to expand cell number. Then, 2 × 10⁵ cells were intravenously injected into 150 mg/kg 5-FU–treated WT mice on days 1 and 2. (A) Schematic figure of the experiment. (B and C) WT mice were transferred with ILC2s from CAG-EGFP mice. On the day after the last transfer, the lodgment of EGFP+ cells in recipient BM was confirmed. (B) Snapshot of skull BM using two-photon microscopy. Green (arrowhead): EGFP+ ILC2; red: isolectin+ ECs. Scale bar, 100 µm. Results shown are representative of two independent experiments. (C) Flow cytometry plot of femur BM. Gated fraction represents homed EGFP+ ILC2s. Results shown are representative of two independent experiments. (D–G) WT mice were transferred with ILC2s from WT or GM-CSF–KO mice after 5-FU treatment. Control (Ctrl) mice were injected with PBS. The numbers of LSK (D), CMPs, GMPs, and MEPs (E), and Gr1+ or CD11b+ myeloid cells (F) from femurs and tibias, and WBC count in PB (G) were analyzed on day 7; n = 14 in control, n = 13 in WT ILC2s, and n = 8–10 in GM-CSF–KO ILC2s. Data are pooled from two independent experiments. In the bar charts, the results are shown as mean ± SEM, and each dot represents an individual mouse. Statistical significance was determined by ANOVA with the Bonferroni post hoc test (D–G).
Figure 8.
Figure 8.
BM ILC2s from WT mice rescue lethality of GM-CSF–KO mice by 5-FU. (A–D) GM-CSF–KO mice were treated with 150 mg/kg 5-FU. Then, 2 × 10⁵ ILC2s from WT, GM-CSF–KO, or MyD88-KO mice were intravenously injected on days 1 and 2. Control (Ctrl) mice were injected with PBS. The numbers of LSK (A), CMPs, GMPs, and MEPs (B), and Gr1+ or CD11b+ myeloid cells (C) from femurs and tibias, and WBC count in PB (D) were analyzed on day 7; n = 6–9 in control, n = 7–11 in WT ILC2s, n = 9 in GM-CSF–KO ILC2s, and n = 6 in MyD88-KO ILC2s. Data are pooled from two independent experiments. (E) Kaplan–Meier survival curves. GM-CSF–KO mice were treated with a single dose of 200 mg/kg 5-FU. In the ILC2 rescue group, mice were transferred with 2 × 10⁵ ILC2s from WT mice on days 1 and 2 (blue line). Control mice were injected with PBS (red line); n = 5, representative oftwo independent experiments. In the bar charts, the results are shown as mean ± SEM, and each dot represents an individual mouse. Statistical significance was determined by ANOVA with the Bonferroni post hoc test (A–D) or the log-rank test (E).

Similar articles

Cited by

References

    1. Adachi, O., Kawai T., Takeda K., Matsumoto M., Tsutsui H., Sakagami M., Nakanishi K., and Akira S.. 1998. Targeted disruption of the MyD88 gene results in loss of IL-1- and IL-18-mediated function. Immunity. 9:143–150. 10.1016/S1074-7613(00)80596-8 - DOI - PubMed
    1. Akashi, K., Traver D., Miyamoto T., and Weissman I.L.. 2000. A clonogenic common myeloid progenitor that gives rise to all myeloid lineages. Nature. 404:193–197. 10.1038/35004599 - DOI - PubMed
    1. Bagby, G.C. Jr., Dinarello C.A., Wallace P., Wagner C., Hefeneider S., and McCall E.. 1986. Interleukin 1 stimulates granulocyte macrophage colony-stimulating activity release by vascular endothelial cells. J. Clin. Invest. 78:1316–1323. 10.1172/JCI112717 - DOI - PMC - PubMed
    1. Bartemes, K.R., Iijima K., Kobayashi T., Kephart G.M., McKenzie A.N., and Kita H.. 2012. IL-33-responsive lineage- CD25+ CD44(hi) lymphoid cells mediate innate type 2 immunity and allergic inflammation in the lungs. J. Immunol. 188:1503–1513. 10.4049/jimmunol.1102832 - DOI - PMC - PubMed
    1. Bowers, E., Slaughter A., Frenette P.S., Kuick R., Pello O.M., and Lucas D.. 2018. Granulocyte-derived TNFα promotes vascular and hematopoietic regeneration in the bone marrow. Nat. Med. 24:95–102. 10.1038/nm.4448 - DOI - PMC - PubMed

Publication types

MeSH terms

Substances