. 2021 Oct;19(4):669-684.
doi: 10.1007/s12021-021-09513-y. Epub 2021 Mar 5.

Identification of Neuronal Polarity by Node-Based Machine Learning

Affiliations

Identification of Neuronal Polarity by Node-Based Machine Learning

Chen-Zhi Su et al. Neuroinformatics. 2021 Oct.

Abstract

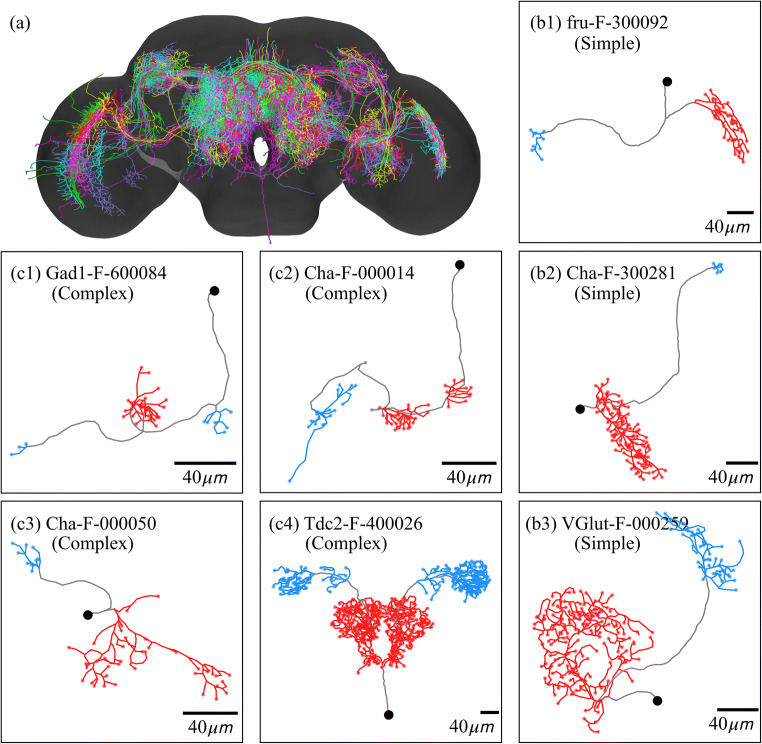
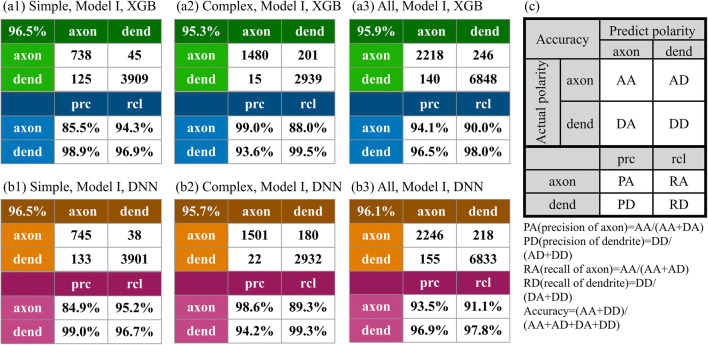
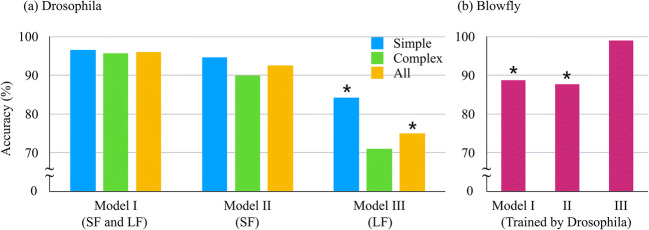
Identifying the direction of signal flows in neural networks is important for understanding the intricate information dynamics of a living brain. Using a dataset of 213 projection neurons distributed in more than 15 neuropils of a Drosophila brain, we develop a powerful machine learning algorithm: node-based polarity identifier of neurons (NPIN). The proposed model is trained only by information specific to nodes, the branch points on the skeleton, and includes both Soma Features (which contain spatial information from a given node to a soma) and Local Features (which contain morphological information of a given node). After including the spatial correlations between nodal polarities, our NPIN provided extremely high accuracy (>96.0%) for the classification of neuronal polarity, even for complex neurons with more than two dendrite/axon clusters. Finally, we further apply NPIN to classify the neuronal polarity of neurons in other species (Blowfly and Moth), which have much less neuronal data available. Our results demonstrate the potential of NPIN as a powerful tool to identify the neuronal polarity of insects and to map out the signal flows in the brain's neural networks if more training data become available in the future.

Keywords: Axon; Connectome; Dendrite; Drosophila; Machine learning; Neuronal polarity.


Conflict of interest statement

The authors declare that they have no conflict of interests.

Figures

Fig. 1
Fig. 1
Flowchart of the NPIN model. NPIN includes four major steps, as described in the text. The dataset contains 213 neurons with labeled polarity as the ground truth. We randomly choose 100/25/50 neurons from the datasets for training/validation/test sets. Every neuron in the training/validation sets is mapped to a level tree and a reduced tree. We then extract Soma Features and Local Features from these neuronal data for training. Preliminary results are obtained by XGB and DNN algorithms after validation. We then relabel the classification by including spatial correlations of nodal polarities before comparing them with the test data with known polarities. The whole process is repeated 20 times to cover all 213 neurons in the original dataset. As a result, each neuron could be selected to be a test sample and classified by a model trained on other neurons
Fig. 2
Fig. 2
Drosophila melanogaster (fruit fly) neurons used in the present study. (a) All 213 neurons in our dataset, shown in their actual locations in the standard fly brain. (b1)–(b3) Skeleton structures for several simple neurons. (c1)–(c4) Skeleton structures for several complex neurons. Black dots represent somas. Black lines are the main trunks of neurons. Blue or red lines indicate the axonal or dendritic clusters, respectively. Each neuron is labeled by its ID in the FlyCircuit database
Fig. 3
Fig. 3
Encoding 3D optical images of neurons into level trees and reduced trees. First, the volume image of a neuron (a1) is converted into the skeleton (a2), and then a level tree (a3), which is a 2D plot with a standardized method to label most features of the original neurons. Red, blue, and yellow dots represent dendrites, axons, and dividing nodes (including terminals), respectively. (a4) represents the reduced tree of the same neuron cell. (b1)–(b4) show the same reduction for a complex neuron. Because a complex neuron has more than two clusters, there can be more than one dividing node that separates axon clusters from dendrites. In (c), we graphically show the rules to define the nodal polarity based on the polarity of terminals in the level tree (see the text). Upward arrows indicate that the nodal polarity in the upper level is defined by the nodal polarities of the two nodes/terminals in the lower level
Fig. 4
Fig. 4
Feature distributions of axons and dendrites for all neurons in our dataset. (a1) and (a2) show the distribution of axon and dendrite nodes along the normalized path length to soma, for simple and complex neurons, respectively. (b1) and (b2) display the nodal distribution in terms of the normalized path length and the normalized distance to the soma. (c1) and (c3) show the nodal distribution in terms of the normalized path length to the soma and the curvature of the associated cluster. Blue and red dots represent axon and dendrite nodes, respectively. Details of curvature calculations are described in Appendix B
Fig. 5
Fig. 5
Performance of NPIN with Model I, where both Soma Features and Local Features are used. (a1)–(a3) are the confusion matrix and precision/recall table of the terminal polarity, based on the XGB algorithm for simple, complex, and all neurons, respectively. (b1)–(b3) are the same as in (a1)–(a3) but calculated by the DNN algorithm. (c) defines the confusion matrices shown in this figure. In the upper part of the table, each row indicates the actual polarity, and each column indicates the polarity predicted by NPIN. The lower part of the table displays the precision and recall of axonal and dendritic terminals. Precision and recall are defined in the equations below (c)
Fig. 6
Fig. 6
Performance of NPIN using Model II, where only Soma Features are included. (a1)–(a3) show the results for simple neurons, complex neurons, and all neurons, respectively, using the XGB algorithm. (b1)-(b3) are the same as (a1)–(a3) but for the DNN algorithm. (c) shows two similar complex neurons, where middle clusters have opposite polarities. The cluster labeled by A/D is axons/dendrites
Fig. 7
Fig. 7
Performance of NPIN with DNN algorithm for complex neurons in three different models. (a1)–(a3) are the confusion matrix and precision-recall table for the terminal polarity for Model I (with both Soma Features and Local Features), Model II (with Soma Features only), and Model III (with Local Features only), respectively. (b1)–(b3) display the same complex neuron with polarity classification using Model I, Model II, and Model III, respectively. Filled gray circles indicate the terminals of incorrect classification. (c1)–(c3) and (d1)–(d3) are the same as in (b1)–(b3) but with two different complex neurons. (e1)–(e4) are four different complex neurons, where polarities are classified by Model I with 100% accuracy by DNN algorithm
Fig. 8
Fig. 8
Performance of NPIN on blowfly brain neurons. (a1)–(a3) are the confusion matrices and precision-recall tables for Model I, Model II, and Model III, respectively. The models are trained on 213 fruit-fly neurons in our dataset. (b) is the result for Model I but trained on blowfly neurons directly. (c1)–(c4) display four example skeleton structures of the blowfly neurons used in this test
Fig. 9
Fig. 9
Summary of NPIN accuracies in all test conditions using the DNN algorithm. (a) shows the results for Model I (with both Soma Features and Local Features), Model II (with Soma Features only), and Model III (with Local Features only), for three types of test data: simple neurons, complex neurons, and all neurons, respectively. (b) shows the results for the same models but with the blowfly neurons (trained by our Drosophila dataset). Results with precision or recall of less than 50% are indicated by “*” (see the text)

References

    1. Asri H, Mousannif H, Moatassime HA, Noel T. Using Machine Learning Algorithms for Breast Cancer Risk Prediction and Diagnosis. Procedia Computer Science. 2016;83:1064–1069. doi: 10.1016/j.procs.2016.04.224. - DOI
    1. Chiang A-S, Lin C-Y, Chuang C-C, Chang H-M, Hsieh C-H, Yeh C-W, et al. Three-Dimensional Reconstruction of Brain-wide Wiring Networks in Drosophila at Single-Cell Resolution. Current Biology. 2011;21(1):1–11. doi: 10.1016/j.cub.2010.11.056. - DOI - PubMed
    1. Craig AM, Banker G. Neuronal Polarity. Annual Review of Neuroscience. 1994;17(1):267–310. doi: 10.1146/annurev.ne.17.030194.001411. - DOI - PubMed
    1. Cuntz H, Forstner F, Haag J, Borst A. The Morphological Identity of Insect Dendrites. PLoS Comput Biol. 2008;4(12):e1000251. doi: 10.1371/journal.pcbi.1000251. - DOI - PMC - PubMed
    1. Fischbach K-F, Dittrich APM. The optic lobe of Drosophila melanogaster. I. A Golgi analysis of wild-type structure. Cell and Tissue Research. 1989;258(3):441–475. doi: 10.1007/BF00218858. - DOI

Publication types

LinkOut - more resources