

Integrating across neuroimaging modalities boosts prediction accuracy of cognitive ability
- PMID: 33667224
- PMCID: PMC7984650
- DOI: 10.1371/journal.pcbi.1008347
Integrating across neuroimaging modalities boosts prediction accuracy of cognitive ability
Abstract
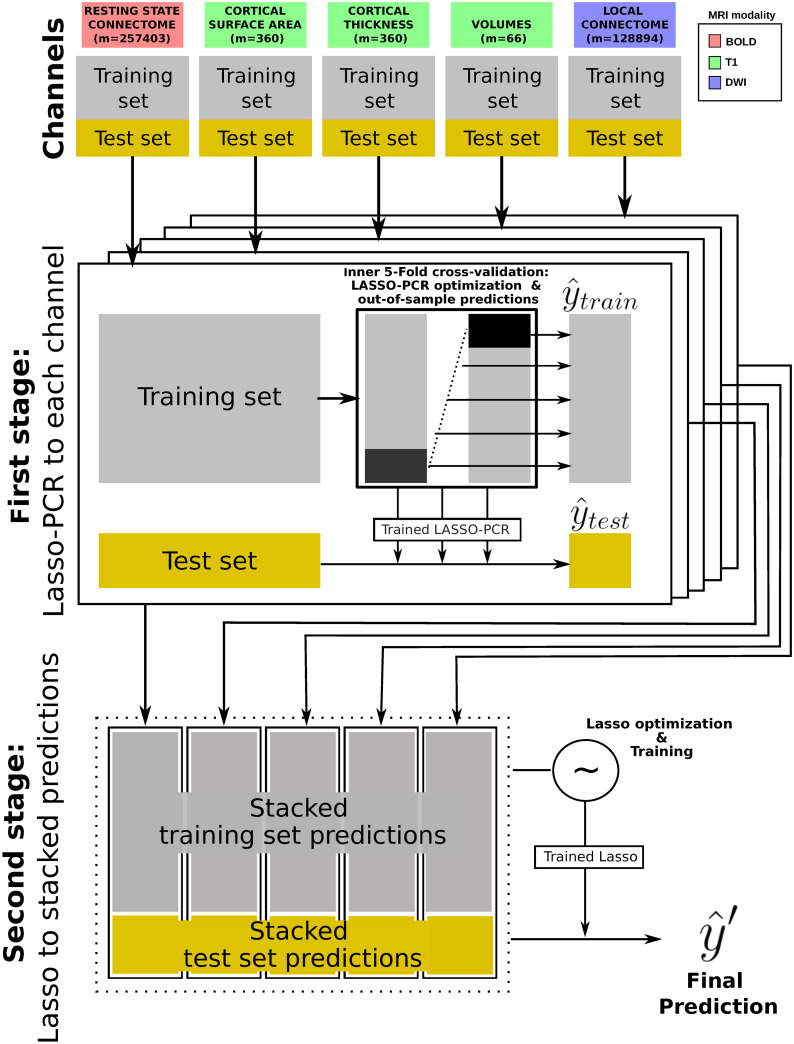
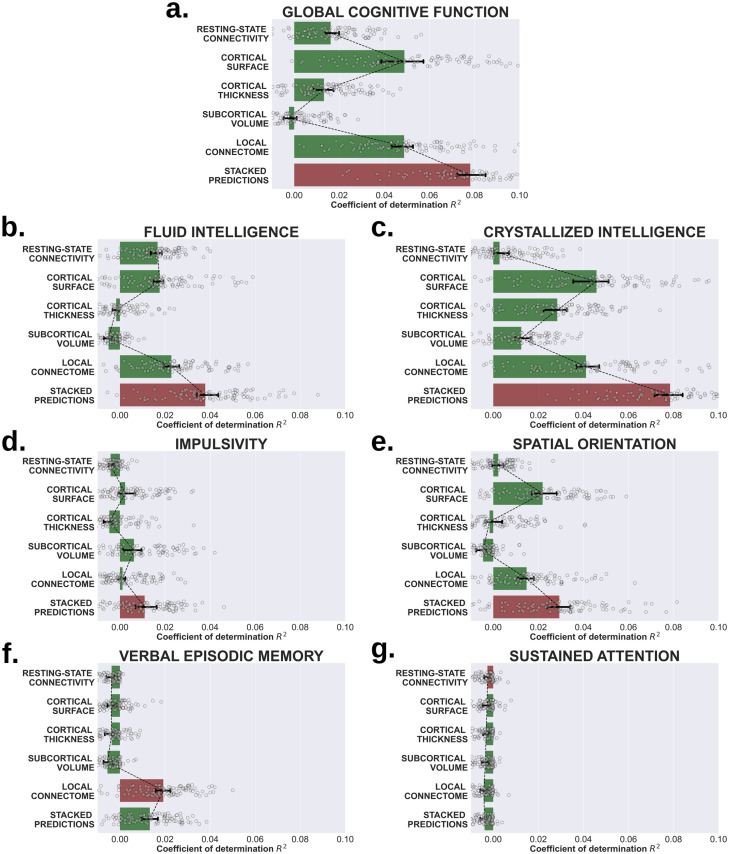
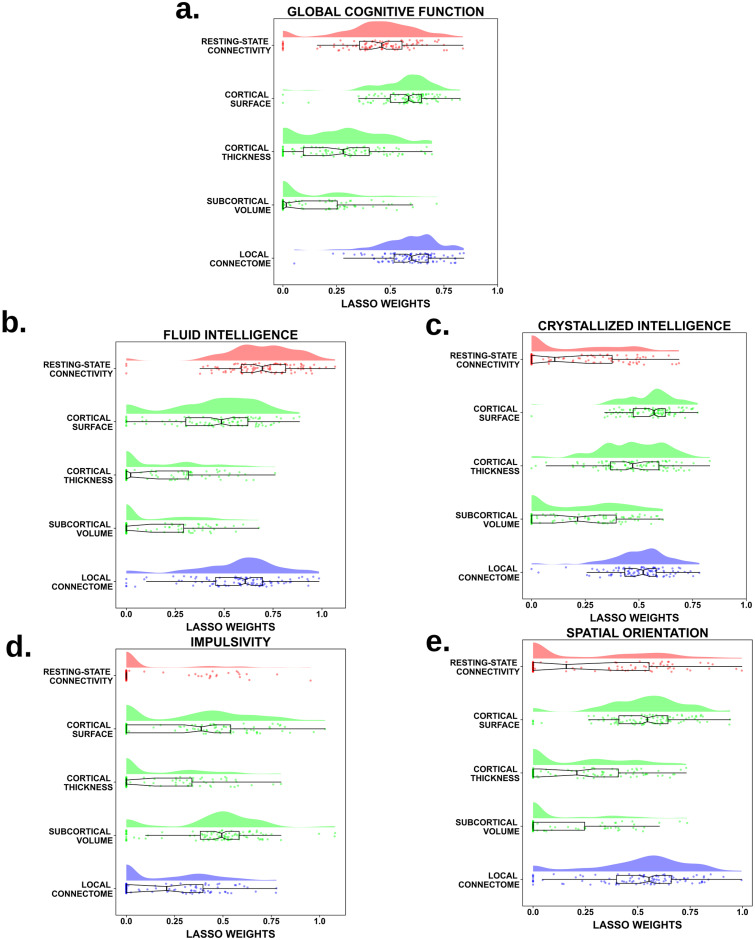
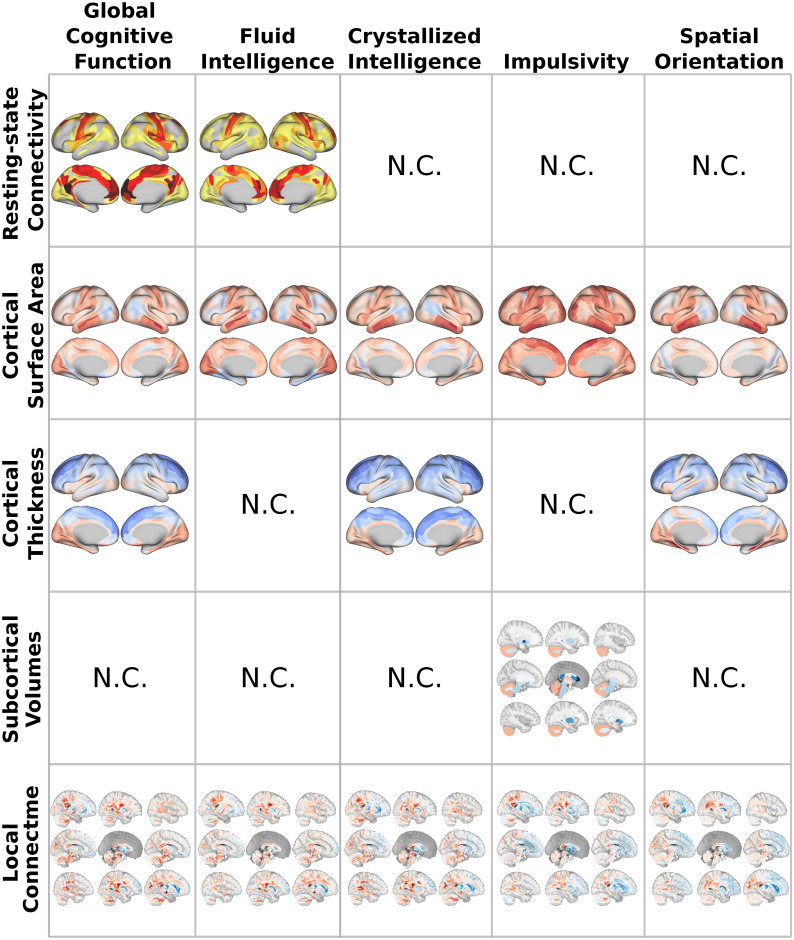
Variation in cognitive ability arises from subtle differences in underlying neural architecture. Understanding and predicting individual variability in cognition from the differences in brain networks requires harnessing the unique variance captured by different neuroimaging modalities. Here we adopted a multi-level machine learning approach that combines diffusion, functional, and structural MRI data from the Human Connectome Project (N = 1050) to provide unitary prediction models of various cognitive abilities: global cognitive function, fluid intelligence, crystallized intelligence, impulsivity, spatial orientation, verbal episodic memory and sustained attention. Out-of-sample predictions of each cognitive score were first generated using a sparsity-constrained principal component regression on individual neuroimaging modalities. These individual predictions were then aggregated and submitted to a LASSO estimator that removed redundant variability across channels. This stacked prediction led to a significant improvement in accuracy, relative to the best single modality predictions (approximately 1% to more than 3% boost in variance explained), across a majority of the cognitive abilities tested. Further analysis found that diffusion and brain surface properties contribute the most to the predictive power. Our findings establish a lower bound to predict individual differences in cognition using multiple neuroimaging measures of brain architecture, both structural and functional, quantify the relative predictive power of the different imaging modalities, and reveal how each modality provides unique and complementary information about individual differences in cognitive function.
Conflict of interest statement
The authors have declared that no competing interests exist.
Figures
References
-
- Flashman LA, Andreasen NC, Flaum M, Swayze VW. Intelligence and regional brain volumes in normal controls. Intelligence. 1997;25(3):149–160. 10.1016/S0160-2896(97)90039-8 - DOI
-
- Zimmerman ME, Brickman AM, Paul RH, Grieve SM, Tate DF, Gunstad J, et al.. The Relationship Between Frontal Gray Matter Volume and Cognition Varies Across the Healthy Adult Lifespan. The American Journal of Geriatric Psychiatry. 2006;14(10):823–833. 10.1097/01.JGP.0000238502.40963.ac - DOI - PubMed
-
- Posthuma D, Geus EJCD, Baaré WFC, Pol HEH, Kahn RS, Boomsma DI. The association between brain volume and intelligence is of genetic origin. Nature News. 2002;5(2):83–84. - PubMed
Publication types
MeSH terms
Grants and funding
LinkOut - more resources
Full Text Sources
Other Literature Sources
