. 2021 Apr 12;39(4):529-547.e7.
doi: 10.1016/j.ccell.2021.02.006. Epub 2021 Mar 4.

MDMX acts as a pervasive preleukemic-to-acute myeloid leukemia transition mechanism

Affiliations

MDMX acts as a pervasive preleukemic-to-acute myeloid leukemia transition mechanism

Koki Ueda et al. Cancer Cell. .

Abstract

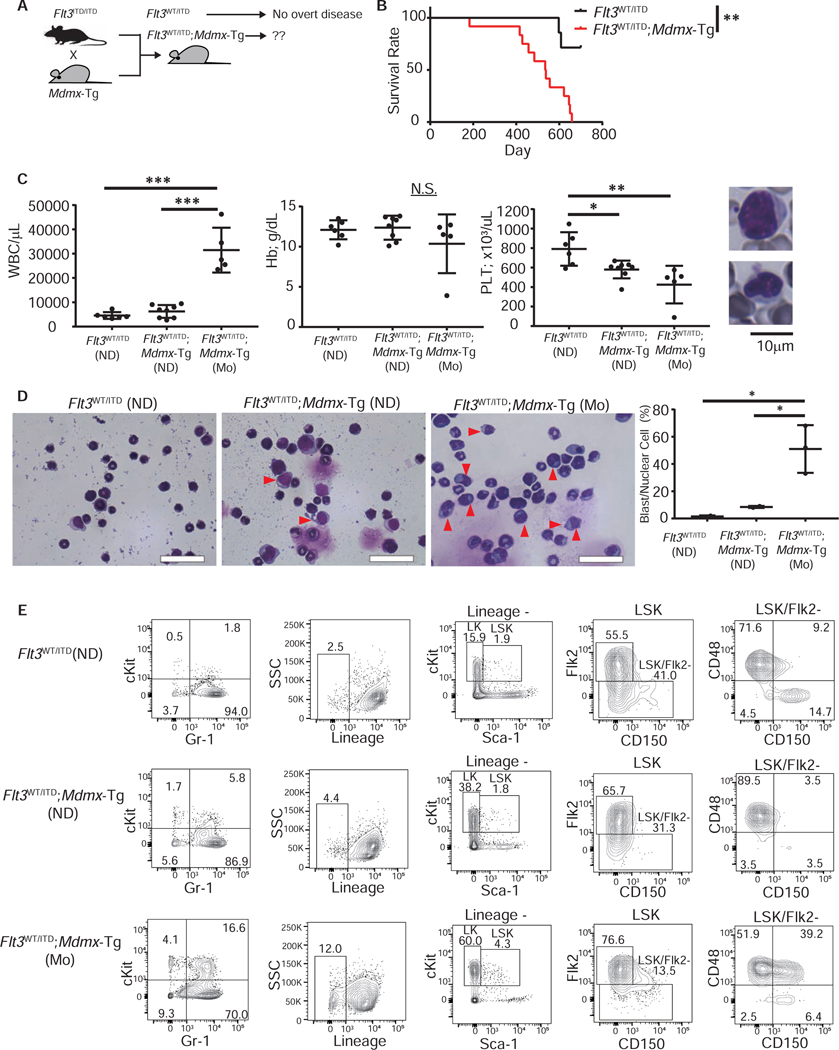
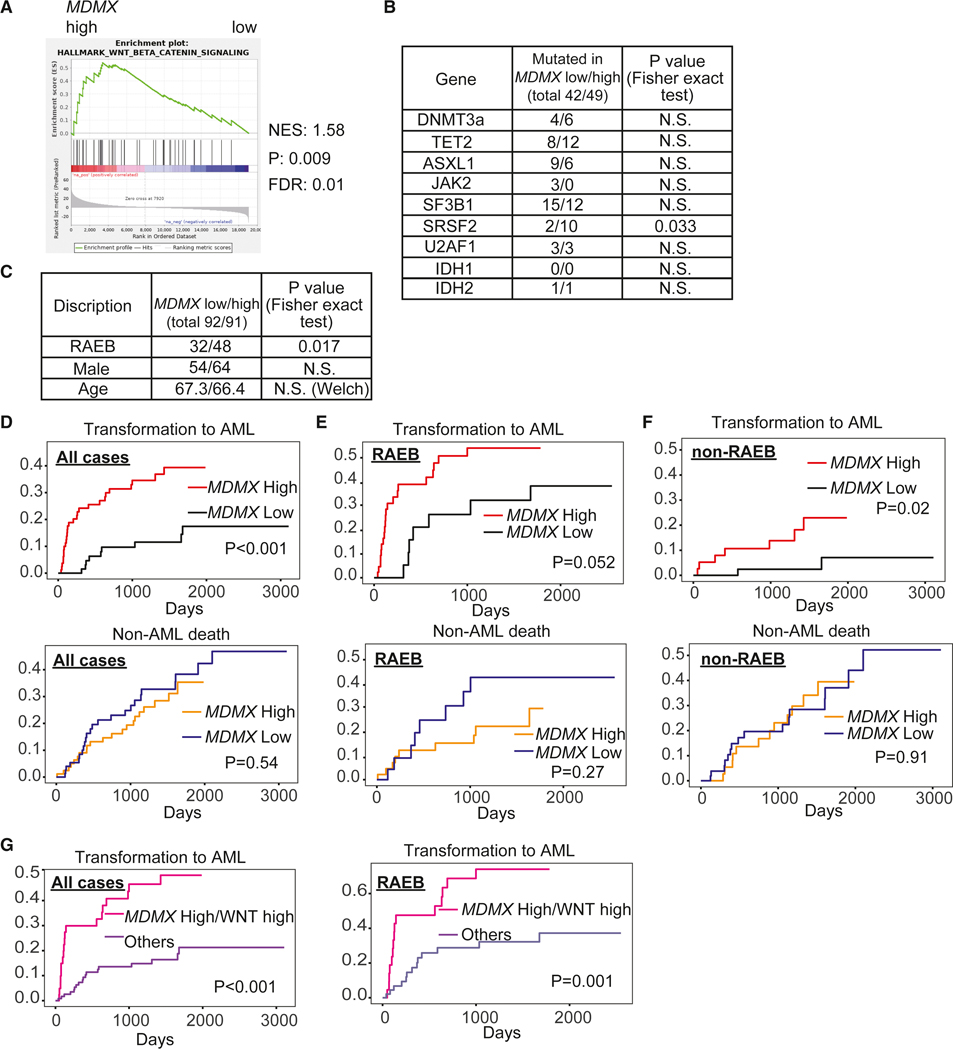
MDMX is overexpressed in the vast majority of patients with acute myeloid leukemia (AML). We report that MDMX overexpression increases preleukemic stem cell (pre-LSC) number and competitive advantage. Utilizing five newly generated murine models, we found that MDMX overexpression triggers progression of multiple chronic/asymptomatic preleukemic conditions to overt AML. Transcriptomic and proteomic studies revealed that MDMX overexpression exerts this function, unexpectedly, through activation of Wnt/β-Catenin signaling in pre-LSCs. Mechanistically, MDMX binds CK1α and leads to accumulation of β-Catenin in a p53-independent manner. Wnt/β-Catenin inhibitors reverse MDMX-induced pre-LSC properties, and synergize with MDMX-p53 inhibitors. Wnt/β-Catenin signaling correlates with MDMX expression in patients with preleukemic myelodysplastic syndromes and is associated with increased risk of progression to AML. Our work identifies MDMX overexpression as a pervasive preleukemic-to-AML transition mechanism in different genetically driven disease subtypes, and reveals Wnt/β-Catenin as a non-canonical MDMX-driven pathway with therapeutic potential for progression prevention and cancer interception.

Keywords: CK1α; MDMX; acute myeloid leukemia; cancer interception; myelodysplastic syndromes; precision prevention; preleukemia; preleukemic stem cells; targeted therapy; β-Catenin.


Conflict of interest statement

Declaration of interests L.A.C. is a past employee of Aileron Therapeutics. J.C. is currently an employee of Stelexis Therapeutics. ALRN-6924 was provided to U.S. from Aileron Therapeutics. U.S. has received research funding from GlaxoSmithKline, Bayer HealthCare, Aileron Therapeutics, and Novartis; has received compensation for consultancy services and for serving on scientific advisory boards from GlaxoSmithKline, Bayer Healthcare, Celgene, Aileron Therapeutics, Stelexis Therapeutics, and Pieris Pharmaceuticals; and has equity ownership in and is serving on the board of directors of Stelexis Therapeutics.

Figures

Figure 1.
Figure 1.. MDMX overexpression increases the number, proliferation, and competitiveness of HSCs.
(A) Upper: Representative flow cytometric plots of bone marrow LSK cells from a 3-month-old WT and Mdmx-Tg mouse. Lower: Ratio of Flk2low CD48low CD150high LT-HSC in LSK (%) are shown (n=6). (B) Upper: BrdU uptake in HSCs (Flk2 LSK) after 48 hours treatment with 1mg/ml BrdU in drinking water. Representative flow cytometric plots. Lower: Ratio of BrdU+ HSCs are shown (n=4). (C) Colony number from serial replating assays of 1×10⁴ bulk bone marrow (BM) cells (n=4). (D) 1.0×10⁶ WT or Mdmx-Tg BM cells (Ly45.2) and 1.0×10⁶ WT competitors (Ly45.1/2) were competitively transplanted into lethally irradiated recipients (Ly45.1). Graph shows ratio of donor cells (Ly45.2) at indicated time points (months) after transplantation for each lineage (n=10 for WT, 9 for Mdmx-Tg). # (A)-(D): statistical differences were calculated by T test. Data shown as Mean±SEM. *: 0.01≤P<0.05, **: 0.001≤P<0.01, ***: P<0.001, N.S.: not significant. See also Figure S1.
Figure 2.
Figure 2.. MDMX overexpression transforms PU.1 knockdown-induced pre-LSC.
(A) Schema of the bone marrow transplantation (BMT) assay. Bone marrow (BM) cells from 3-month-old (3M) URE−/−;Mdmx-Tg mice (preleukemic), 4-month-old (4M) URE−/− mice (preleukemic) or 4M URE−/−;Mdmx-Tg mice (leukemic) were transplanted into sublethally irradiated NSG mice. (B) Survival after BMT of 1×10⁶ BM cells from indicated mice into NSG recipients. (n=5 for URE−/− (4M), Mdmx-Tg, and URE−/−;Mdmx-Tg (3M), n=10 for URE−/−;Mdmx-Tg (4M)). Statistical significance was calculated by log rank test. **: 0.001≤P<0.01, ***: P<0.001. (C) Left: BM smears of BMT recipients. Right: BM blast counts of the recipients of URE−/− (4M) cells and moribund recipients of URE−/−;Mdmx-Tg (3M) cells. (D) Peripheral blood cell counts from 3M primary mice (n=17 for URE−/−, 11 for URE−/−;Mdmx-Tg). WBC; white blood cell, Neu; neutrophil, Hb; hemoglobin, PLT; platelet. (E) Total BM cell number from 3M primary mice. Cell numbers were counted from crushed tibia, femur, ileum, sternum and vertebrae (n=7 for URE−/−, 8 for URE−/−;Mdmx-Tg). (F) Representative picture of bone marrow cytospins of 3M primary mice. (G) Left: Ratio of cKit positive cells in non-lymphoid BM cells of 3M primary mice (n=5 for URE−/−, 4 for URE−/−;Mdmx-Tg). Right: Ratio of live lineage cKit+ cells (LK and LSK) in the BM. (H) Left: Representative image of spleens from 3M primary mice. The order of the genotypes is WT, URE−/−, URE−/−;Mdmx-Tg, URE−/−;Mdmx-Tg (moribund) from left to right. Right: Spleen weights of 3M primary mice (n=9 for URE−/−, 13 for URE−/−;Mdmx-Tg). # (C) (F) Arrowheads indicate blast cells. Scale bars: 40μm. # (C) (D) (E) (G) (H): Statistical significance was calculated by T test. Data shown as Mean±SEM. *: 0.01≤P<0.05, **: 0.001≤P<0.01, ***: P<0.001. See also Figure S2.
Figure 3.
Figure 3.. MDMX overexpression induces AML in the Tet2−/− MPN/MDS model and Tet2+/− clonal hematopoiesis model.
(A) Schema of the breeding strategy, resultant genotypes and phenotypes. (B) Survival of Tet2−/− and Tet2−/−;Mdmx-Tg mice (n=15 for Tet2−/−, 18 for Tet2−/−;Mdmx-Tg). **: 0.001≤P<0.01 by log-rank test. (C) Abdominal cavity of moribund Tet2−/−;Mdmx-Tg mouse and a Tet2−/− littermate reveals drastic hepatosplenomegaly in the Tet2−/−;Mdmx-Tg mouse. (D) Left: Bone marrow (BM) cytospins of a non-diseased Tet2−/− mouse at 12-months of age (12M), a moribund (MPN/MDS-like) Tet2−/− mouse at 18-months of age (18M), and a moribund (AML) Tet2−/−;Mdmx-Tg mouse at 12M. Right: percentage of blasts in the BM cells of moribund Tet2−/−;Mdmx-Tg and Tet2−/− mice. Bars indicate Mean±SEM. *: 0.01≤P<0.05 by T test. (E) Flow cytometric analysis of BM/spleen cells of a non-diseased Tet2−/− mouse (12M), a moribund (MPN/MDS-like) Tet2−/− mouse (18M), and a moribund (AML) Tet2−/−;Mdmx-Tg mouse (12M). (F) Abdominal cavity of a moribund Tet2+/−;Mdmx-Tg mouse and its littermate (Tet2+/−). (G) BM cytospins of a moribund (AML) Tet2+/−;Mdmx-Tg mouse (15-month-old; 15M) and a Tet2+/− littermate. (H) Flow cytometric analysis of BM and spleen cells of a moribund Tet2+/−;Mdmx-Tg mouse and a Tet2+/− littermate. # (D) (G) Arrows indicate morphological blasts. Scale bars: 40μm.
Figure 4.
Figure 4.. MDMX overexpression induces AML in the context of asymptomatic heterozygous Flt3 mutations.
(A) Schema of the breeding strategy of Flt3WT/ITD;Mdmx-Tg mice. (B) Survival of FLT3WT/ITD and Flt3WT/ITD;Mdmx-Tg mice (n=7 for FLT3WT/ITD, 12 for Flt3WT/ITD;Mdmx-Tg). **: 0.001≤P<0.01 by log-rank test. (C) Left: Peripheral blood counts of moribund (Mo) mice and 16-month-old non-diseased (ND) mice. (n=6 for FLT3WT/ITD (ND), 8 for Flt3WT/ITD;Mdmx-Tg (ND), 5 for Flt3WT/ITD;Mdmx-Tg (Mo)). Statistics were calculated by Tukey HSD test. Data shown as Mean±SEM. *: 0.01≤P<0.05, **: 0.001≤P<0.01, ***: P<0.001, N.S.: not significant. Right: Representative blasts in peripheral blood. (D) Left: Bone marrow cytospins from Mo or age-matched ND mice. Scale bars: 40μm. Arrowheads indicate blast cells. Right: Percentage of blasts among nuclear cells (n=2, 2, 3 respectively). Statistics were calculated by Tukey HSD test. Data shown as Mean±SEM. *: 0.01≤P<0.05. (E) Representative flow cytometric analysis of bone marrow of Mo mice and 16-month-old ND mice. See also Figures S3–S5.
Figure 5.
Figure 5.. MDMX overexpression leads to upregulation of Wnt/β-Catenin signaling in pre-LSC, an effect that is mediated by physical interaction of MDMX with CK1α.
(A) RNA sequencing data of WT and Mdmx-Tg HSCs analyzed by Gene set enrichment analysis (GSEA) for p53 targets. (n=3) (B) Canonical pathways representing the top 10 Z-scores by Ingenuity Pathway Analysis (IPA) of the RNA sequencing data. (C) RNA sequencing data of WT and Mdmx-Tg HSCs were analyzed by GSEA for oncogenic β-Catenin signature. (D) RNA sequencing of pre-LSCs from URE−/− and URE−/−;Mdmx-Tg was performed (n=3), including GSEA analysis of p53 targets and apoptosis. (E) GSEA analysis for β-Catenin oncogenic signature and hallmark Wnt/β-Catenin signaling for URE−/− and URE−/−;Mdmx-Tg. (F) Left: Protein expression of β-Catenin (green) by immunofluorescence (IF) staining with DAPI (blue) counterstain in HSCs of WT and Mdmx-Tg mice. Representative pictures are shown (scale bars: 1.85μm). Center: Signal of total cell staining of β-Catenin. Right: Nuclear signal of β-Catenin with DAPI counterstain. Statistics were calculated by T test. ***: P<0.001. (G) Schema of experimental strategy to detect MDMX interacting proteins. (H) Whole cell lysate (WCL), cytoplasmic and nuclear proteins were extracted from 32D cells transduced with HA-tagged Mdmx or Empty control lentivirus. Immunoprecipitation (IP) with anti-HA beads was performed for WCL. Samples were blotted for indicated antibodies. Molecular weight (kDa) was indicated in the figure. (I) Relative expression of Ctnnb1 RNA in 32D cells transduced with Mdmx or Empty control lentivirus (n=3). Statistical significance was calculated by T test. N.S.: not significant. Data shown as Mean±SEM. See also Figure S6 and Tables S1–S3.
Figure 6.
Figure 6.. Wnt/β-Catenin inhibition or elevation of CK1α levels rescue MDMX-overexpression-induced functional properties of pre-LSC.
(A) IC50 determination in colony formation assays of 1000 WT or Mdmx-Tg HSCs with indicated concentration of Wnt/β-Catenin inhibitors (n=2). (B) Colony numbers from 5000 WT or Mdmx-Tg cKit+ bone marrow cells transduced with Csnk1a1 (CK1α) or empty vector (Emp) (n=2). Cells were serially replated for 3 times. (C) Colony number from 10000 URE−/− or URE−/−;Mdmx-Tg pre-LSCs with indicated concentration of Wnt/β-Catenin inhibitors (n=2). (D) Colony number from 5000 URE−/− or URE−/−;Mdmx-Tg lineage- cKit+ bone marrow (BM) cells transformed with Csnk1a1 (CK1α) or empty (Epm) vector (n=2). Cells were serially replated for 3 times. (E) IC50 assays of lineage cKit+ BM cells from WT, URE−/− and URE−/−;Mdmx-Tg preleukemic mice cultured with the indicated concentrations of PNU74654, ALRN-6924, or both, for 24hours. # (A) (C): Statistical significance was calculated by T test for each drug concentration. Data shown as Mean±SEM. *: 0.01≤P<0.05, **: 0.001≤P<0.01, ***: P<0.001. NR: not reached. # (B) (D): Statistical significance was calculated by Tukey HSD test. Data shown as Mean±SEM. *: 0.01≤P<0.05, **: 0.001≤P<0.01, ***: P<0.001. See also Figure S7, S8.
Figure 7.
Figure 7.. MDMX-driven HSC expansion and Wnt/β-Catenin upregulation is p53 independent.
(A) Mdmx relative transcript expression in HSCs (Flk2- LSK) (n=3). (B) Colony formation assay from 1×10⁴ Trp53−/− or Trp53−/−;Mdmx-Tg bone marrow cells. (n=2). (C) 0.5×10⁶ Trp53−/− or Trp53−/−;Mdmx-Tg bone marrow cells (Ly45.2) with 2.0×10⁶ WT competitors (Ly45.1/2) were competitively transplanted into lethally irradiated recipients (Ly45.1). Ratio of donor cells (Ly45.2) at each time point (months) from transplantation (n=7) and ratio of donor cells (Ly45.2) in the LSK population at 4 months after transplantation (n=7). (D) Immunofluorescence (IF) staining of β-Catenin (green) with DAPI (blue) in HSC of Trp53−/− and Trp53−/−;Mdmx-Tg mice. Top; Representative pictures (Scale bars; 1.85μm). Bottom; Left: Signal of total cell staining of β-Catenin. Right: Nuclear signal of β-Catenin with DAPI counterstain. (E) Relative transcript levels of the β-Catenin target genes Ccnd1 and c-Myc. (F) Colony number from 1000 Trp53−/− or Trp53−/−;Mdmx-Tg HSCs with indicated concentration of Wnt/β-Catenin inhibitor PNU74654 (n=2). NR: not reached. (G) Relative expression of CTNNB1 (β-Catenin) RNA in HL-60 cells transduced with MDMX or Empty control lentivirus (n=3). (H) Whole cell lysate (WCL), cytoplasmic and nuclear extracts from HL-60 cells transduced by FLAG-tagged MDMX (MDMX) or Empty control lentivirus (Empty). Immunoprecipitation (IP) for WCL by anti-FLAG beads was performed. WCL, IP, cytoplasmic and nuclear extract were blotted by indicated antibodies. Molecular weight (KDa) is indicated in the figure. # (A)-(G): statistical significance was calculated by T test. Data shown as Mean±SEM. N.S.: not significant. *: 0.01≤P<0.05, **: 0.001≤P<0.01, ***: P<0.001.
Figure 8.
Figure 8.. Clinical-correlative data indicate relevance of the MDMX-Wnt/β-Catenin axis in patients with MDS.
Analyses of GSE19429. (A) Gene set enrichment analysis (GSEA) of MDMX high versus low patients reveals highly significant enrichment of Wnt/β-Catenin signature. N.S.; not significant. (B) Mutation status of clonal hematopoiesis related genes between MDMX low and high patients. P values were calculated by Fisher exact test. N.S.; not significant. (C) Disease subtype, sex and age between MDMX low and high patients. P values were calculated by Fisher exact test for subtype and sex, and Welch’s test for age. (D) Cumulative incidence plots of transformation to AML and non-leukemic death treating each other as competing risk (MDMX low versus high, all cases), (E) patients with RAEB subtype, and (F) patients with MDS subtypes other than RAEB. P values were calculated by Gray’s test. (G) Cumulative incidence plots of transformation to AML treating non-leukemic death as competing risk (MDMX high, WNT score high versus all other cases) (Left: all patients, right: patients with RAEB subtype). P values were calculated by Gray’s test. See also Figure S8.

References

    1. Bacher U, Haferlach T, Schoch C, Kern W. & Schnittger S. (2006). Implications of NRAS mutations in AML: a study of 2502 patients. Blood. 107, 3847–3853. - PubMed
    1. Bereshchenko O, Mancini E, Moore S, Bilbao D, Mansson R, Luc S, Grover A, Jacobsen SE, Bryder D. & Nerlov C. (2009). Hematopoietic stem cell expansion precedes the generation of committed myeloid leukemia-initiating cells in C/EBPalpha mutant AML. Cancer Cell. 16, 390–400. - PubMed
    1. Bhagat TD, Chen S, Bartenstein M, Barlowe AT, Von Ahrens D, Choudhary GS, Tivnan P, Amin E, Marcondes AM, Sanders MA, et al. (2017). Epigenetically Aberrant Stroma in MDS Propagates Disease via Wnt/beta-Catenin Activation. Cancer Res. 77, 4846–4857. - PMC - PubMed
    1. Busque L, Patel JP, Figueroa ME, Vasanthakumar A, Provost S, Hamilou Z, Mollica L, Li J, Viale A, Heguy A, et al. (2012). Recurrent somatic TET2 mutations in normal elderly individuals with clonal hematopoiesis. Nat Genet. 44, 1179–1181. - PMC - PubMed
    1. Cancer Genome Atlas Research, N., Ley TJ, Miller C, Ding L, Raphael BJ, Mungall AJ, Robertson A, Hoadley K, Triche TJ Jr., Laird PW, et al. (2013). Genomic and epigenomic landscapes of adult de novo acute myeloid leukemia. N Engl J Med. 368, 2059–2074. - PMC - PubMed

Publication types

MeSH terms