. 2021 Apr 12;39(4):548-565.e6.
doi: 10.1016/j.ccell.2021.02.007. Epub 2021 Mar 4.

Type I collagen deletion in αSMA+ myofibroblasts augments immune suppression and accelerates progression of pancreatic cancer

Affiliations

Type I collagen deletion in αSMA+ myofibroblasts augments immune suppression and accelerates progression of pancreatic cancer

Yang Chen et al. Cancer Cell. .

Abstract

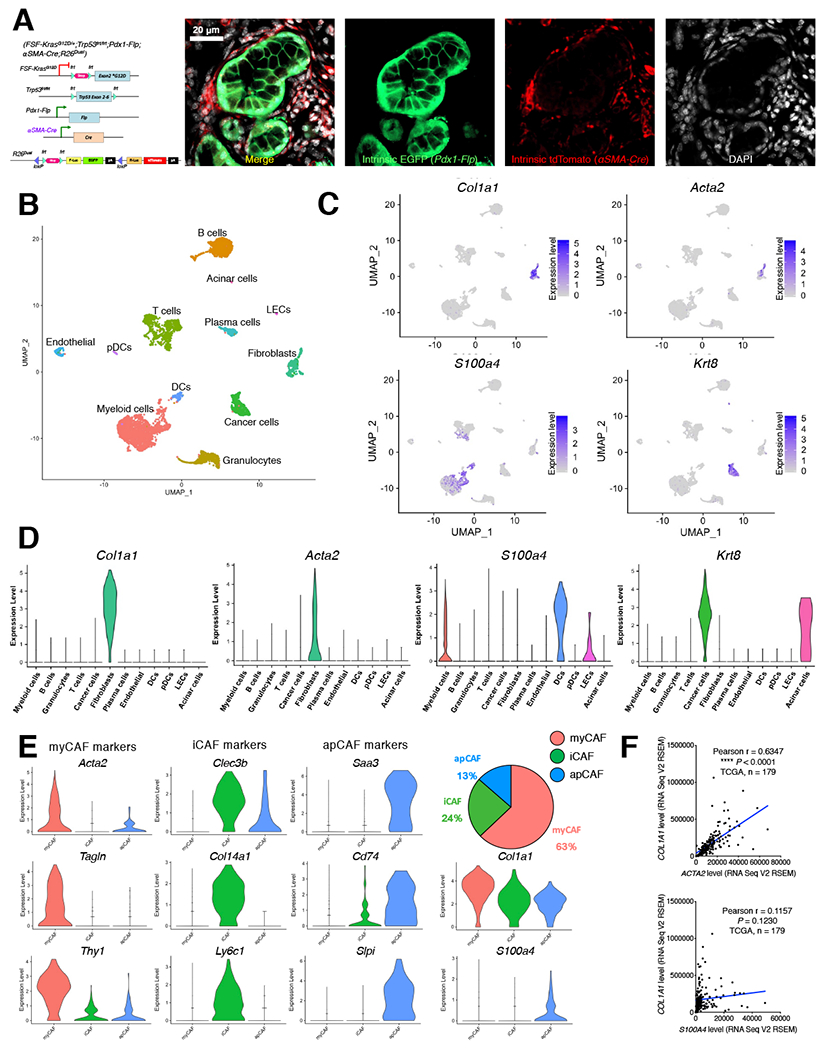
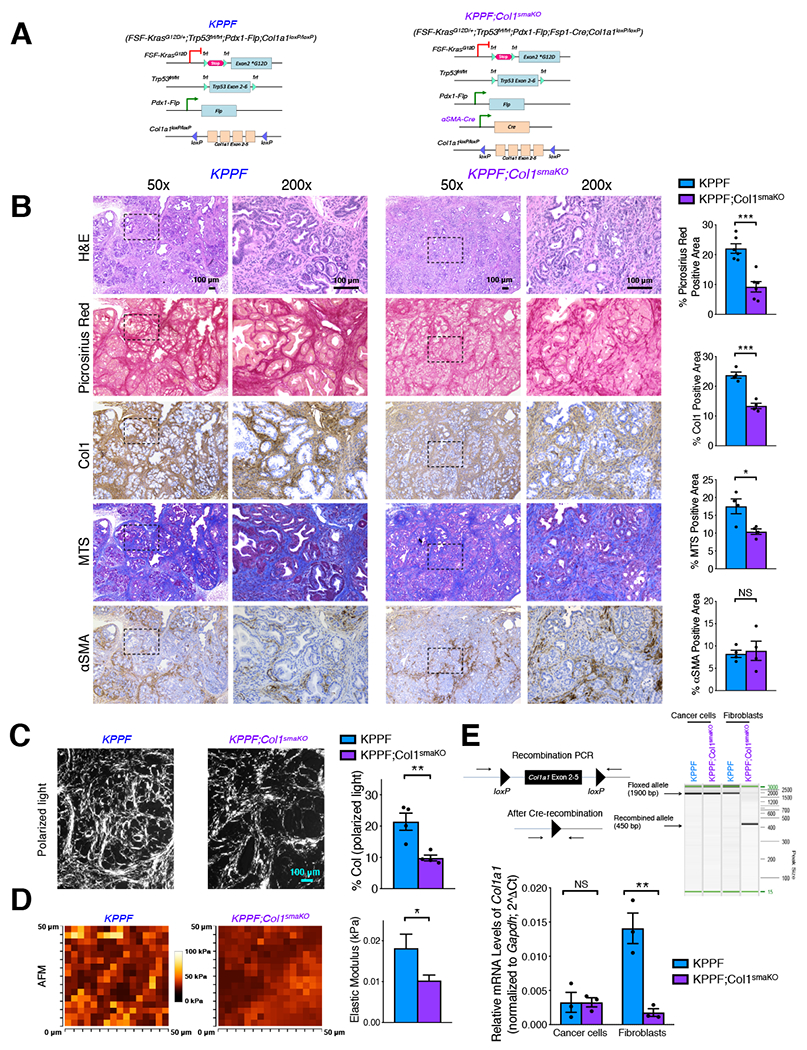
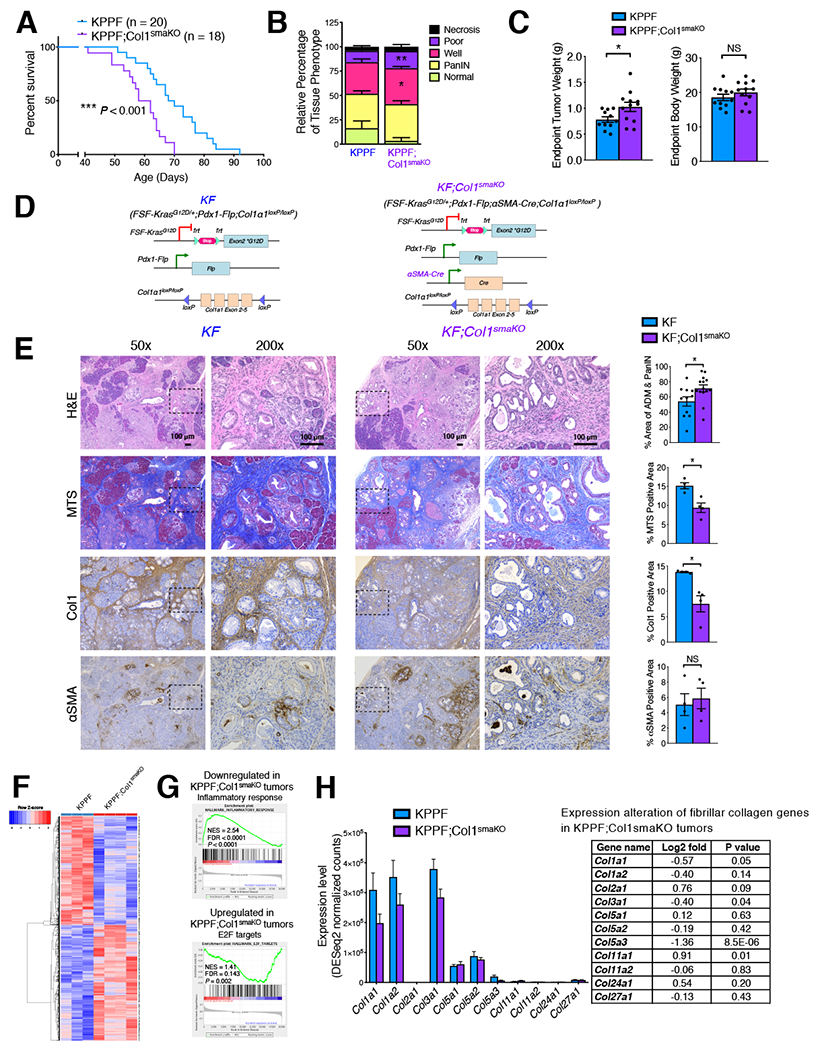
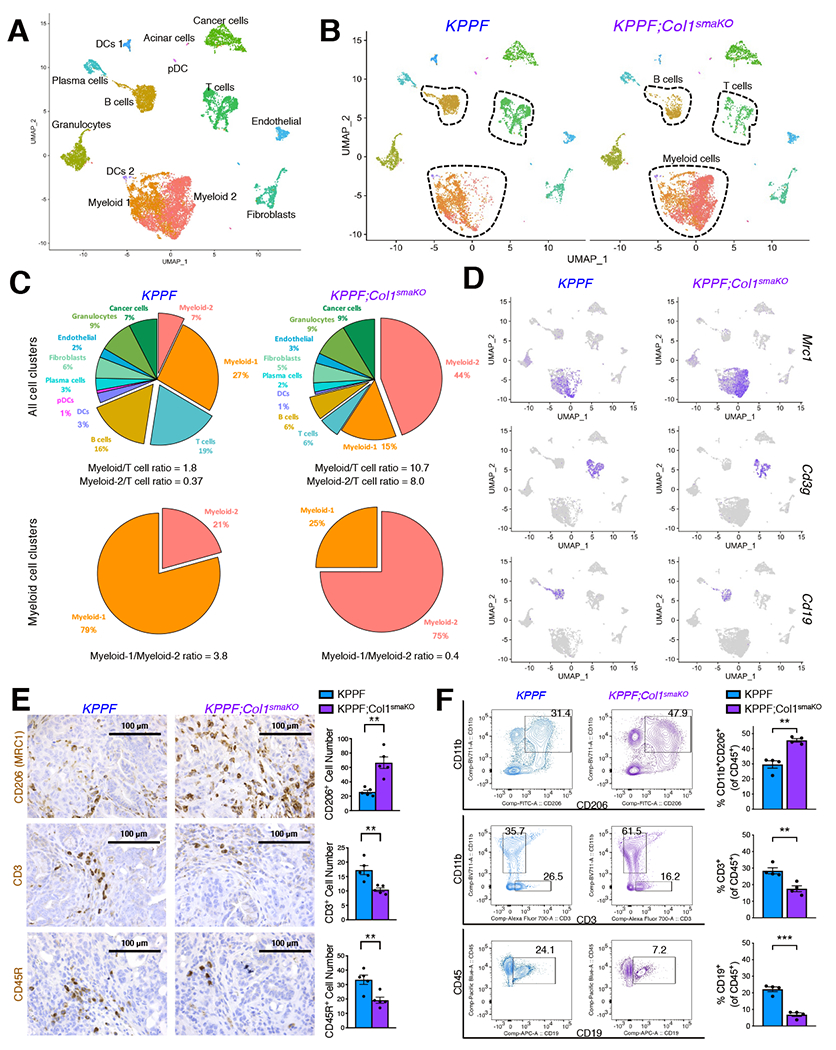
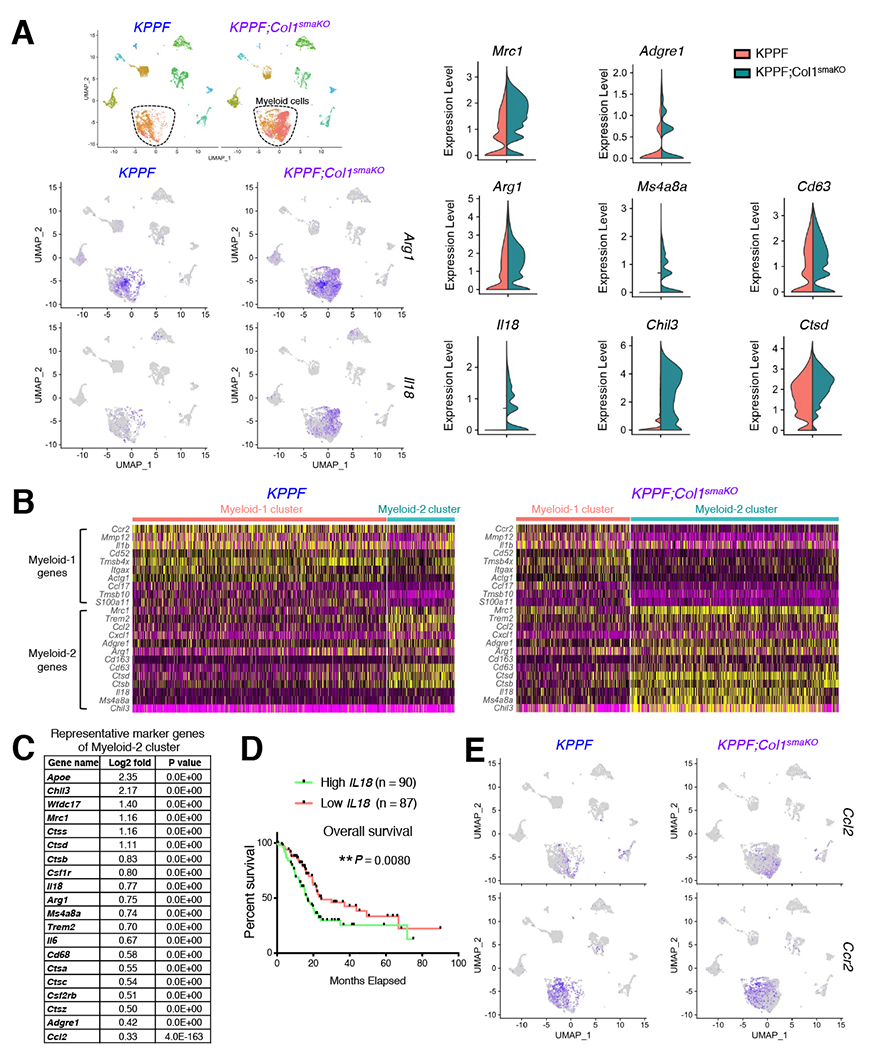
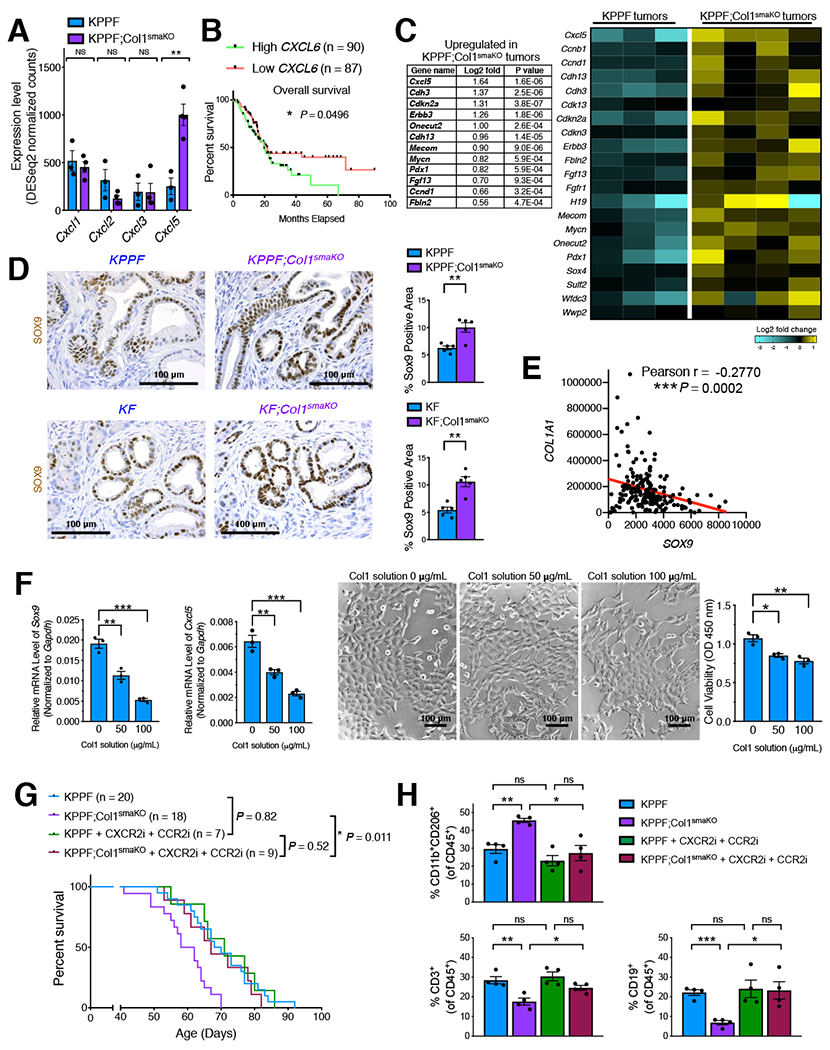
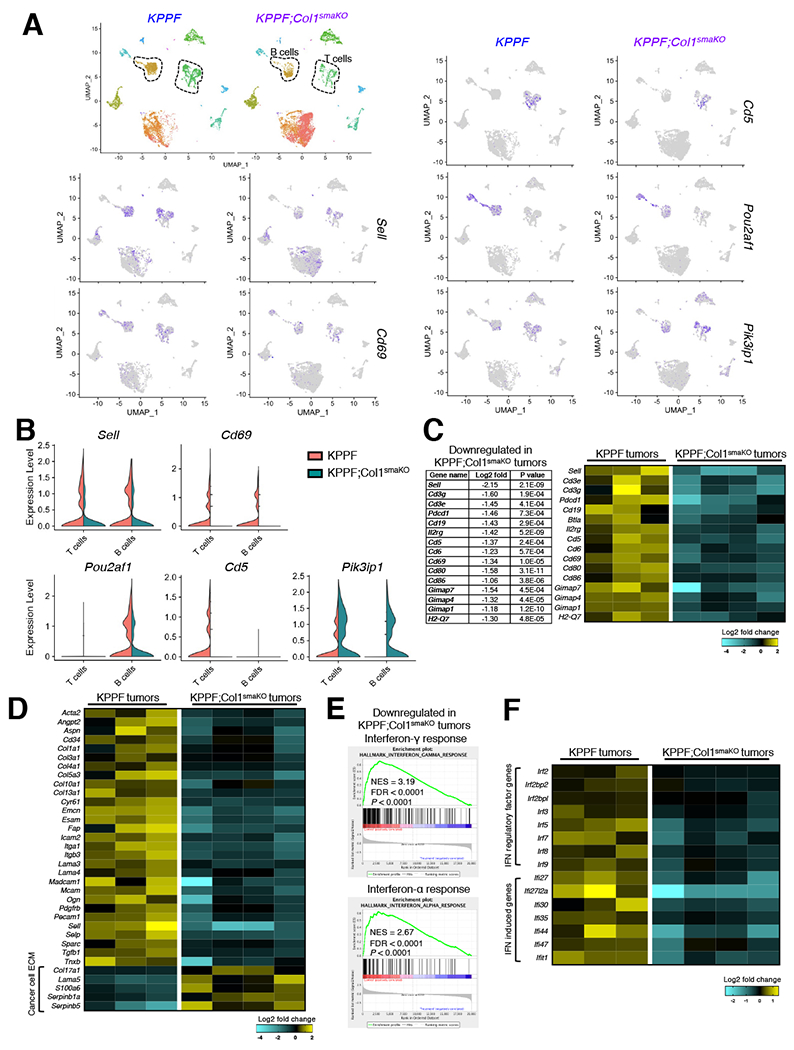
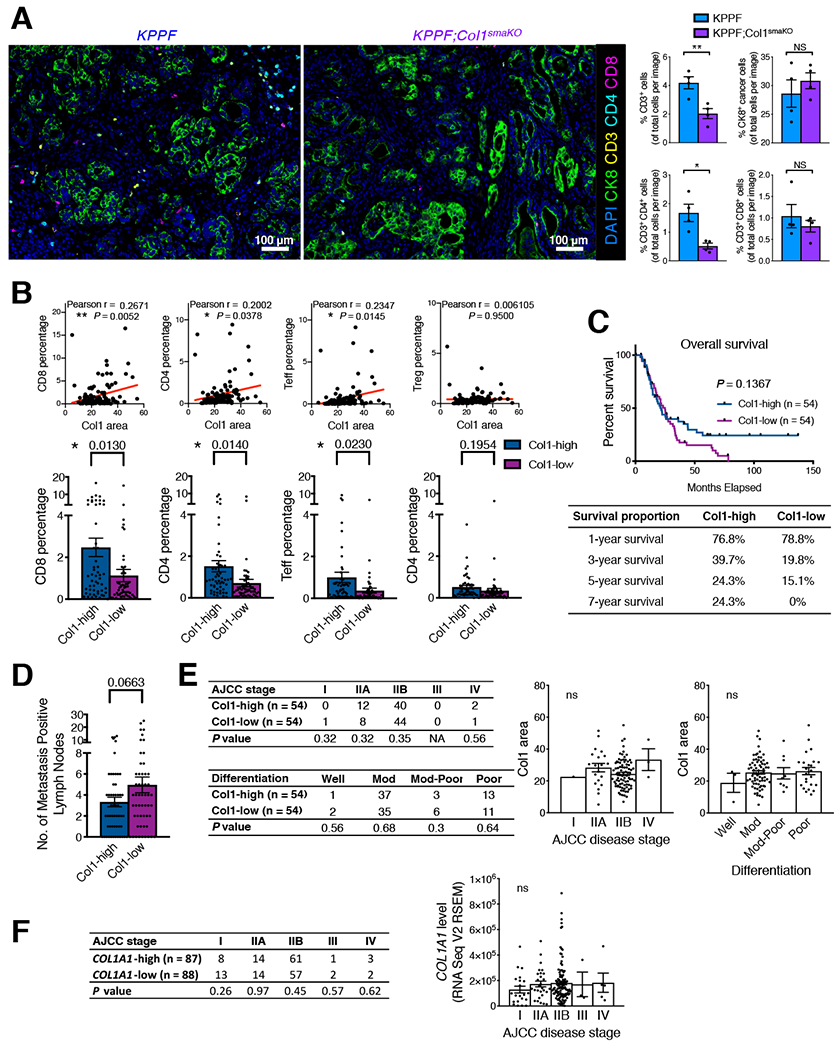
Stromal desmoplastic reaction in pancreatic ductal adenocarcinoma (PDAC) involves significant accumulation of type I collagen (Col1). However, the precise molecular and mechanistic contribution of Col1 in PDAC progression remains unknown. Activated pancreatic stellate cells/αSMA+ myofibroblasts are major contributors of Col1 in the PDAC stroma. We use a dual-recombinase genetic mouse model of spontaneous PDAC to delete Col1 specifically in myofibroblasts. This results in significant reduction of total stromal Col1 content and accelerates the emergence of PanINs and PDAC, decreasing overall survival. Col1 deletion leads to Cxcl5 upregulation in cancer cells via SOX9. Increase in Cxcl5 is associated with recruitment of myeloid-derived suppressor cells and suppression of CD8+ T cells, which can be attenuated with combined targeting of CXCR2 and CCR2 to restrain accelerated PDAC progression in the setting of stromal Col1 deletion. Our results unravel the fundamental role of myofibroblast-derived Co1l in regulating tumor immunity and restraining PDAC progression.

Keywords: B cells; T cells; extracellular matrix; fibroblasts; genetically engineered mouse models; myeloid-derived suppressor cells (MDSCs); pancreatic ductal adenocarcinoma (PDAC); tumor immunology; tumor microenvironment; type I collagen.


Conflict of interest statement

Declaration of interests The authors declare no conflict of interest.

Figures

Figure 1.
Figure 1.. Single-cell RNA-sequencing (sc-RNA-seq) identifies fibroblasts as the predominant producers of type I collagen in KPPF mice with PDAC
(A) Genetic strategy for KPPF;αSMA-Cre;R26Dual mice, with representative images of primary tumor cryosections shown for intrinsic EGFP (in cancer cells) and tdTomato (in αSMA-lineage myofibroblasts) signals due to R26Dual tracer. Scale bar: 20 αm. (B-D) sc-RNA-seq analysis of unfractionated live cell mixture from pancreatic tumors of KPPF mice (B). Expression profile of Col1a1, Acta2, S100a4, and Krt8 was shown in UMAP plot (C) and violin plot (D) with normalized expression levels of indicated genes. DCs, dendritic cells; pDCs, plasmacytoid dendritic cells; LECs, lymphatic endothelial cells. (E) The cancer-associated fibroblast (CAF) cluster was classified into indicated subpopulations: myofibroblast (myCAF), inflammatory fibroblast (iCAF), and antigen-presenting fibroblast (apCAF). Violin plots are shown with normalized expression levels of indicated genes. (F) The correlation between the gene expression levels of COL1A1 and ACTA2 (or S100A4) in TCGA PDAC patients (n = 179). Pearson’s correlation test was used. See also Figure S1; Tables S1–S3.
Figure 2.
Figure 2.. Specific deletion of Col1 in αSMA+ myofibroblasts decreases Col1 protein in autochthonous model of PDAC
(A) Genetic strategy to delete type I collagen α1 chain (Col1a1) specifically in αSMA+ cell population in the context of pancreatic cancer using the KPPF;Col1smaKO mice. KPPF littermates served as control mice. (B) Serial sections of pancreatic tumors from age-matching KPPF and KPPF;Col1smaKO mice, stained with H&E, Picrosirius Red, Col1, Masson’s trichrome stain (MTS), and αSMA. Quantification of % positive area was based on at least 4 mice/group. Scale bar: 100 μm. (C) Representative circularly polarized light microscopy images of KPPF and KPPF;Col1smaKO tumor sections stained with Pircrosirius Red (n = 4/group). Scale bar: 100 μm. (D) Representative atomic force microscopic (AFM) images of cryosections of KPPF and KPPF;Col1smaKO tumors (n = 3/group). (E) Primary cancer cells and fibroblasts were sorted from KPPF or KPPF;Col1smaKO tumors. PCR product detection confirmed the specific deletion of Col1a1 in fibroblasts sorted from KPPF;Col1smaKO mice. The expression level of Col1a1 was examined by qRT-PCR. Data are represented as mean ± SEM. * P < 0.05, *** P < 0.001, **** P < 0.0001, NS: not significant, Student’s t test was used. See also Figure S2.
Figure 3.
Figure 3.. Genetic deletion of Col1 in αSMA+ myofibroblasts accelerates PDAC progression with decreased survival
(A) Survival of KPPF (n = 20) and KPPF;Col1smaKO (n = 18) mice. Log-rank (Mantel-Cox) test was used. (B) Histology evaluation of tumors from age-matching KPPF and KPPF;Col1smaKO mice (n = 5/group) by scoring H&E-stained tumors: normal (non-neoplastic), PanIN, well-differentiated PDAC (Well), poorly-differentiated PDAC (Poor), or necrosis. (C) Endpoint tumor weight and body weight of KPPF mice and KPPF;Col1smaKO mice. (D) Genetic strategy to delete Col1a1 specifically in αSMA-expressing cell population in the KF;Col1smaKO mice. KF littermates served as control mice. (E) Serial sections of pancreas of KF or KF;Col1smaKO (age-matched 6-month-old) mice were stained. Percentage of ADM/PanIN lesion areas was based on H&E sections from 11 KF mice and 14 KF;Col1smaKO mice. Quantification of other staining was based on n = 4/group. Scale bar: 100 μm. (F-H) Bulk RNA-seq analysis on KPPF tumors (n = 3) and KPPF;Col1smaKO tumors (n = 4). Heat map of differentially expressed genes between KPPF and KPPF;Col1smaKO tumors was shown in (F). Gene set enrichment analysis (GSEA) revealed significantly downregulated and upregulated pathways in KPPF;Col1smaKO tumors, as compared to KPPF tumors (G). NES, normalized enrichment score. FDR, false discovery rate (q value). Expression levels of genes encoding fibrillar collagens were shown in (H), with Log2-fold change and P values (Wald Test) listed. Data are represented as mean ± SEM. * P < 0.05, ** P < 0.01, *** P < 0.001, NS: not significant. Student’s t test was used unless otherwise indicated. See also Figures S2 and S3; Table S4.
Figure 4.
Figure 4.. Col1 deletion in αSMA+ myofibroblasts impacts immune response in PDAC
(A-D) sc-RNA-seq analysis of unfractionated live cell mixture from pancreatic tumors of KPPF and KPPF;Col1smaKO mice. Functional clusters of cells were shown in (A). The distribution of defined cell clusters comparing KPPF tumors and KPPF;Col1smaKO tumors was shown in UMAP plots (B) and pie chart plots (C). (D) Normalized expression levels of marker genes of Myeloid-2/MDSCs, T cells, and B cells within KPPF and KPPF;Col1smaKO tumors shown in UMAP plot. (E) Representative immunohistochemistry staining images and quantification of CD206 (MRC1) for MDSCs, CD3 for T cells, and CD45R for B cells on KPPF and KPPF;Col1smaKO tumors (n = 5/group). Scale bar: 100 μm. (F) The percentages of CD11b+CD206+ myeloid cells, CD3+ T cells, and CD19+ B cells among CD45+ immune cells in KPPF and KPPF;Col1smaKO tumors (n = 4/group), as examined by flow cytometry. Data are represented as mean ± SEM. * P < 0.05, ** P < 0.01, *** P < 0.001, Student’s t test was used. See also Figures S4–S7; Tables S5 and S6.
Figure 5.
Figure 5.. Col1 deletion increases CD206+F4/80+Arg1+ MDSCs (Myeloid-2 cluster)
(A-C) Differentially expressed genes related to Myeloid-2/MDSC function between KPPF and KPPF;Col1smaKO tumors shown in UMAP plot and violin plot showing the normalized expression levels of indicated genes (A). Heat maps of signature genes of Myeloid-1 and Myeloid-2 clusters, comparing KPPF and KPPF;Col1smaKO tumors, were shown in (B). Representative upregulated genes in Myeloid-2 cluster were listed in (C). (D) Overall survival of TCGA PDAC patients correlated with IL18 expression level. Log-rank (Mantel-Cox) test was used. (E) Normalized expression levels of Ccl2 and Ccr2 genes in KPPF and KPPF;Col1smaKO tumors shown in UMAP plot. See also Figure S7; Table S6.
Figure 6.
Figure 6.. Col1 deletion alters chemokine release by cancer cells and promotes MDSC recruitment
(A) Expression levels of genes encoding indicated chemokines related to myeloid cell recruitment, based on bulk RNA-seq data of KPPF and KPPF;Col1smaKO tumors. (B) Overall survival of TCGA PDAC patients correlated with CXCL6 (the human homolog of mouse Cxcl5) expression level. Log-rank (Mantel-Cox) test was used. (C) Heat map of SOX9-regulated genes, including Cxcl5, based on RNA-seq of KPPF and KPPF;Col1smaKO tumors. Expression alterations of these genes were also shown with Log2-fold change and P values (Wald Test). (D) Representative images of SOX9 immunohistochemistry staining and positivity quantification in KPPF and KPPF;Col1smaKO tumors, or KF and KF;Col1smaKO tumors (n = 5/group). Scale bar: 100 μm. (E) Correlation between the gene expression levels of COL1A1 and SOX9 in TCGA PDAC patients (n = 179). Pearson’s correlation test was used. (F) The expression levels of Sox9 and Cxcl5 examined by qRT-PCR in primary KPPF;Col1smaKO cancer cells treated with purified Col1 (n = 3 biological replicates). Cancer cell morphology and proliferation were also shown. (G) Survival of KPPF (n = 7) and KPPF;Col1smaKO (n = 9) mice treated with CXCR2 inhibitor SB-225002 and CCR2 inhibitor RS-504393, as compared to the survival of untreated KPPF (n = 20) and KPPF;Col1smaKO (n = 18) mice from Figure 3A. Log-rank (Mantel-Cox) test was used. (H) The percentages of CD11b+CD206+ myeloid cells, CD3+ T cells, and CD19+ B cells among CD45+ immune cells in KPPF and KPPF;Col1smaKO tumors (n = 4/group) after CXCR2 inhibitor and CCR2 inhibitor treatment, as compared to untreated KPPF and KPPF;Col1smaKO tumors from Figure 4F. Data are represented as mean ± SEM. * P < 0.05, ** P < 0.01, *** P < 0.001, Student’s t test was used unless otherwise indicated. See also Figure S7.
Figure 7.
Figure 7.. Col1 deletion inhibits T and B lymphocytes in PDAC
(A and B) Differentially expressed T/B lymphocyte related genes between KPPF and KPPF;Col1smaKO tumors shown in UMAP plot (A) and violin plot (B) showing the normalized expression levels of indicated genes. (C) Significantly downregulated signature genes related to T cells and B cells in KPPF;Col1smaKO tumors, based on bulk RNA-seq data of KPPF and KPPF;Col1smaKO tumors, were shown in heat map or listed with Log2-fold change and P values (Wald Test). (D) Heat map of genes encoding extracellular matrix (ECM) components based on RNA-seq of KPPF and KPPF;Col1smaKO tumors. (E) GSEA revealing significantly downregulated interferon-γ/α response pathways in KPPF;Col1smaKO tumors compared to KPPF tumors. NES, normalized enrichment score. FDR, false discovery rate (q value). (F) Heat map of interferon (IFN) regulatory factor genes and IFN-induced genes based on RNA-seq of KPPF and KPPF;Col1smaKO tumors. See also Figure S8.
Figure 8.
Figure 8.. Lower Col1 level correlates with less T cells in mouse and human PDAC.
(A) CD3+, CD4+, and CD8+ T cell quantification from multispectral imaging of multiplex stained tumor sections of KPPF and KPPF;Col1smaKO mice (n = 4/group). Scale bar: 100 μm. (B) The correlation between stromal Col1 level and T cell recruitment in human PDAC samples (n = 108) examined by TSA multispectral imaging. The correlation between Col1 level and the percentages of indicated T cell subpopulations was based on Pearson’s correlation test. The patient cohort was also stratified into Col1-high and Col1-low groups and compared for the presence of T cell subpopulations. (C and D) The overall survival (C, with survival proportion compared at indicated time intervals, log-rank Mantel-Cox test) and the number of lymph nodes positive for metastases (D) were compared between Col1-high group and Col1-low patient group. (E) The case distribution by AJCC tumor stage and tumor differentiation status among Col1-high and Col1-low patient groups. P values were using Chi-square test. The average Col1 area levels of various groups classified by either tumor stage or tumor differentiation status were also shown. Well: well differentiated. Mod: moderately differentiated. Mod-Poor: moderately-to-poorly differentiated. Poor: poorly differentiated. (F) The case distribution by AJCC tumor stage among COL1A1-high and COL1A1-low groups of TCGA PDAC cohort. P values were calculated by Chi-square test. The average COL1A1 expression levels of various groups classified by tumor stage were also shown. Data are represented as mean ± SEM. * P < 0.05, ** P < 0.01, NS: not significant, Student’s t test was used unless otherwise indicated. See also Figure S8; Table S7.

Comment in

Similar articles

Cited by

References

    1. Allen JL, Cooke ME, and Alliston T (2012). ECM stiffness primes the TGFbeta pathway to promote chondrocyte differentiation. Mol Biol Cell 23, 3731–3742 - PMC - PubMed
    1. Anders S, and Huber W (2010). Differential expression analysis for sequence count data. Genome Biol 11, R106. - PMC - PubMed
    1. Apte MV, Haber PS, Applegate TL, Norton ID, McCaughan GW, Korsten MA, Pirola RC, and Wilson JS (1998). Periacinar stellate shaped cells in rat pancreas: identification, isolation, and culture. Gut 43, 128–133. - PMC - PubMed
    1. Apte MV, Haber PS, Darby SJ, Rodgers SC, McCaughan GW, Korsten MA, Pirola RC, and Wilson JS (1999). Pancreatic stellate cells are activated by proinflammatory cytokines: implications for pancreatic fibrogenesis. Gut 44, 534–541. - PMC - PubMed
    1. Apte MV, Pirola RC, and Wilson JS (2012). Pancreatic stellate cells: a starring role in normal and diseased pancreas. Front Physiol 3, 344. - PMC - PubMed

Publication types

MeSH terms

Substances