. 2021 Feb 24;13(5):936.
doi: 10.3390/cancers13050936.

Unexpected Benefits of Multiport Synchrotron Microbeam Radiation Therapy for Brain Tumors

Affiliations

Unexpected Benefits of Multiport Synchrotron Microbeam Radiation Therapy for Brain Tumors

Laura Eling et al. Cancers (Basel). .

Abstract

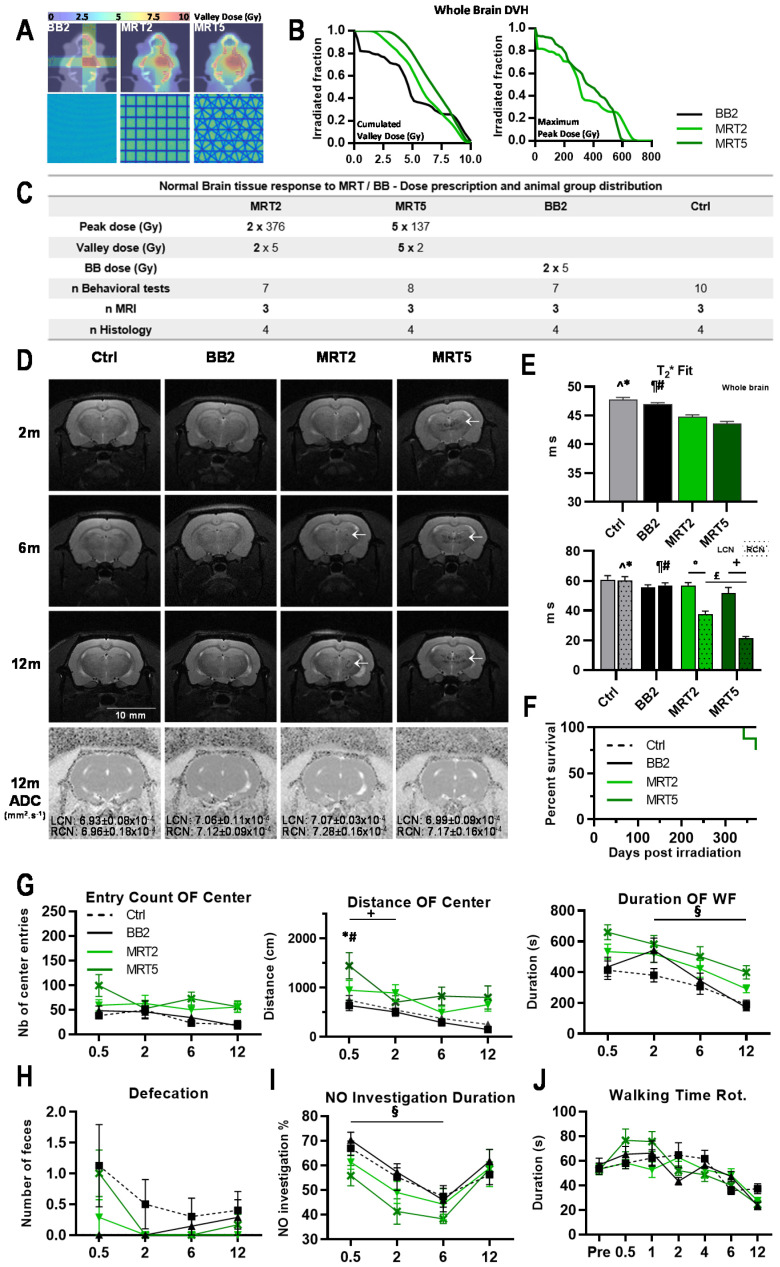
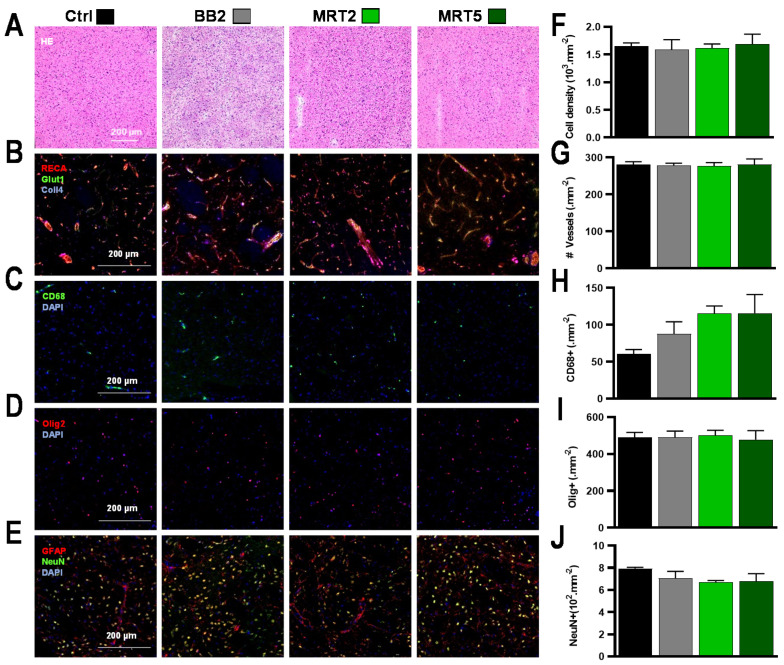
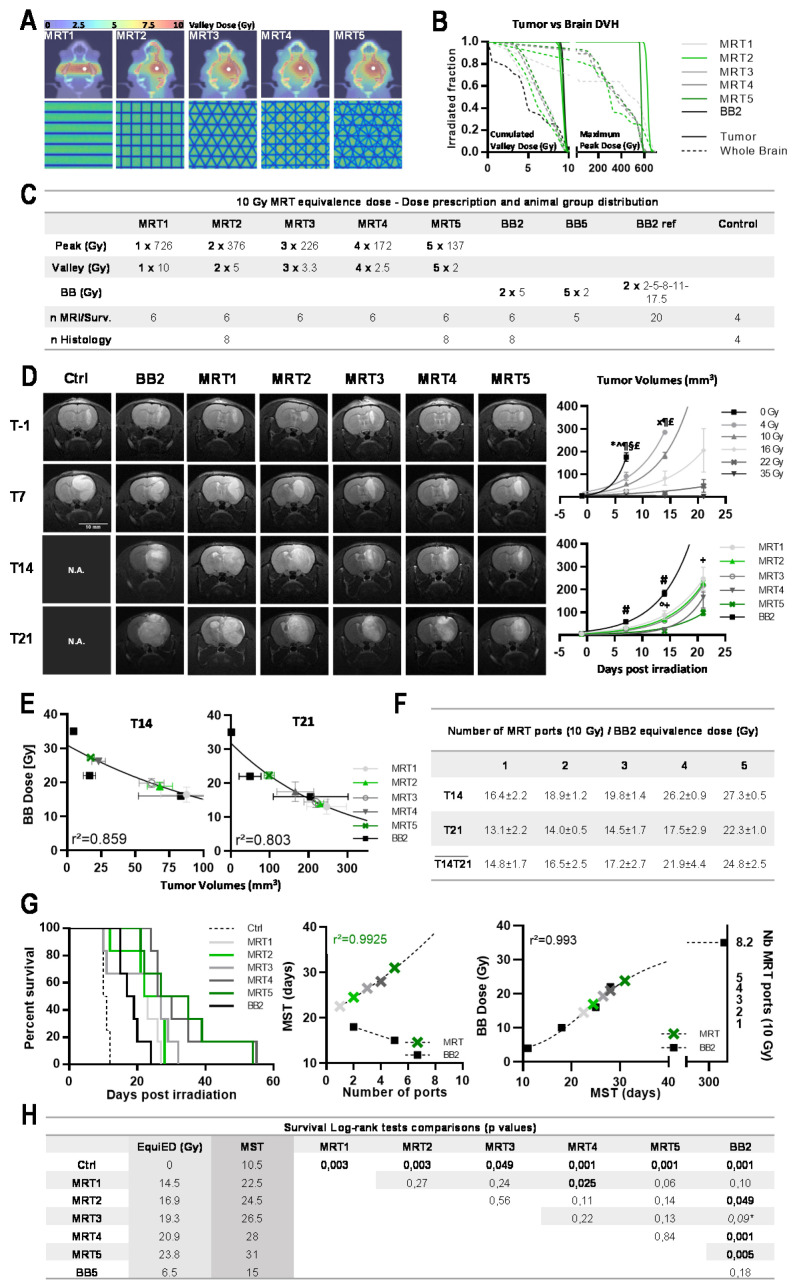
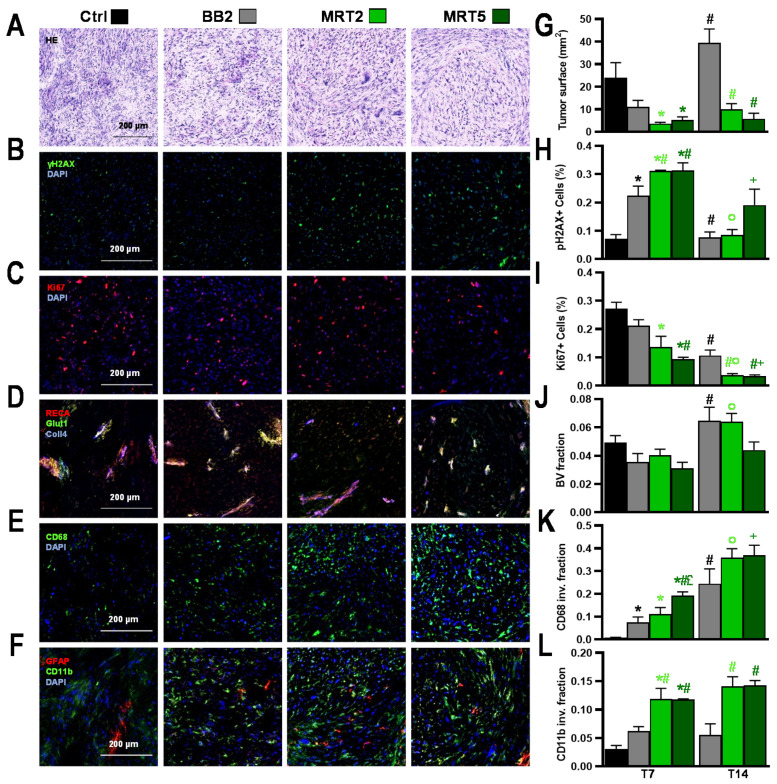
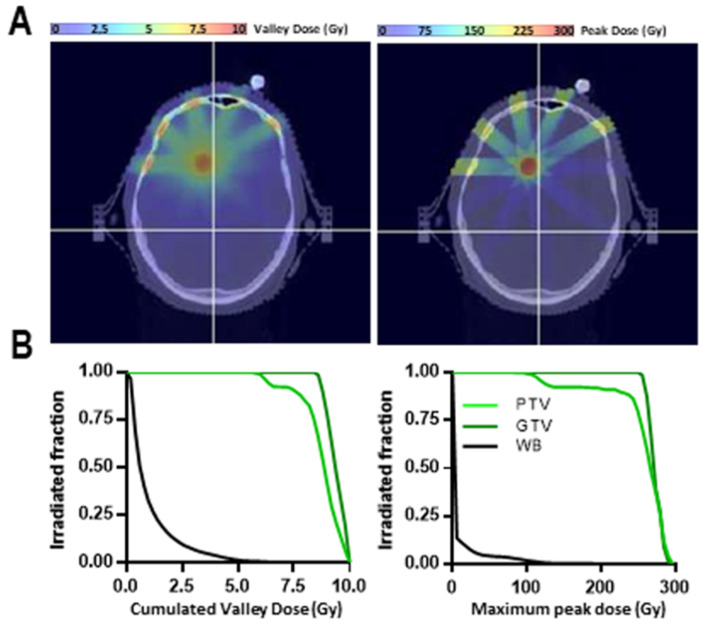
Delivery of high-radiation doses to brain tumors via multiple arrays of synchrotron X-ray microbeams permits huge therapeutic advantages. Brain tumor (9LGS)-bearing and normal rats were irradiated using a conventional, homogeneous Broad Beam (BB), or Microbeam Radiation Therapy (MRT), then studied by behavioral tests, MRI, and histopathology. A valley dose of 10 Gy deposited between microbeams, delivered by a single port, improved tumor control and median survival time of tumor-bearing rats better than a BB isodose. An increased number of ports and an accumulated valley dose maintained at 10 Gy delayed tumor growth and improved survival. Histopathologically, cell death, vascular damage, and inflammatory response increased in tumors. At identical valley isodose, each additional MRT port extended survival, resulting in an exponential correlation between port numbers and animal lifespan (r2 = 0.9928). A 10 Gy valley dose, in MRT mode, delivered through 5 ports, achieved the same survival as a 25 Gy BB irradiation because of tumor dose hot spots created by intersecting microbeams. Conversely, normal tissue damage remained minimal in all the single converging extratumoral arrays. Multiport MRT reached exceptional ~2.5-fold biological equivalent tumor doses. The unique normal tissue sparing and therapeutic index are eminent prerequisites for clinical translation.

Keywords: brain tumor control; dose equivalence; normal tissue sparing; synchrotron microbeam radiation therapy.


Conflict of interest statement

The authors declare no conflict of interest.

Figures

Figure 1
Figure 1
Multiple MRT irradiation focally reduced MRI signal and modified normal rat ambulation. (A) Irradiation geometries and valley dose maps computed on IsoGray for normal rat irradiation. BB2 was delivered as 2 orthogonal 8 × 8 mm2 beams (2 × 5 Gy, left panel) while MRT (19 microbeams, width 50 µm, 400 µm spacing) was delivered through 2 orthogonal (middle panel) or 5 isocentric coplanar ports spaced by 36° (right panel), intersecting in the right caudate nucleus (total cumulated valley dose of 10 Gy). (B) Whole brain dose–volume histograms (DVH) computed for BB2 and 2 and 5 MRT ports. Valley doses and peak doses are plotted as the cumulated dose and the maximum (cumulated intersecting microbeam doses) deposited in a 1 × 1 × 1 mm3 CT voxel. (C) Irradiation parameters and group size for animal follow-up. Ctrl: Controls. (D) Representative T2-weighted MR images acquired in normal rats at 2, 6, and 12 months after irradiation highlight hyposignal (dark horizontal markings) in the target and even in the contralateral hemisphere where multiple beams intersect. Apparent diffusion coefficients (ADC), acquired 1 year after irradiation, did not differ between the target and the contralateral caudate nucleus. (E) T2* Fit analysis unveiled reduced values in the entire brain and the target after MRT. (F) Kaplan–Meier curves obtained for normal rats exposed to BB2 and MRT2/5. (G) Open field (OF) center entry count, distance walked in center, and duration of ambulation in the whole field (WF) of normal rats at 0.5, 2, 6, and 12 months after irradiation. (H) Defecation of irradiated rats during the open field testing period. (I) Duration ratio for novel object (NO) recognition of control and irradiated rats at 0.5, 2, 6, and 12 months after irradiation. (J) Walking time on a turning cylinder (Rotarod, Rot.) obtained at 0.5, 1, 2, 4, 6, and 12 months after irradiation for control and irradiated rats. In each panel, control group: dashed line; BB2 group: solid black line; MRT 2 ports: light green line; MRT 5 ports: dark green line. Data are plotted as mean +/− SEM. Significance was determined using one- and two-way ANOVA tests for p < 0.05, and noted as * Ctrl vs. MRT5, # BB2 vs. MRT5, ^ Ctrl vs. MRT2, ¶ BB2 vs. MRT2, + MRT5 vs. MRT5, ° MRT2 vs. MRT2, £ MRT5 vs. MRT2, § BB2 vs. BB2.
Figure 2
Figure 2
Pathology and quantitative immunolabeling characterization of irradiation effects at 12 months after irradiation of normal rats. (AI) No histopathologic alterations were seen in collateral areas where the deposited dose was subdivided in single-beam trajectories (5 Gy BB2, 5/376 Gy MRT2 valley/peak dose, 2/137 Gy MRT5 valley/peak dose), for (A) H&E staining, (B) Collagen−4, RECA-1, Glut-1 immunolabeling, (C) CD68 reactivity, (D) Olig2 staining, and (E) NeuN-GFAP dual-labeling. The same results between groups were obtained for quantitative analysis of (F) total cell density and (G) number of blood vessels, while (H) the density of CD68-positive cells moderately increased after multiport MRT. In contrast, the same (I) oligodendrocyte and (J) neuronal densities were found in all groups.
Figure 3
Figure 3
Each supplementary MRT port improved tumor control and contributed to the exponential extension of MST. (A) Irradiation geometries and valley dose maps computed on IsoGray for 9L glioma-bearing rats. BB2 was delivered through 2 orthogonal 8 × 8 mm2 beams (2 × 5 Gy) while MRT (microbeam width 50 µm, 400 µm spacing) was delivered via 1 (valley dose at target 10 Gy, peak dose 726 Gy) to 5 isocentric ports, spaced at 36° and intersecting in the right caudate nucleus (valley dose at target 5 × 2 Gy, peak dose 5 × 137 Gy). (B) Whole brain and tumor dose–volume histograms computed for BB2 and 1 to 5 MRT ports for a similar cumulated dose at the target (10 Gy). Valley doses and peak doses are plotted as the cumulated dose and the maximum (cumulated intersecting microbeam doses) deposited in a 1 × 1 × 1 mm3 CT voxel. (C) Irradiation parameters and group size for animal follow up. (D) Representative T2-weighted MR images acquired in 9L-bearing rats prior to and 7, 14, and 21 days after MRT irradiation. Volumes of 9L gliomas, measured on MR images at days 7, 14, and 21 after BB2 (dose range 0–35 Gy) and microbeam (10 Gy, 1 to 5 ports) irradiations, show that tumor growth control increases with use of additional MRT ports. (E) MRT/BB2 equivalence doses: MR tumor volumes (green) obtained at day 14 (left) and 21 days (right) after irradiation are positioned on the reference 9L tumor response curve (black line) for MRT1 to MRT5. (F) BB2 dose equivalences derived from (E) for 1 to 5 MRT ports at 14 and 21 days post irradiation and mean equivalences calculated between T14 and T21. (G) Survival curves of tumor-bearing rats obtained after BB2 or MRT (1 to 5 ports) for a cumulated valley dose of 10 Gy (left). Non-linear correlation between the number of MRT ports and MST of tumor-bearing rats (center). MST of 9L-bearing rats according to the delivered BB2 dose (dashed fit, right). By extrapolation, 8 MRT ports delivering a 10 Gy cumulated valley dose would lead to the same survival as that achieved by 35 Gy of BB2 irradiation. (H) Survival summary, biological equivalence doses, and Log-rank test comparisons between groups. In each panel, except D, BB2 group: solid black; MRT 1 port: light grey; MRT 2 ports: light green; MRT 3 ports: mid grey; MRT 4 ports: dark grey; MRT 5 ports: dark green. Data are plotted as mean +/− SEM. Significance was determined using unpaired t-tests for p < 0.05, and noted as * 0 Gy vs. all treatment groups, for BB2 groups as ^ BB 4 Gy vs. BB 16/22/35 Gy, x BB 4 Gy vs. BB 10/22/35 Gy, BB 10 Gy vs. BB 16/22/35 Gy, § BB 16 Gy vs. BB 35 Gy, £ BB 22 Gy vs. BB 35 Gy and for MRT groups as # BB vs. all MRT groups, ° MRT4 vs. MRT1/2/3, + MRT5 vs. MRT1/2/3.
Figure 4
Figure 4
Pathology and quantitative immunolabeling characterization of irradiation effects at 7 days after 9L tumor irradiations. (AI) Analysis of tumor lesions 7 days after BB2, MRT2, or MRT5 irradiations or 17 days after tumor implantation in untreated rats (control). (A) Hematoxylin and eosin staining: Irradiated tumors displayed a lower cell density than unirradiated tumors (Ctrl). While (B) γH2AX-reactivity was increased, (C) Ki67-staining decreased after MRT, in particular after MRT5. (D) Collagen-4, RECA-1, and GLUT-1 immuno-staining indicated vessel fractionation and hypoxia in MRT-irradiated targets. (E) Macrophage infiltration increased after multiport MRT as seen on CD68-stained images. (F) Similarly, microglia density (CD11b-positive cells) increased. Results were confirmed by quantitative analysis, showing (G) smaller tumors after MRT. In addition, (H) the γH2AX-positive cell fraction increased, whereas (I) the fraction of Ki67-positive cells decreased after multiport MRT. (J) MRT5 induced a reduction in blood volume fraction, in particular at 2 weeks p.i., compared with the other irradiation configurations. (K) Additionally, invasion of CD68-positive cells increased steadily, particularly after MRT5, and a delayed numerical macrophage increase was also measured two weeks after MRT2. (L) A similar pattern was observed for microglia invasion (CD11b-positive cell fraction). Data are plotted as mean +/− SEM. Significance was determined using multiple t-tests for p < 0.05, and noted as * Ctrl vs. treatment groups (black: vs. BB2; light green: vs. MRT2; dark green: vs. MRT5), # BB2 vs. BB2 (black) and vs. MRT (light green: vs. MRT2; dark green: vs. MRT5), ° MRT2 vs. MRT2, + MRT5 vs. MRT5, £ MRT2 vs. MRT5.
Figure 5
Figure 5
Exploratory treatment plan and provisional dosimetry for MRT (10 Gy, 5 ports) for brain metastasis irradiation for a human patient. (A) Valley and peak dose maps to deliver a 10 Gy cumulated valley dose to a 1 cm brain metastasis in a human patient through 5 MRT ports. (B) DVHs obtained for whole brain (black), PTV (light green), and GTV (dark green).

References

    1. Ostrom Q.T., Cioffi G., Gittleman H., Patil N., Waite K., Kruchko C., Barnholtz-sloan J.S., Comprehensive C., Western C. Neuro-Oncology CBTRUS Statistical Report: Primary Brain and Other Central Nervous System Tumors Diagnosed in the United States in 2012–2016. Neuro Oncol. 2019;21:v1–v100. doi: 10.1093/neuonc/noz150. - DOI - PMC - PubMed
    1. Stupp R., Mason W.P., van den Bent M.J., Weller M., Fisher B., Taphoorn M.J., Belanger K., Brandes A.A., Marosi C., Bogdahn U., et al. Radiotherapy plus concomitant and adjuvant temozolomide for glioblastoma. N. Engl. J. Med. 2005;352:987–996. doi: 10.1056/NEJMoa043330. - DOI - PubMed
    1. Kazda T., Dziacky A., Burkon P., Pospisil P., Slavik M., Rehak Z., Jancalek R., Slampa P., Slaby O., Lakomy R. Radiotherapy of glioblastoma 15 years after the landmark Stupp’s trial: More controversies than standards? Radiol. Oncol. 2018;52:121–128. doi: 10.2478/raon-2018-0023. - DOI - PMC - PubMed
    1. Ebi J., Sato H., Nakajima M., Shishido F. Incidence of leukoencephalopathy after whole-brain radiation therapy for brain metastases. Int. J. Radiat. Oncol. Biol. Phys. 2013;85:1212–1217. doi: 10.1016/j.ijrobp.2012.09.025. - DOI - PubMed
    1. Stupp R., Brada M., van den Bent M.J., Tonn J.-C., Pentheroudakis G. High-grade glioma: ESMO Clinical Practice Guidelines for diagnosis, treatment and follow-up. Ann. Oncol. 2014;25:iii93–iii101. doi: 10.1093/annonc/mdu050. - DOI - PubMed

LinkOut - more resources