

Methylselenol Produced In Vivo from Methylseleninic Acid or Dimethyl Diselenide Induces Toxic Protein Aggregation in Saccharomyces cerevisiae
- PMID: 33668124
- PMCID: PMC7956261
- DOI: 10.3390/ijms22052241
Methylselenol Produced In Vivo from Methylseleninic Acid or Dimethyl Diselenide Induces Toxic Protein Aggregation in Saccharomyces cerevisiae
Abstract
Methylselenol (MeSeH) has been suggested to be a critical metabolite for anticancer activity of selenium, although the mechanisms underlying its activity remain to be fully established. The aim of this study was to identify metabolic pathways of MeSeH in Saccharomyces cerevisiae to decipher the mechanism of its toxicity. We first investigated in vitro the formation of MeSeH from methylseleninic acid (MSeA) or dimethyldiselenide. Determination of the equilibrium and rate constants of the reactions between glutathione (GSH) and these MeSeH precursors indicates that in the conditions that prevail in vivo, GSH can reduce the major part of MSeA or dimethyldiselenide into MeSeH. MeSeH can also be enzymatically produced by glutathione reductase or thioredoxin/thioredoxin reductase. Studies on the toxicity of MeSeH precursors (MSeA, dimethyldiselenide or a mixture of MSeA and GSH) in S.cerevisiae revealed that cytotoxicity and selenomethionine content were severely reduced in a met17 mutant devoid of O-acetylhomoserine sulfhydrylase. This suggests conversion of MeSeH into selenomethionine by this enzyme. Protein aggregation was observed in wild-type but not in met17 cells. Altogether, our findings support the view that MeSeH is toxic in S. cerevisiae because it is metabolized into selenomethionine which, in turn, induces toxic protein aggregation.
Keywords: Saccharomyces cerevisiae metabolism; diselenide; methylseleninic acid; methylselenol; protein aggregation; redox equilibrium; thiol/disulfide exchange; toxicity.
Conflict of interest statement
The authors declare no conflict of interest.
Figures
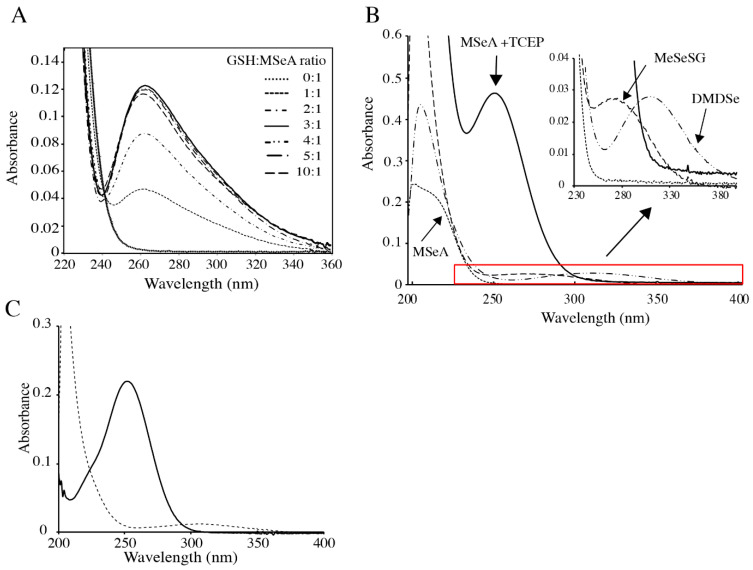
 ) or presence (
 ) of 500 µM TCEP, 100 µM MeSeSG (
 ), or 100 µM DMDSe (
 ) in 100 mM potassium phosphate, pH 7.4; spectra in the red box are extended in the inset. (C) Reaction of MeSeSG with methylselenol (MeSeH). MeSeH was produced by mixing 25 µM DMDSe with 25 µM TCEP in 100 mM potassium phosphate, pH 7.4. UV absorption spectra were recorded before (
 ) and after the addition of 50 µM MeSeSG (
 ) to this sample.


 ). The reaction mixtures contained 100 µM NADPH, and 50 µM of the substrate under study in 100 mM potassium phosphate, pH 7.4. The reactions were started by adding 1.5 nM GR to the GSSG mixture or 73 nM GR to the MeSeSG mixture. (B) Aerobic () and anaerobic (
 , +) consumption of NADPH in the presence of GR and 100 µM DMDSe (+) or 100 µM MeSeSG (, ). The reaction mixtures contained 200 µM NADPH, 100 nM GR in 100 mM potassium phosphate, pH 7.4, at 22 °C. Anaerobic reactions were performed in a glove box under nitrogen atmosphere. (C) Stoichiometry of NADPH consumption as a function of MeSeSG concentration in anaerobic conditions. NADPH consumption was followed in anaerobic conditions with 0 to 200 µM MeSeSG added to the reaction mixture as in B). The amount of NADPH consumed after 125 min was calculated from the ∆A340 after subtraction of the value in the absence of substrate.
 ), or 50 µM of DMDSe (), MeSeSG(☐), or MSeA(∆).
 ) or SD supplemented with 100 µM methionine () in the presence of increasing concentrations of a mixture containing MSeA with a three-fold excess of GSH. (C) BY4742 cells grown in SD () or SD supplemented with 100 µM methionine () in the presence of increasing concentrations of DMDSe. (D) BY4742 () and ∆met17 (), and ∆cys3 (■) isogenic mutants cells grown in SD medium supplemented with 100 µM cysteine in the presence of increasing concentrations of DMDSe.
Similar articles
-
Exposure to the Methylselenol Precursor Dimethyldiselenide Induces a Reductive Endoplasmic Reticulum Stress in Saccharomyces cerevisiae.Int J Mol Sci. 2021 May 22;22(11):5467. doi: 10.3390/ijms22115467. Int J Mol Sci. 2021. PMID: 34067304 Free PMC article.
-
Formation of methylselenol, dimethylselenide and dimethyldiselenide in in vitro metabolism models determined by headspace GC-MS.Metallomics. 2010 Feb;2(2):167-73. doi: 10.1039/b914255j. Epub 2010 Jan 7. Metallomics. 2010. PMID: 21069149
-
Induction of caspase-mediated apoptosis and cell-cycle G1 arrest by selenium metabolite methylselenol.Mol Carcinog. 2002 Jul;34(3):113-20. doi: 10.1002/mc.10056. Mol Carcinog. 2002. PMID: 12112305
-
Selenomethionine metabolism and its toxicity in yeast.Biomol Concepts. 2013 Dec;4(6):611-6. doi: 10.1515/bmc-2013-0033. Biomol Concepts. 2013. PMID: 25436761 Review.
-
Selenium and anticarcinogenesis: underlying mechanisms.Curr Opin Clin Nutr Metab Care. 2008 Nov;11(6):718-26. doi: 10.1097/MCO.0b013e3283139674. Curr Opin Clin Nutr Metab Care. 2008. PMID: 18827575 Review.
Cited by
-
Seleno-Metabolites and Their Precursors: A New Dawn for Several Illnesses?Metabolites. 2022 Sep 16;12(9):874. doi: 10.3390/metabo12090874. Metabolites. 2022. PMID: 36144278 Free PMC article. Review.
-
Exposure to Selenomethionine and Selenocystine Induces Redox-Mediated ER Stress in Normal Breast Epithelial MCF-10A Cells.Biol Trace Elem Res. 2025 Mar;203(3):1453-1464. doi: 10.1007/s12011-024-04244-y. Epub 2024 May 22. Biol Trace Elem Res. 2025. PMID: 38777874
-
Does atmospheric dimethyldiselenide play a role in reducing COVID-19 mortality?Gondwana Res. 2023 Feb;114:87-92. doi: 10.1016/j.gr.2022.05.017. Epub 2022 Jun 6. Gondwana Res. 2023. PMID: 35692874 Free PMC article.
-
THE MAIN CYTOTOXIC EFFECTS OF METHYLSELENINIC ACID ON VARIOUS CANCER CELLS.Int J Mol Sci. 2021 Jun 21;22(12):6614. doi: 10.3390/ijms22126614. Int J Mol Sci. 2021. PMID: 34205571 Free PMC article. Review.
-
Exposure to the Methylselenol Precursor Dimethyldiselenide Induces a Reductive Endoplasmic Reticulum Stress in Saccharomyces cerevisiae.Int J Mol Sci. 2021 May 22;22(11):5467. doi: 10.3390/ijms22115467. Int J Mol Sci. 2021. PMID: 34067304 Free PMC article.
References
MeSH terms
Substances
LinkOut - more resources
Full Text Sources
Other Literature Sources
Molecular Biology Databases
