. 2021 Feb 24;10(3):482.
doi: 10.3390/foods10030482.

Sensory Acceptability and Proximate Composition of 3-Blend Plant-Based Dairy Alternatives

Affiliations

Sensory Acceptability and Proximate Composition of 3-Blend Plant-Based Dairy Alternatives

Ama Frempomaa Oduro et al. Foods. .

Abstract

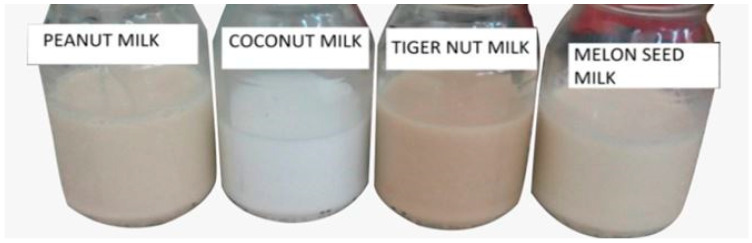
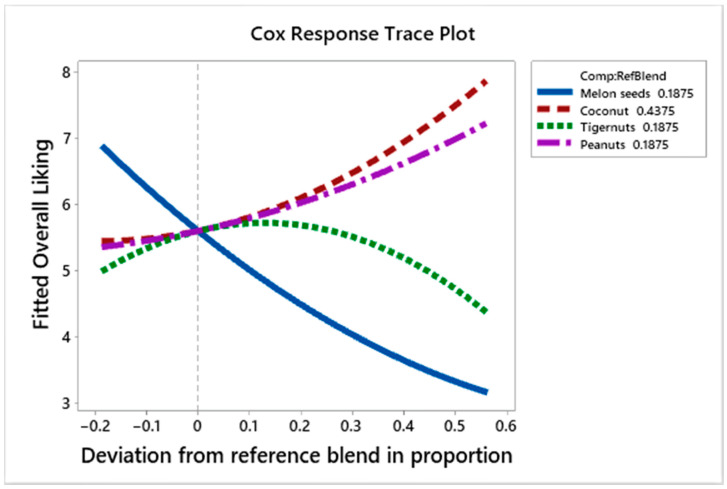
Limitations of plant-based dairy alternatives as sustainable foods are their relatively low protein content and low sensory appeal. In this study, we used a consumer-led product development approach to improve the sensory appeal of existing prototypes of 3-blend dairy alternatives produced from melon seeds, peanuts and coconut. We used Relative Preference Mapping (RPM) and consumer acceptance testing using the 9-point hedonic scale to respectively identify innovative flavours and deduce the effect of ingredient components on consumer sensory appeal. Mixture design was used as the formulation tool to obtain optimized prototypes of the 3-blend dairy alternatives. Proximate analysis of the new prototypes, instrumental color assessment and consumer testing provided a basis to select a sustainable 3-blend dairy alternative. This prototype had a relatively high protein content (2.16%), was considered innovative by target consumers and also had a moderate liking score (6.55 ± 1.88) on the 9-point hedonic scale. Prototypes with higher protein content had low sensory appeal and were not considered innovative. Other prototypes with innovative sensory appeal had low protein content. By combining different plant raw materials and utilizing different sensory testing methods, we were able to design sustainable plant-based dairy alternatives which can be further optimized.

Keywords: consumer acceptance; innovation; plant-based dairy alternatives; sustainable foods.


Conflict of interest statement

The authors declare no conflict of interest.

Figures

Figure 1
Figure 1
T-Map Scale used for RPM. X128 represents a mark (X) placed on the map by an assessor to show the position of product 128 on the T-Map Scale. This means that product 128 is perceived as liked less compared to the reference (R) and quite similar to the reference. Product 827 is perceived as liked more compared to the reference (R) and more different from the reference (R).
Figure 2
Figure 2
The different plant-based dairy alternatives: peanut milk, coconut milk, tiger nut milk and melon seed milk.
Figure 3
Figure 3
Even ultra-high temperature pasteurized (UHT) full cream milk used as reference sample, R and also as blind control (BC) for RPM test.
Figure 4
Figure 4
Product Map showing the area of innovation between the difference and liking axes. Legend: H—37.5% melon seed milk, 25% coconut milk, 37.5% peanut milk; A—25% melon seed milk, 50% coconut milk, 25% tiger nuts milk; P—50% coconut milk, 25% tiger nuts milk, 25% peanut milk; N—25% melon seed milk, 50% coconut milk, 25% peanut milk; R—37.5% melon seed milk, 25% coconut milk, 37.5% tiger nuts milk; E—25% coconut milk, 37.5% tiger nuts milk, 37.5% peanut milk; V*—Commercial plant-based dairy alternative and BC*— Even ultra-high temperature pasteurized (UHT) full cream milk; *—Commercial products.
Figure 5
Figure 5
Mean difference from reference scores. Error bars are standard errors of the mean. Letters represent Fishers Fisher’s Least Significant Difference (LSD) Post hoc analysis of the means. Samples with no letters in common are statistically different at the 95% confidence level. Legend: H—37.5% melon seed milk, 25% coconut milk, 37.5% peanut milk; A—25% melon seed milk, 50% coconut milk, 25% tiger nuts milk; P—50% coconut milk, 25% tiger nuts milk, 25% peanut milk; N—25% melon seed milk, 50% coconut milk, 25% peanut milk; R—37.5% melon seed milk, 25% coconut milk, 37.5% tiger nuts milk; E—25% coconut milk, 37.5% tiger nuts milk, 37.5% peanut milk; V*—Commercial plant-based dairy alternative and BC*— Even ultra-high temperature pasteurized (UHT) full cream milk; *—Commercial products.
Figure 6
Figure 6
Mean liking compared to the reference. Error bars are standard errors of the mean. Letters represent Fishers Fisher’s Least Significant Difference (LSD) Post hoc analysis of the means. Samples with no letters in common are statistically different at the 95% confidence level. Legend: H—37.5% melon seed milk, 25% coconut milk, 37.5% peanut milk; A—25% melon seed milk, 50% coconut milk, 25% tiger nuts milk; P—50% coconut milk, 25% tiger nuts milk, 25% peanut milk; N—25% melon seed milk, 50% coconut milk, 25% peanut milk; R—37.5% melon seed milk, 25% coconut milk, 37.5% tiger nuts milk; E—25% coconut milk, 37.5% tiger nuts milk, 37.5% peanut milk; V*—Commercial plant-based dairy alternative and BC*— Even ultra-high temperature pasteurized (UHT) full cream milk; *—Commercial products.
Figure 7
Figure 7
Cox response trace plot to show effect of ingredient on overall liking scores.
Figure 8
Figure 8
Cox response trace plot to show effect of ingredient on appearance liking scores.
Figure 9
Figure 9
Cox response trace plot to show effect of ingredient on flavour liking scores.
Figure 10
Figure 10
Cox response trace plot to show effect of ingredient on mouthfeel liking scores.
Figure 11
Figure 11
Cox response trace plot to show effect of ingredient on consistency liking scores.
Figure 12
Figure 12
Cox response trace plot to show effect of ingredient on aftertaste liking scores.

References

    1. FAO . Definition of Sustainable Diets. Food Agriculture Organization; Rome, Italy: 2010.
    1. Drewnowski A., Rehm C.D., Martin A., Verger E.O., Voinnesson M., Imbert P. Energy and nutrient density of foods in relation to their carbon footprint. Am. J. Clin. Nutr. 2014;101:184–191. doi: 10.3945/ajcn.114.092486. - DOI - PubMed
    1. Röös E., Karlsson H., Witthöft C., Sundberg C. Evaluating the sustainability of diets—Combining environmental and nutritional aspects. Environ. Sci. Policy. 2015;47:157–166. doi: 10.1016/j.envsci.2014.12.001. - DOI
    1. Tilman D., Clark M. Global diets link environmental sustainability and human health. Nat. Cell Biol. 2014;515:518–522. doi: 10.1038/nature13959. - DOI - PubMed
    1. Smedman A., Lindmark-Månsson H., Drewnowski A., Edman A.-K.M. Nutrient density of beverages in relation to climate impact. Food Nutr. Res. 2010;54:5170. doi: 10.3402/fnr.v54i0.5170. - DOI - PMC - PubMed

LinkOut - more resources