. 2021 Feb 24;13(3):713.
doi: 10.3390/nu13030713.

Multiple Selection Criteria for Probiotic Strains with High Potential for Obesity Management

Affiliations

Multiple Selection Criteria for Probiotic Strains with High Potential for Obesity Management

Jeanne Alard et al. Nutrients. .

Abstract

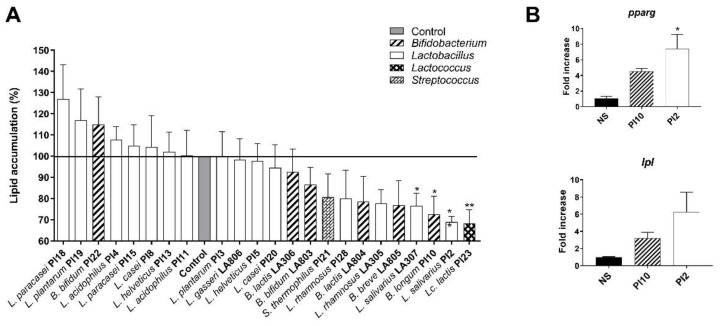
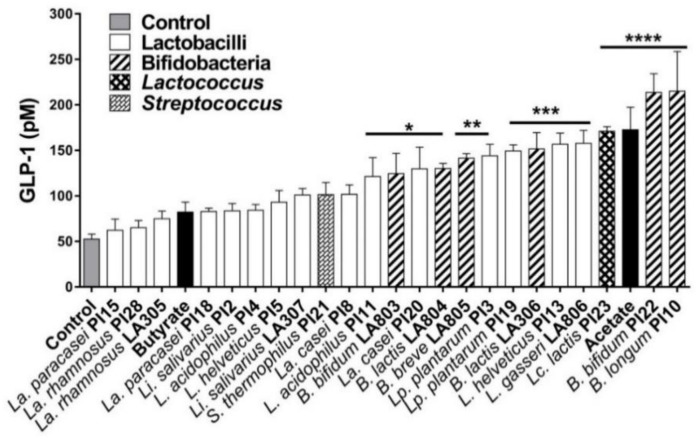
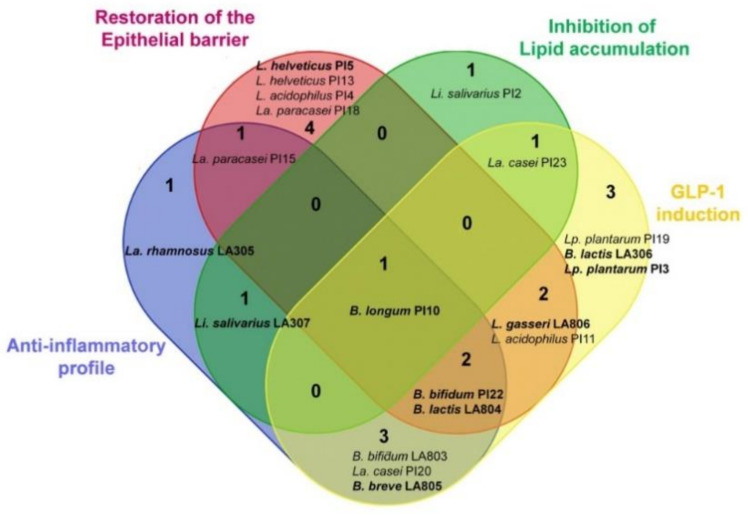
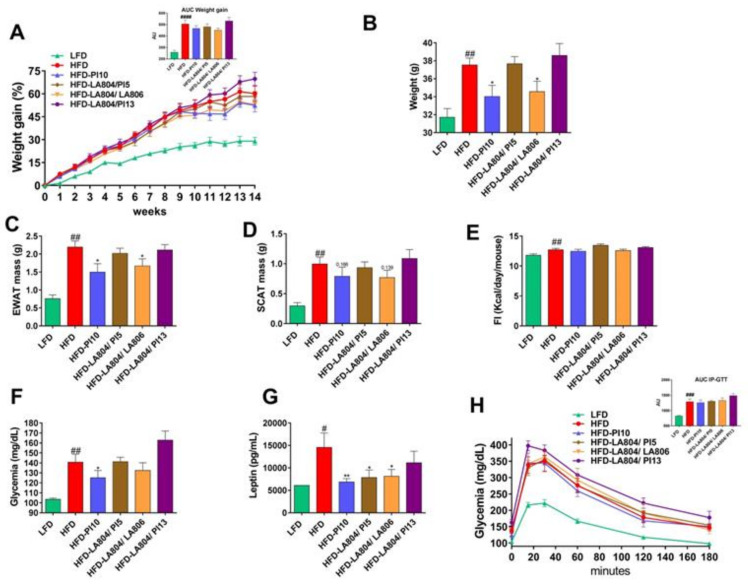
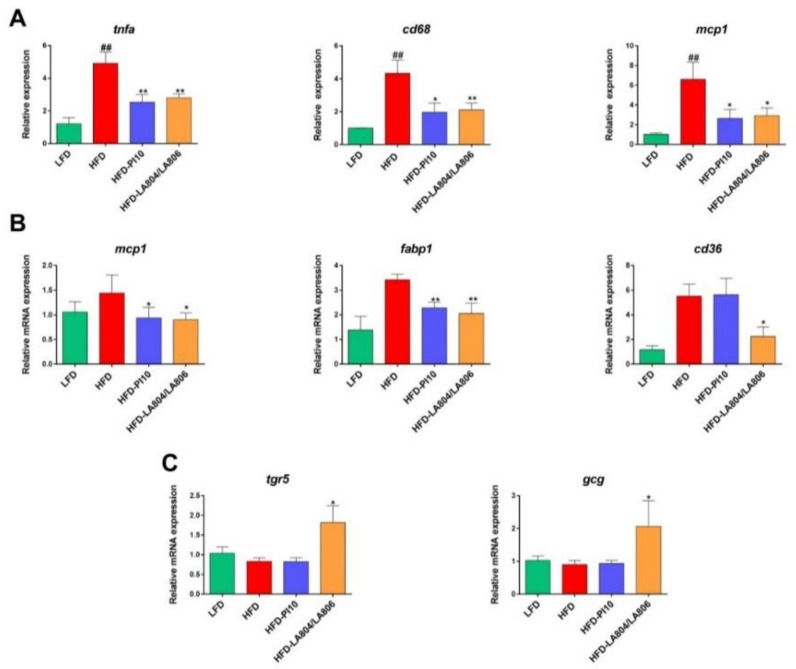
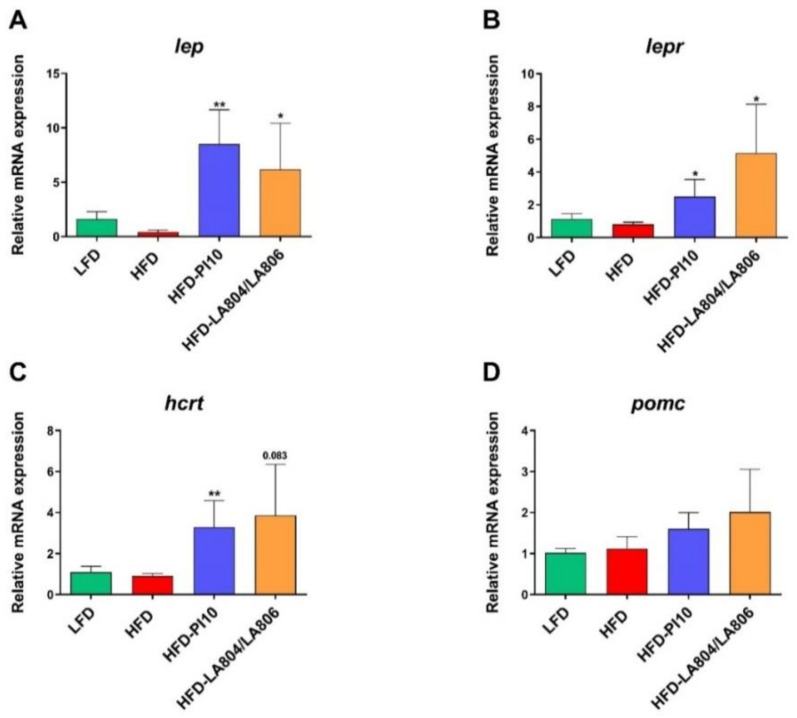
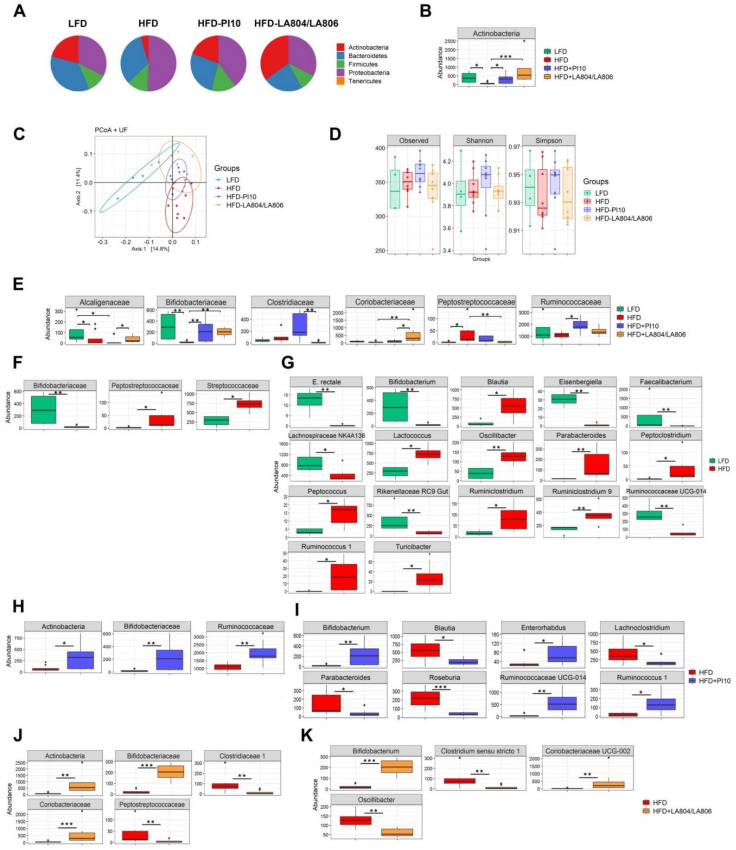
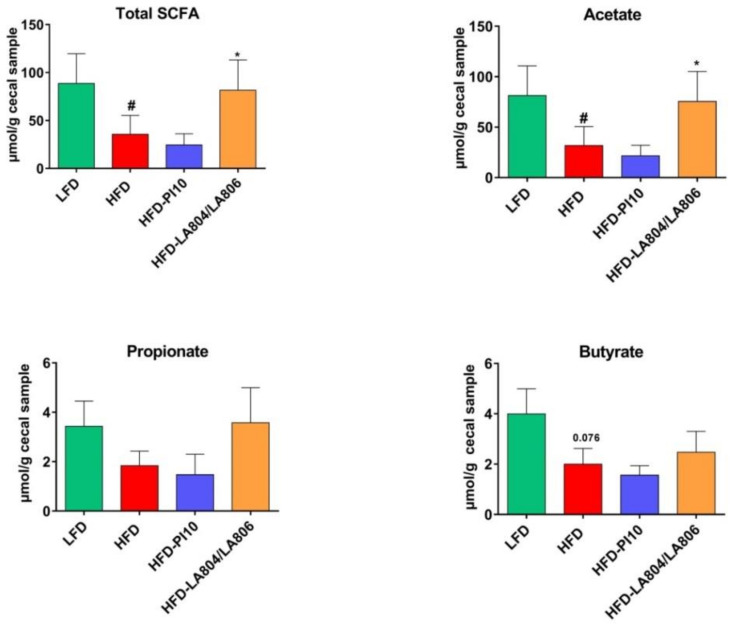
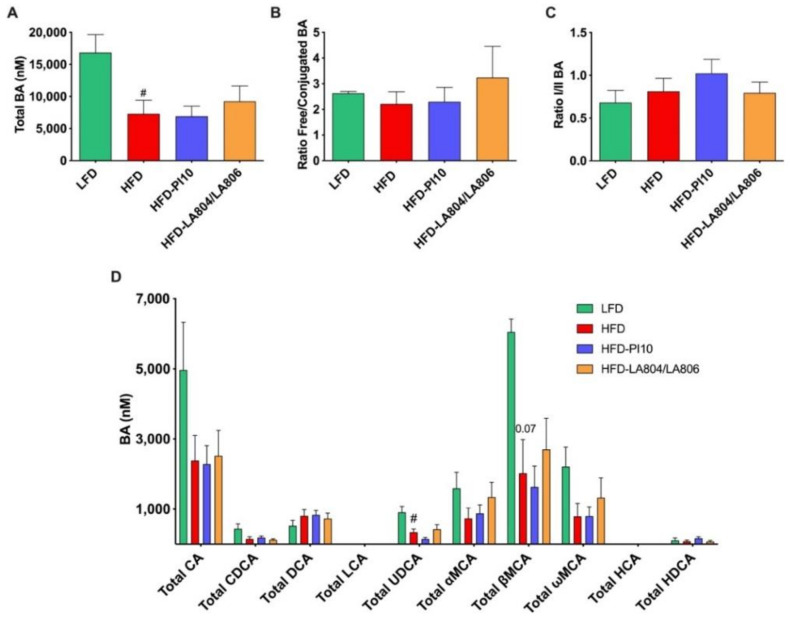
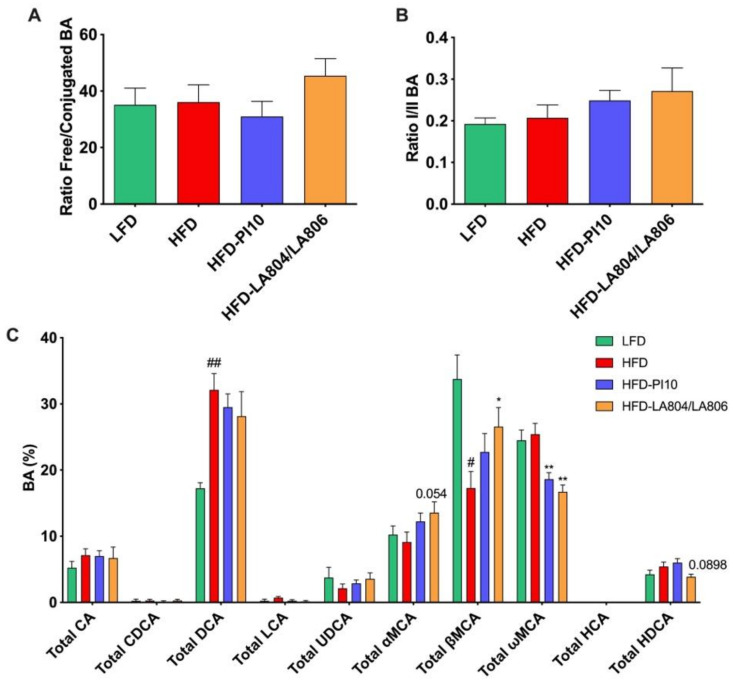
Since alterations of the gut microbiota have been shown to play a major role in obesity, probiotics have attracted attention. Our aim was to identify probiotic candidates for the management of obesity using a combination of in vitro and in vivo approaches. We evaluated in vitro the ability of 23 strains to limit lipid accumulation in adipocytes and to enhance the secretion of satiety-promoting gut peptide in enteroendocrine cells. Following the in vitro screening, selected strains were further investigated in vivo, single, or as mixtures, using a murine model of diet-induced obesity. Strain Bifidobacterium longum PI10 administrated alone and the mixture of B. animalis subsp. lactis LA804 and Lactobacillus gasseri LA806 limited body weight gain and reduced obesity-associated metabolic dysfunction and inflammation. These protective effects were associated with changes in the hypothalamic gene expression of leptin and leptin receptor as well as with changes in the composition of gut microbiota and the profile of bile acids. This study provides crucial clues to identify new potential probiotics as effective therapeutic approaches in the management of obesity, while also providing some insights into their mechanisms of action.

Keywords: bile acids; enteroendocrine peptides; epithelial barrier; hypothalamus; inflammation; microbiota; obesity; probiotics.


Conflict of interest statement

S.H. is employed full time by PiLeJe laboratoire and J.A. received a PhD grant supported in part by PiLeje Laboratoire. S.K. was employed by Genibio and is currently employed by Nuwen. B.P. is also employed by Yakult Europe, but declares no conflict of interests for this paper.

Figures

Figure 1
Figure 1
Effect of selected strains on adipocyte lipid accumulation. (A). Intracellular lipids were quantified after Oil-red-O staining. The dye was eluted from cells with isopropanol and quantified. Results are expressed as a percentage from control adipocytes. * refer to the comparison of probiotic-stimulated 3T3-L1 versus untreated cells (medium control). (B). Relative mRNA expression (RT-qPCR) of pparg and lpl in B. longum PI10- and L. salivarius PI2-treated adipocytes. * refer to the comparison of probiotic-stimulated 3T3-L1 versus untreated cells (medium control), * p < 0.05, ** p < 0.01.
Figure 2
Figure 2
Effect of selected strains on GLP-1 secretion by STC-1 cells. Cells were stimulated for 8 h with probiotics. GLP-1 secretion was measured by Radioimmunoassay (RIA). * refers to the comparison between bacteria-exposed STC-1 cells and untreated cells (medium control), * p < 0.05, ** p < 0.01, *** p < 0.001, **** p < 0.0001.
Figure 3
Figure 3
Venn diagram summarizing the in vitro functional properties of the most effective strains and highlighting the strains that combine different properties. The strains with the highest measured abilities in one or several models are shown in bold.
Figure 4
Figure 4
B. longum PI10 and the B. animalis subsp. lactis LA804/L. gasseri LA806 mixture limited high-fat diet (HFD)-induced body weight gain, fat mass increase, hyperglycemia, and hyperleptinemia but had no impact on HFD-induced glucose intolerance. (A) Evolution of body weight gain (in %) in mice receiving probiotics or excipient and fed a low-fat diet (LFD) or HFD for 14 weeks and the corresponding area under the curve (AUC) (in arbitrary unit [AU]). (B) Body weight at sacrifice (in g). (C) Epididymal adipose tissue (EWAT) mass at sacrifice (in g). (D) Subcutaneous adipose tissue (SCAT) mass at sacrifice (in g). (E) Cumulative food intake (in kcal/day/mouse). (F) Fasting blood glucose levels at 13 weeks of diet (in mg/dL). (G) Fasting blood leptin level at 13 weeks of diet (in pg/mL). (H) Intra-peritoneal glucose tolerance test (IP-GTT) at 12 weeks of diet and the corresponding AUC (in AU). Blood glucose levels (mg/dL) measured after intraperitoneal glucose injection. Data are expressed as mean ± S.E.M. of 4 (LFD) to 8 (HFD) mice per group. # corresponds to diet effect (HFD vs. LFD), * corresponds to treatment effect (Probiotic vs. Excipient). * or # p < 0.05, ** or ## p < 0.01; ### p < 0.001; #### p < 0.0001.
Figure 5
Figure 5
B. longum PI10 and the mixture of B. animalis subsp. lactis LA804 and L. gasseri LA806 limited the HFD-induced gene expression of inflammatory markers in the visceral adipose tissue and modulated the HFD-induced expression of genes involved in inflammation, fatty acid metabolism, and bile acid signaling in the small intestine. (A) The expression levels of inflammatory-related (tnfa, cd68 and mcp1) were quantified in the visceral adipose tissue at sacrifice by RT-qPCR. (B) Quantification of the expression levels of genes involved in inflammation (mcp-1) and fatty acid uptake and transport (fabp1, cd36) in the jejunum. (C) The expression levels of genes encoding the receptor for bile acids (tgr5) and proglucagon (gcg) in the duodenum. Values are expressed as the relative mRNA levels compared with LFD mice and expressed as mean ± standard error of the mean (S.E.M) of 6 (LFD group) to 8 (HFD groups) mice per group. #corresponds to regime effect (HFD vs. LFD), * corresponds to treatment effect (Probiotic vs. Excipient), * p < 0.05, ** or ## p < 0.01.
Figure 6
Figure 6
B. longum PI10 and the mixture of B. animalis subsp. lactis LA804 and L. gasseri LA806 modulated hypothalamic expression of genes involved in food intake and energy expenditure. The expression levels of genes encoding (A), leptin (lep), (B) leptin receptor (lepr) (C) orexin (hcrt), and (D) proopiomelanocortin (Pomc) were quantified in the hypothalamus of LFD-fed mice and HFD-fed mice treated or not with the selected probiotic strains by RT-qPCR. Values are expressed as the relative mRNA levels compared with LFD mice and expressed as mean ± SEM of 6 (LFD group) to 8 (HFD groups) mice per group. *corresponds to treatment effect (Probiotic vs. Excipient), * p < 0.05, ** p < 0.01.
Figure 7
Figure 7
B. longum PI10 strain and B. animalis subsp. lactis LA804 and L. gasseri LA806 mixture had an impact on the HFD-induced microbiota dysbiosis. (A) Relative abundance of the dominant phyla evaluated by 16S rRNA MiSeq sequencing in cecal contents. (B) Relative abundance of Actinobacteria for each group of mice. (C) PCoA (Unifrac) analysis showing comparative differences between groups at the phylum, family, and genus levels. (D) Diversity indexes (observed, Shannon, Simpson). (E) Differences in the relative abundance of families between groups. (F) Differences in the relative abundance of families and (G) genera between LFD and HFD groups. (H) Differences in the relative abundance of families and (I) genera between HFD and HFD-PI10 groups. (J) Differences in the relative abundance of families and (K) genera between HFD and HFD-LA804 + LA806 groups. * p < 0.05, ** p < 0.01; *** p < 0.001.
Figure 8
Figure 8
The mixture of B. animalis subsp. lactis LA804 and L. gasseri LA806 significantly restored the production of SCFAs in the cecum. Levels of total SCFAs, acetate, propionate, and butyrate are expressed in µmol/g of cecal content as mean ± SEM of 6 (LFD group) to 8 (HFD groups) mice per group. # corresponds to the diet effect (HFD vs. LFD), * corresponds to the treatment effect (Probiotic vs. Excipient), * or # p < 0.05.
Figure 9
Figure 9
B. longum PI10 strain and B. animalis subsp. lactis LA804 and L. gasseri LA806 mixture have no effect on portal BA concentrations. (A) Total BA concentrations; (B) Ratio Free/Conjugated BA; (C) Ratio primary/secondary BA; (D) Different BA species concentrations. Results are expressed as mean ± SEM. # p < 0.05 HFD vs. LFD (Mann-Whitney test).
Figure 10
Figure 10
B. longum PI10 strain and B. animalis subsp. lactis LA804 and L. gasseri LA806 mixture change BA cecal content composition. (A) Ratio Free/conjugated BA; (B) Ratio primary/secondary BA; (C) Different BA species expressed as percentage of Total BA. Results are expressed as mean ± SEM. # p < 0.05, ## p <0.01, HFD vs. LFD, * p < 0.05, ** p < 0.01, treated vs. HFD, Mann-Whitney test.

References

    1. Zou C., Shao J. Role of Adipocytokines in Obesity-Associated Insulin Resistance. J. Nutr. Biochem. 2008;19:277–286. doi: 10.1016/j.jnutbio.2007.06.006. - DOI - PubMed
    1. Bäckhed F., Ding H., Wang T., Hooper L.V., Koh G.Y., Nagy A., Semenkovich C.F., Gordon J.I. The Gut Microbiota as an Environmental Factor That Regulates Fat Storage. Proc. Natl. Acad. Sci. USA. 2004;101:15718–15723. doi: 10.1073/pnas.0407076101. - DOI - PMC - PubMed
    1. Turnbaugh P.J., Ley R.E., Mahowald M.A., Magrini V., Mardis E.R., Gordon J.I. An Obesity-Associated Gut Microbiome with Increased Capacity for Energy Harvest. Nature. 2006;444:1027–1031. doi: 10.1038/nature05414. - DOI - PubMed
    1. Ridaura V.K., Faith J.J., Rey F.E., Cheng J., Duncan A.E., Kau A.L., Griffin N.W., Lombard V., Henrissat B., Bain J.R., et al. Gut Microbiota from Twins Discordant for Obesity Modulate Metabolism in Mice. Science. 2013;341:1241214. doi: 10.1126/science.1241214. - DOI - PMC - PubMed
    1. Zhang X., Shen D., Fang Z., Jie Z., Qiu X., Zhang C., Chen Y., Ji L. Human Gut Microbiota Changes Reveal the Progression of Glucose Intolerance. PLoS ONE. 2013;8:e71108. doi: 10.1371/journal.pone.0071108. - DOI - PMC - PubMed

Grants and funding