. 2021 Feb 25;10(3):490.
doi: 10.3390/cells10030490.

Embryonic Environmental Niche Reprograms Somatic Cells to Express Pluripotency Markers and Participate in Adult Chimaeras

Affiliations

Embryonic Environmental Niche Reprograms Somatic Cells to Express Pluripotency Markers and Participate in Adult Chimaeras

Krystyna Żyżyńska-Galeńska et al. Cells. .

Abstract

The phenomenon of the reprogramming of terminally differentiated cells can be achieved by various means, like somatic cell nuclear transfer, cell fusion with a pluripotent cell, or the introduction of pluripotency genes. Here, we present the evidence that somatic cells can attain the expression of pluripotency markers after their introduction into early embryos. Mouse embryonic fibroblasts introduced between blastomeres of cleaving embryos, within two days of in vitro culture, express transcription factors specific to blastocyst lineages, including pluripotency factors. Analysis of donor tissue marker DNA has revealed that the progeny of introduced cells are found in somatic tissues of foetuses and adult chimaeras, providing evidence for cell reprogramming. Analysis of ploidy has shown that in the chimaeras, the progeny of introduced cells are either diploid or tetraploid, the latter indicating cell fusion. The presence of donor DNA in diploid cells from chimaeric embryos proved that the non-fused progeny of introduced fibroblasts persisted in chimaeras, which is evidence of reprogramming by embryonic niche. When adult somatic (cumulus) cells were introduced into early cleavage embryos, the extent of integration was limited and only cell fusion-mediated reprogramming was observed. These results show that both cell fusion and cell interactions with the embryonic niche reprogrammed somatic cells towards pluripotency.

Keywords: chimaera; embryonic niche; plasticity; reprogramming.


Conflict of interest statement

The authors declare no conflict of interest. The funders had no role in the design of the study; in the collection, analyses, or interpretation of data; in the writing of the manuscript, or in the decision to publish the results.

Figures
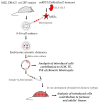
Figure 1
Figure 1
Experimental outline. Figure shows general scheme of experiments performed in this publication.
Figure 2
Figure 2
Expression of markers of blastocyst lineages in chimaeric blastocysts. (A) Immunofluorescence staining of chimaeric blastocyst. Chimaeric blastocyst with MEF cell expressing RFP (red) incorporated into trophectoderm and expressing CDX2 (white). Recipient embryo is expressing Pdgfra-GFP (green) in PrE cells. (B) Immunofluorescence staining of chimaeric blastocyst with MEF cells expressing RFP incorporated into primitive endoderm, 2 cells express Pdgfra-GFP and GATA 4, 1 cell expresses only GATA 4. (C) Chart showing percentage of cells stained for CDX2, positive and negative within cells located in TE stained for CDX2. (D) Chart showing percentage of cells stained for NANOG, positive and negative within cells located in ICM stained for NANOG (but not GATA4). (E) Chart showing percentage of cells stained for GATA4, positive and negative within cells located in ICM stained for GATA4 (but not NANOG). (F) Chart showing percentage of cells stained for NANOG and GATA4, expressing each marker within cells located in ICM, stained for NANOG and GATA4.
Figure 3
Figure 3
Expression of markers of blastocyst lineages in chimaeric blastocysts. Analysis of fusion of introduced cells and activation of GFP under the promoter of Oct4. (A) Immunofluorescence staining of chimaeric blastocyst with MEF cell incorporated into epiblast and expressing RFP, GFP and NANOG. Recipient embryo is expressing GFP in all nuclei. Integrated cell expressing RFP and GFP is a product of fusion. (B) Immunofluorescence staining of chimaeric blastocyst with MEF cell incorporated into primitive endoderm, expressing RFP and GATA4, but not GFP. Introduced cell is reprogrammed to express GATA4, but is not a product of fusion. (C) Live fluorescence imaging of chimaeric blastocyst with MEF cell incorporated into primitive endoderm and expressing RFP and OCT4-GFP (GFP activated under the promoter of Oct4). (D) Immunofluorescence staining of chimaeric blastocyst with MEF cell incorporated into epiblast and expressing RFP and NANOG. Recipient embryo is expressing GFP in all nuclei. Integrated cell expressing RFP and NANOG, but is not a product of fusion.
Figure 4
Figure 4
Development of chimaeric foetuses. Chart showing percentage of foetuses with normal and delayed or abnormal development. The number 0.0% in the category “Foetuses from E13.5” reflects the lack of retarded foetuses in this group.
Figure 5
Figure 5
Analysis of sex marker Sry in foetuses by PCR reaction. M: DNA size marker 1, 2, 4, 5, 8, 9, 13: normal foetuses; 14, 15: foetuses delayed 0.5–2 days; 3, 10, 12, 16: delayed foetuses; 6, 7, 11, 17: degenerating tissues.
Figure 6
Figure 6
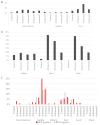
Donor marker expression in foetuses. Chart showing percentage of foetuses expressing donor markers. * all material found in implantation sites possibly containing degenerating embryo.
Figure 7
Figure 7
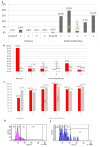
Donor markers in sorted fractions of diploid and tetraploid cells. (A) Photography of agarose gel after electrophoresis (B) microsatellite marker analysis. M: marker; 1: 4n cells from foetal tissues of foetus 1; 2: 2n cells from the same material; 3: 4n cells from foetal tissues of foetus 2 (both markers present); 4: 2n cells from the same material (both markers present); 5: 4n cells from yolk sac of foetus 3 (both markers present); 6: 2n cells from yolk sac of foetus 3; 7: 2n foetal tissues from ROSA donor (both markers present); 8: 2n foetal tissues from DBA/2 donor; M: marker. Arrows show donor marker occurrence. Red marks indicate the appropriate length of the microsatellite sequences identified in the cells; green marks indicate the appropriate size of the additional flanking length markers.
Figure 8
Figure 8
Analysis of donor marker expression in foetuses and foetal membranes. (A) Percentage of RFP-expressing cells in foetuses and foetal membranes. Statistically significantly more RFP-positive cells in samples compared to control were found in a chi-square test p < 0.01: embryo 1, foetal membranes 1, yolk sac 2, foetal membranes 3, foetal membranes 4. (B) Percentage of confirmed tetraploid cells in G2/M cell cycle phase within foetuses and foetal membranes in which a significant number of RFP-expressing cells were found. (C) Percentage of diploid cells in G1 cell cycle phase within RFP-expressing and RFP-negative cells in samples, in which RFP-expressing samples were found. (D) Cell cycle analysis of RFP-negative cells in foetus 1: P8: <2c DNA, P4: G1 of 2n cells, P5: G2/M of 2n cells and G1 of 4n cells, P6: G2/M of 4n cells. (E) Cell cycle analysis of RFP-expressing cells in foetus 1: P7: < 2c DNA, P1: G1 of 2n cells, P2: G2/M of 2n cells and G1 of 4n cells, P3: G2/M of 4n cells.
Figure 9
Figure 9
Analysis of donor marker expression in samples from adult animal organs. (A), (B) Percentage of RFP-expressing cells in organs. Statistically significantly more RFP-positive cells in samples compared to control were found in a chi-square test, p < 0.01: bone marrow (all chimaeric samples), testicle (3), kidney (1), kidney (3), liver (all chimaeric samples), heart (all chimaeric samples), brain (all chimaeric samples). (C) Tetraploid cells in G2/M cell cycle phase in RFP-positive and RFP-negative samples. Chart shows percentage of tetraploid cells in groups marked as RFP positive (progeny of donor cells) and RFP negative.
Figure 10
Figure 10
Analysis of marker expression in chimaeras with cumulus cells expressing RFP introduced to embryos. (A) Embryo with donor cumulus cell integrated with ICM and expressing SOX2 and GFP (cell fused with recipient GFP-expressing cell). (B) Cells stained for TE markers: positive for CDX2, EOMES (blue) and negative (grey). (C) Cells stained for EPI markers: positive for SOX2 (red) and negative (grey). (D) Cells stained for 2 ICM markers (for EPI and PrE marker): positive for SOX2 (red), GATA4, SOX17 (green) and negative (negative); 0.0% stands for the lack of double positive cells. (E) Cells stained for PrE markers: positive for GATA4, SOX17 (green) and negative (grey). (F) Cells stained for ICM markers: positive for SOX2 fused (red, striped), negative fused (grey, striped), negative, non-fused (grey). (G) Cells stained for TE markers: positive for CDX2, fused (blue, striped), negative fused (grey, striped), negative, non-fused (grey). (H) Cells stained for PrE markers: positive for GATA4, fused (green, striped), negative fused (grey, striped), negative, non-fused (grey).

Comment in

References

    1. Waddington C.H. The Strategy of the Genes. George Allen and Unwin; London, UK: 1957.
    1. Hochedlinger K., Plath K. Epigenetic reprogramming and induced pluripotency. Development. 2009;136:509–523. doi: 10.1242/dev.020867. - DOI - PMC - PubMed
    1. Frantz G.D., McConnell S.K. Restriction of Late Cerebral Cortical Progenitors to an Upper-Layer Fate. Neuron. 1996;17:55–61. doi: 10.1016/S0896-6273(00)80280-9. - DOI - PubMed
    1. Morrison S.J., Shah N.M., Anderson D.J. Regulatory Mechanisms in Stem Cell Biology. Cell. 1997;88:287–298. doi: 10.1016/S0092-8674(00)81867-X. - DOI - PubMed
    1. Bonifer C., Faust N., Geiger H., Müller A.M. Developmental Changes in the Differentiation Capacity of Haematopoietic Stem Cells. Immunol. Today. 1998;19:236–241. doi: 10.1016/S0167-5699(98)01259-6. - DOI - PubMed

Publication types

MeSH terms

LinkOut - more resources