

Time-Resolved scRNA-Seq Tracks the Adaptation of a Sensitive MCL Cell Line to Ibrutinib Treatment
- PMID: 33668876
- PMCID: PMC7956352
- DOI: 10.3390/ijms22052276
Time-Resolved scRNA-Seq Tracks the Adaptation of a Sensitive MCL Cell Line to Ibrutinib Treatment
Abstract
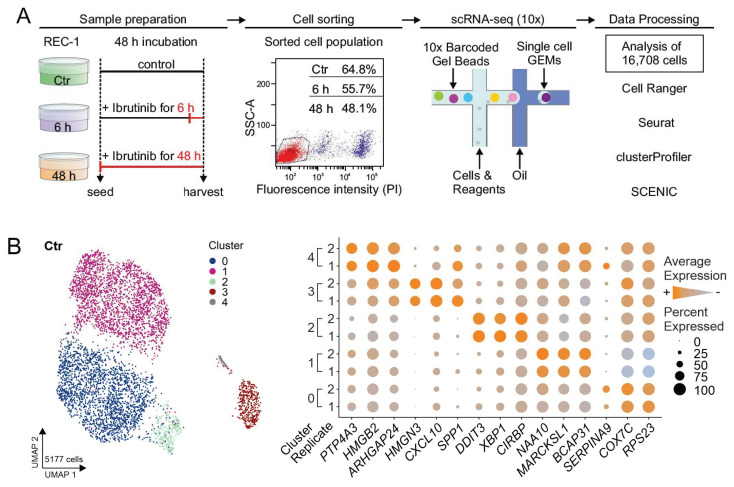
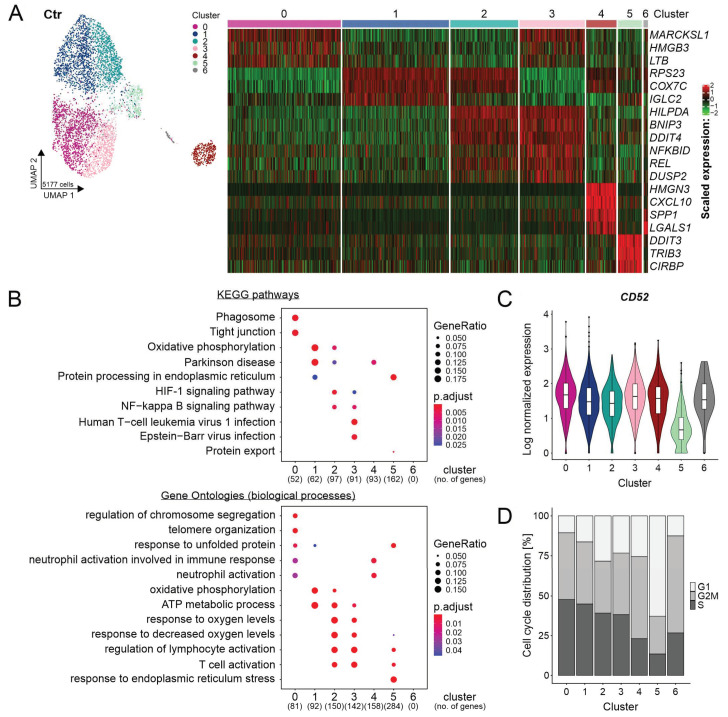
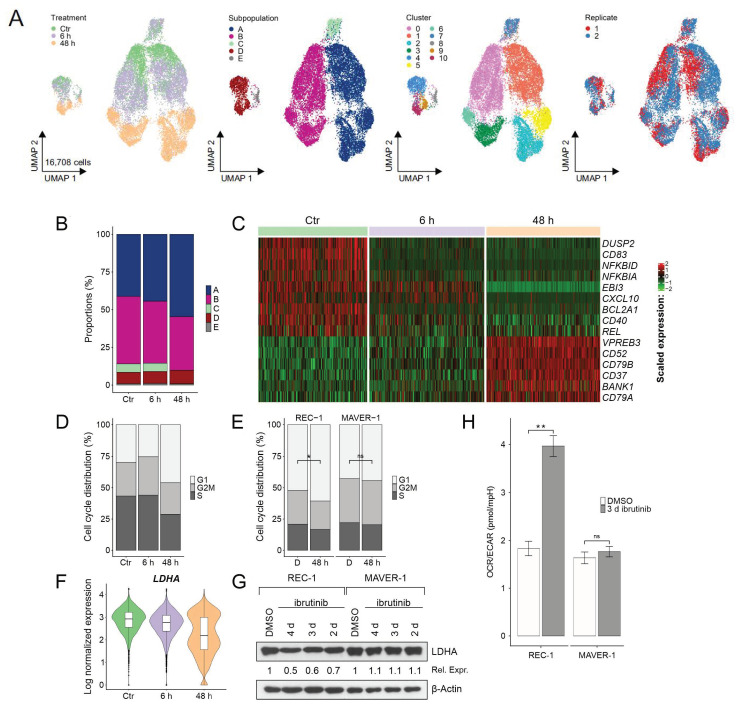
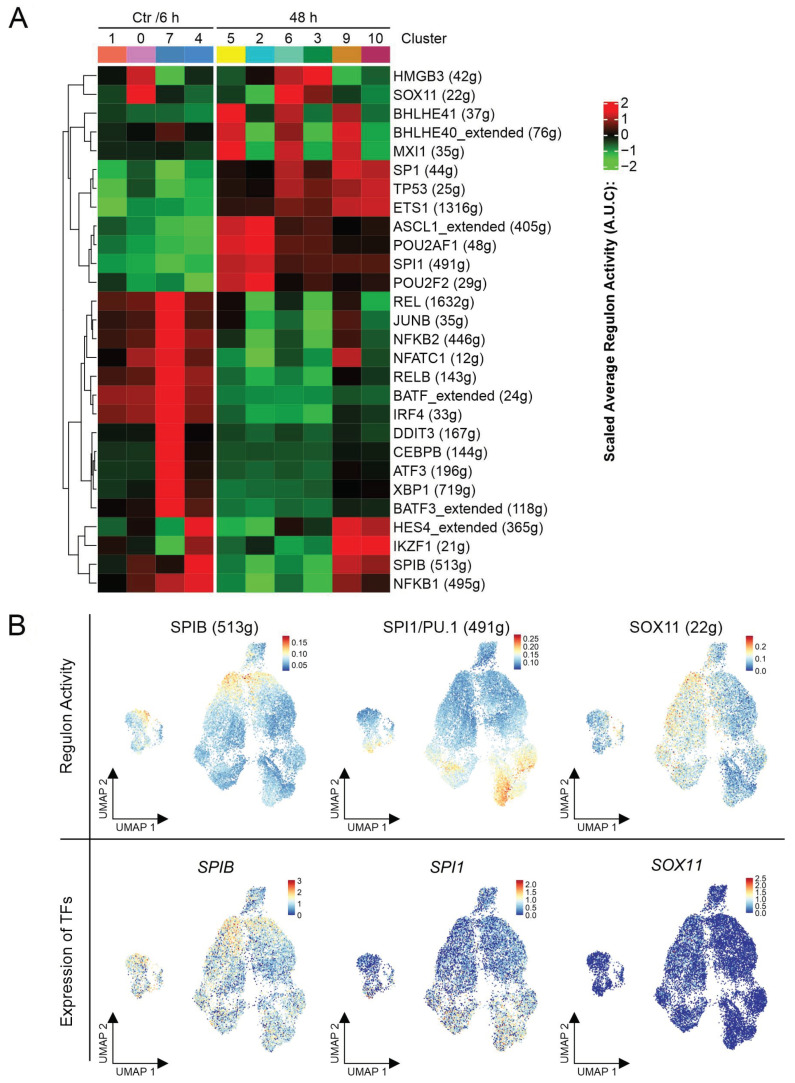
Since the approval of ibrutinib for relapsed/refractory mantle cell lymphoma (MCL), the treatment of this rare mature B-cell neoplasm has taken a great leap forward. Despite promising efficacy of the Bruton tyrosine kinase inhibitor, resistance arises inevitably and the underlying mechanisms remain to be elucidated. Here, we aimed to decipher the response of a sensitive MCL cell line treated with ibrutinib using time-resolved single-cell RNA sequencing. The analysis uncovered five subpopulations and their individual responses to the treatment. The effects on the B cell receptor pathway, cell cycle, surface antigen expression, and metabolism were revealed by the computational analysis and were validated by molecular biological methods. The observed upregulation of B cell receptor signaling, crosstalk with the microenvironment, upregulation of CD52, and metabolic reprogramming towards dependence on oxidative phosphorylation favor resistance to ibrutinib treatment. Targeting these cellular responses provide new therapy options in MCL.
Keywords: drug resistance; ibrutinib; mantle cell lymphoma; scRNA-seq.
Conflict of interest statement
The authors declare no conflict of interest.
Figures
Similar articles
-
CDKN1C-mediated growth inhibition by an EZH1/2 dual inhibitor overcomes resistance of mantle cell lymphoma to ibrutinib.Cancer Sci. 2021 Jun;112(6):2314-2324. doi: 10.1111/cas.14905. Epub 2021 May 1. Cancer Sci. 2021. PMID: 33792119 Free PMC article.
-
[scRNA-sequencing uncovers metabolism and CD52 as new targets in ibrutinib-surviving mantle cell lymphoma cells].Pathologie (Heidelb). 2022 Aug;43(Suppl 1):31-35. doi: 10.1007/s00292-022-01136-7. Epub 2022 Oct 12. Pathologie (Heidelb). 2022. PMID: 36222922 German.
-
miRNA-223-3p modulates ibrutinib resistance through regulation of the CHUK/Nf-κb signaling pathway in mantle cell lymphoma.Exp Hematol. 2021 Nov;103:52-59.e2. doi: 10.1016/j.exphem.2021.08.010. Epub 2021 Aug 30. Exp Hematol. 2021. PMID: 34474146
-
Ibrutinib for the treatment of chronic lymphocytic leukemia and mantle cell lymphoma.Drugs Today (Barc). 2014 Apr;50(4):291-300. doi: 10.1358/dot.2014.50.4.2133570. Drugs Today (Barc). 2014. PMID: 24918646 Review.
-
Ibrutinib resistance in mantle cell lymphoma: clinical, molecular and treatment aspects.Br J Haematol. 2018 May;181(3):306-319. doi: 10.1111/bjh.15108. Epub 2018 Jan 23. Br J Haematol. 2018. PMID: 29359797 Review.
Cited by
-
The Transcriptome of SH-SY5Y at Single-Cell Resolution: A CITE-Seq Data Analysis Workflow.Methods Protoc. 2021 May 6;4(2):28. doi: 10.3390/mps4020028. Methods Protoc. 2021. PMID: 34066513 Free PMC article.
-
Restoration of the immune function as a complementary strategy to treat Chronic Lymphocytic Leukemia effectively.J Exp Clin Cancer Res. 2021 Oct 15;40(1):321. doi: 10.1186/s13046-021-02115-1. J Exp Clin Cancer Res. 2021. PMID: 34654437 Free PMC article. Review.
-
Mechanisms of the role of proto-oncogene activation in promoting malignant transformation of mature B cells.Zhong Nan Da Xue Xue Bao Yi Xue Ban. 2024 Jan 28;49(1):113-121. doi: 10.11817/j.issn.1672-7347.2024.230304. Zhong Nan Da Xue Xue Bao Yi Xue Ban. 2024. PMID: 38615172 Free PMC article. Chinese, English.
References
-
- Mozos A., Royo C., Hartmann E., De Jong D., Baro C., Valera A., Fu K., Weisenburger D.D., Delabie J., Chuang S.S., et al. SOX11 expression is highly specific for mantle cell lymphoma and identifies the cyclin D1-negative subtype. Haematologica. 2009;94:1555–1562. doi: 10.3324/haematol.2009.010264. - DOI - PMC - PubMed
-
- Swerdlow S.H., Campo E., Pileri S.A., Harris N.L., Stein H., Siebert R., Advani R., Ghielmini M., Salles G.A., Zelenetz A.D., et al. The 2016 revision of the World Health Organization classification of lymphoid neoplasms. Blood. 2016;127:2375–2390. doi: 10.1182/blood-2016-01-643569. - DOI - PMC - PubMed
MeSH terms
Substances
LinkOut - more resources
Full Text Sources
Other Literature Sources
Molecular Biology Databases
