. 2021 Feb 25;9(3):485.
doi: 10.3390/microorganisms9030485.

Genome-Wide Mapping Reveals Complex Regulatory Activities of BfmR in Pseudomonas aeruginosa

Affiliations

Genome-Wide Mapping Reveals Complex Regulatory Activities of BfmR in Pseudomonas aeruginosa

Ke Fan et al. Microorganisms. .

Abstract

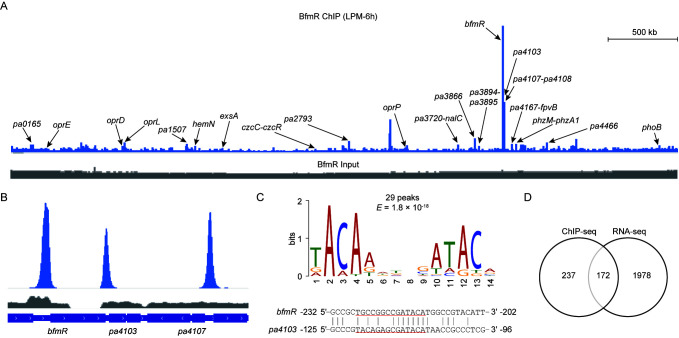
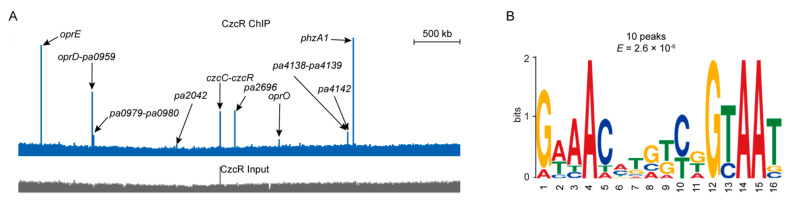
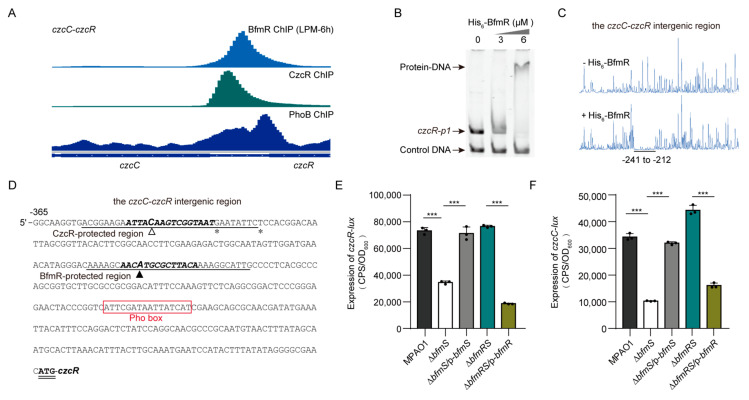
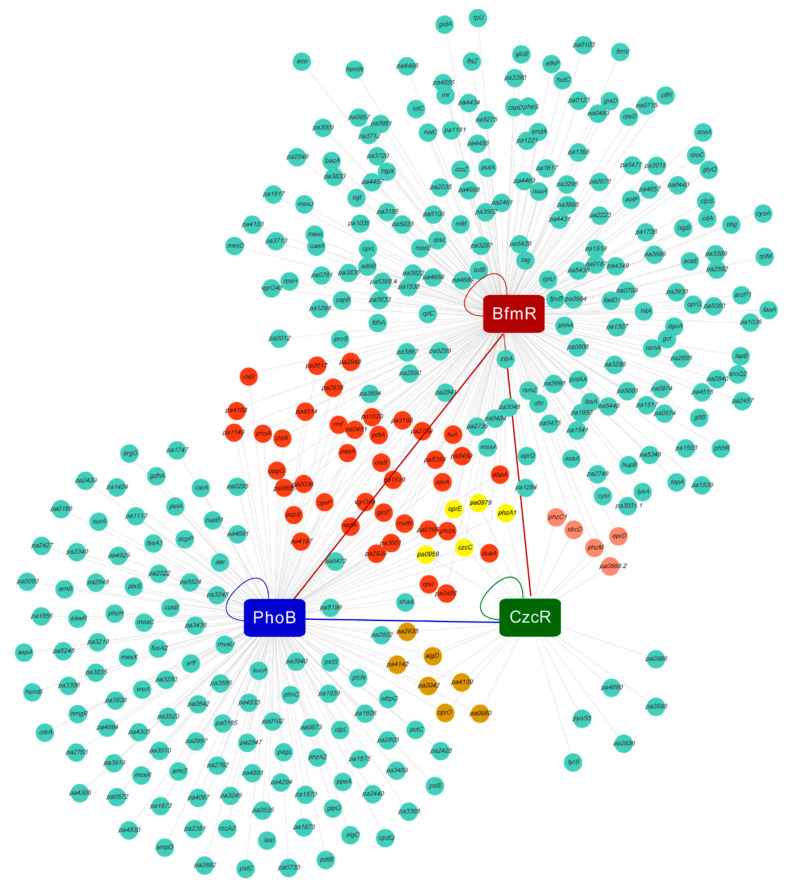
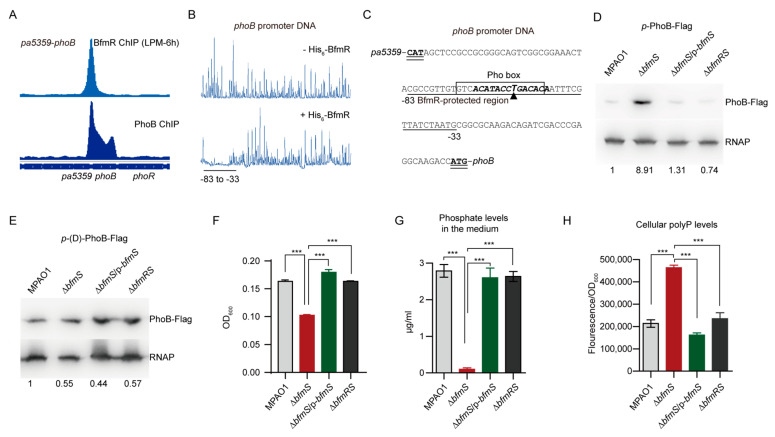
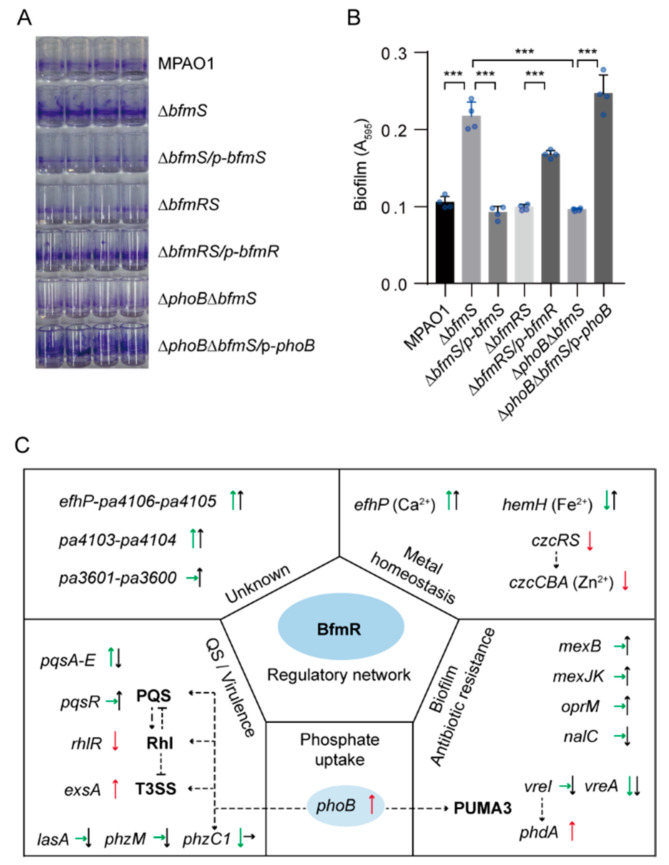
BfmR is a response regulator that modulates diverse pathogenic phenotypes and induces an acute-to-chronic virulence switch in Pseudomonas aeruginosa, an important human pathogen causing serious nosocomial infections. However, the mechanisms of action of BfmR remain largely unknown. Here, using chromatin immunoprecipitation followed by high-throughput sequencing (ChIP-seq), we showed that 174 chromosomal regions of P. aeruginosa MPAO1 genome were highly enriched by coimmunoprecipitation with a C-terminal Flag-tagged BfmR. Integration of these data with global transcriptome analyses revealed that 172 genes in 106 predicted transcription units are potential targets for BfmR. We determined that BfmR binds to and modulates the promoter activity of genes encoding transcriptional regulators CzcR, ExsA, and PhoB. Intriguingly, BfmR bound to the promoters of a number of genes belong to either CzcR or PhoB regulon, or both, indicating that CzcRS and PhoBR two-component systems (TCSs) deeply feed into the BfmR-mediated regulatory network. In addition, we demonstrated that phoB is required for BfmR to promote the biofilm formation by P. aeruginosa. These results delineate the direct BfmR regulon and exemplify the complexity of BfmR-mediated regulation of cellular functions in P. aeruginosa.

Keywords: BfmRS; Pseudomonas aeruginosa; biofilm formation; regulon; two-component system.


Conflict of interest statement

The authors declare no conflict of interest.

Figures

Figure 1
Figure 1
Analysis of BfmR ChIP-seq. (A) A representative image of BfmR ChIP-seq result using Integrated Genome Viewer. Bacteria were cultured in low-phosphate minimal (LPM) for 6 h (LPM-6h). ChIP sample (blue) and input control sample (grey) were shown as indicated. Arrows indicate the gene promoters associated with the ChIP-seq peaks. (B) Pattern of BfmR ChIP-seq peaks for the promoter regions of bfmR, pa4103, and pa4107. (C) The most significant motif generated by the MEME tool [34] using 101 bp centered on the peak summit of the top 30 peak sequences (Data set 1, sheet 1) with default parameter values. The height of each letter represents the frequency of each base in different locations in the consensus sequence. The 14 nt motif was present in 29 BfmR binding sites with an E-value of 1.8 × 10⁻¹⁸ (upper panel). The location of the conserved promoter element generated by MEME (upper panel) on the BfmR-protected region of either bfmR or pa4103 promoter [11] was underlined (lower panel). (D) Venn diagram of integrated ChIP-seq and RNA-seq results showing the direct and indirect targets of BfmR (Data set 2).
Figure 2
Figure 2
Identification of CzcR targets. (A) A representative image of CzcR ChIP-seq result using Integrated Genome Viewer. ChIP sample (blue) and the input control sample (grey) were shown. Arrows showing the ChIP-seq peaks located in the promoters of the indicated genes. (B) The most significant motif was generated by the MEME tool using 101 bp centered on the peak summits of the top 10 peak sequences (Data set 1, sheet 8), with minimum width as 3 and other parameters as default. The height of each letter represents the frequency of each base in different positions in the consensus sequence. The 16 nt motif was present in all the 10 tested CzcR binding sites with an E-value of 2.6 × 10⁻⁶.
Figure 3
Figure 3
BfmR binds to and inhibits the promoter activity of czcR and czcC. (A) Pattern of BfmR, CzcR, and PhoB ChIP-seq peaks for the czcC-czcR intergenic region. The PhoB ChIP data were obtained from NCBI Gene Expression Omnibus (GEO) database under accession number GSE128430 [58]. (B) EMSA showing that the N-terminal His6-tagged BfmR (His6-BfmR) binds to the promoter of czcR (i.e., czcR-p1). DNA fragments C-bfmR serves as a negative control. (C) Electropherograms show the protection pattern of the czcC-czcR intergenic region after digestion with DNase I following incubation in the absence (-) and presence (+) of His6-BfmR (6 μM). The protected regions (relative to the start codon of czcR) are underlined. (D) czcR promoter sequence with a summary of the results of DNase I footprint assays and ChIP-seq experiments. The CzcR- and BfmR-protected regions are underlined as indicated and the asterisk shows the DNase I hypersensitivity site described in Figure S2E. Hollow and solid triangle indicates the location of the summits of CzcR- and BfmR ChIP-seq peaks, respectively. The potential Pho box [59] is highlighted by square frame, and the starting codon (ATG) of czcR is in bold and double underlined. Sequences that match the MEME motif of CzcR (see in Figure 2B) and BfmR (see in Figure 1C) are in bold and italic. (E,F) The promoter activity of czcR (in E) and czcC (in F) in wild type (WT) MPAO1 and its derivatives grown in MM supplemented with 50 μM ZnCl2 at 37 °C for 6 h. Data points are shown in black dots, and results represent means ± SD (n = 3 biological replicates; *** p < 0.001, Student’s two-tailed t-test). MPAO1, ΔbfmS, and ΔbfmRS harboring an empty pAK1900 vector as a control; p-bfmS and p-bfmR respectively denote pAK1900-bfmS and pAK1900-bfmR (Table S1).
Figure 4
Figure 4
Visualization of promoters bound by BfmR, PhoB, and CzcR. Red circle denotes gene (or the first gene in an operon) whose promoter is co-regulated by BfmR and PhoB; yellow circle, gene co-regulated by BfmR, PhoB, and CzcR; pink circle, co-targeted by BfmR and CzcR; brown circle, co-targeted by PhoB and CzcR. The lines show the connection between the transcription factors and promoters. The curved line represents the binding of the transcription factor to its own promoter [11,53,58,64]. Red lines show the binding of BfmR to the promoters phoB and czcR (Figure 1B, Figure 3A and Figure 5A); Blue line show the binding of PhoB to czcR promoter (Figure 3A and Figure 5A). See Data set 4, Sheet 1 for details.
Figure 5
Figure 5
BfmR binds to and activates phoB promoter. (A) BfmR and PhoB ChIP-seq signals in phoB promoter. The PhoB ChIP data were obtained from GEO (accession number GSE128430) [58]. (B) Electropherogram shows the protection pattern of the phoB promoter DNA after digestion with DNase I following incubation without or with His6-BfmR (6 μM). The protected regions (relative to the start codon of phoB) are underlined. (C) Intergenic sequence of pa5358 and phoB with a summary of the results of DNase I footprint assays and ChIP-seq experiments. The BfmR-protected region (relative to the start codon of phoB) is underlined; triangle showing the location of the peak summit for BfmR ChIP-seq; sequences that match the MEME motifs of BfmR (see in Figure 1C) are in bold and italic. The potential Pho box [59] is highlighted by square frame, and the starting codons of pa5359 and phoB are in bold and double underlined. (D,E) Western blot assays showing the production of PhoB-Flag in P. aeruginosa MPAO1 and its derivatives grown in tubes containing LPM at 37 °C with shaking for 6 h. The FLAG-tagged PhoB fusion gene is under the control of a native (in D) or a mutant phoB promoter (in E, lack of GACACA in the BfmR-protected region). The Western blot band intensity of PhoB-Flag was normalized to the intensities obtained with RNA polymerase (RNAP) (used as a loading control) and the results are reported as fold changes with the WT MPAO1 set to 1. MPAO1, ΔbfmS, and ΔbfmRS harbor an empty pAK1900 vector as a control; p-bfmS denotes pAK1900-bfmS (Table S1). Data are representative of three biological replicates. (F) The growth of P. aeruginosa MPAO1 and its derivatives. Bacteria were grown for 24 h in LPM medium. Results represent means ± SD (n = 3 biological replicates; *** p < 0.001, Student’s two-tailed t-test); OD600, an optical density at 600 nm. (G) Phosphate removal from the medium. Bacteria were grown for 24 h in LPM medium, and the phosphate level in the spent medium was measured. The initial level of phosphate in the LPM medium is 28 µg/mL (0.3 mM). (H) Measurements of the polyphosphate (polyP) level in WT MPAO1 and its derivatives grown in LPM medium at 37 °C for 24 h. The polyP was quantified using 4’,6’-diamidino-2-phenylindole (DAPI) fluorescence as described in Methods. In (F and G), MPAO1, ΔbfmS, and ΔbfmRS harbor an empty pAK1900 vector as a control; p-bfmS denotes pAK1900-bfmS (Table S1); results represent means ± SD (n = 3 biological replicates; *** p < 0.001, Student’s two-tailed t-test).
Figure 6
Figure 6
Biofilm formation assays and a proposed model of BfmR regulatory network. (A) Photograph showing ring-shape biofilms (stained by 1% crystal violet) near the air–liquid interface on the inner surface of polystyrene StripwellTM Microplate. (B) Quantification of biofilm formation in (A) by measuring the OD595 of the dye solubilized from stained biofilm. A595, absorbance at 595 nm as an indirect measure of biofilm biomass. MPAO1, ΔbfmS, ΔbfmRS, and ΔphoBΔbfmS harbor an empty pAK1900 vector as a control; p-bfmS, p-bfmR, and p-phoB respectively denote pAK1900-bfmS, pAK1900-bfmR, and pAK1900-phoB plasmids (Table S1). Data points are shown in blue dots, and results represent means ± SD (n = 4 biological replicates; *** p < 0.001, Student’s two-tailed t-test). (C) Proposal model of BfmR regulatory network. Some selected BfmR-targeted genes (operon) are shown. ChIP-seq signal was also observed for the promoters of rhlR, phdA, and vreAIR operon while it does not meet the threshold for defining BfmR targets (see detail in Figures S6A and S7A). The arrow indicates the effect of BfmR on gene expression (up arrow indicates up-regulation, down arrow indicates down-regulation, and the right arrow indicates no observed effect). Green and black arrows indicate differential gene expression according to RNA-seq experiments at 6 h and 24 h, respectively; red arrow indicates differential gene expression according to either the promoter assays in this study (Figure 3E,F, Figure 5D and Figure S4C) or the results of published data [11,18]. The dotted line shows the interaction between the players: arrow, activation; hammerheads, repression.

References

    1. Stover C.K., Pham X.Q., Erwin A.L., Mizoguchi S.D., Warrener P., Hickey M.J., Brinkman F.S.L., Hufnagle W.O., Kowalik D.J., Lagrou M., et al. Complete genome sequence of Pseudomonas aeruginosa PAO1, an opportunistic pathogen. Nature. 2000;406:959–964. doi: 10.1038/35023079. - DOI - PubMed
    1. National Nosocomial Infections Surveillance System National Nosocomial Infections Surveillance (NNIS) system report, data summary from January 1992 through June 2004, issued October 2004. Am. J. Infect. Control. 2004;32:470–485. doi: 10.1016/j.ajic.2004.10.001. - DOI - PubMed
    1. Willyard C. The drug-resistant bacteria that pose the greatest health threats. Nature. 2017;543:15. doi: 10.1038/nature.2017.21550. - DOI - PubMed
    1. Tacconelli E., Carrara E., Savoldi A., Harbarth S., Mendelson M., Monnet D.L., Pulcini C., Kahlmeter G., Kluytmans J., Carmeli Y., et al. Discovery, research, and development of new antibiotics: The WHO priority list of antibiotic-resistant bacteria and tuberculosis. Lancet Infect. Dis. 2018;18:318–327. doi: 10.1016/S1473-3099(17)30753-3. - DOI - PubMed
    1. Clatworthy A.E., Pierson E., Hung D.T. Targeting virulence: A new paradigm for antimicrobial therapy. Nat. Chem. Biol. 2007;3:541–548. doi: 10.1038/nchembio.2007.24. - DOI - PubMed