. 2021 Feb 25;11(3):282.
doi: 10.3390/brainsci11030282.

Intensity of Respiratory Cortical Arousals Is a Distinct Pathophysiologic Feature and Is Associated with Disease Severity in Obstructive Sleep Apnea Patients

Affiliations

Intensity of Respiratory Cortical Arousals Is a Distinct Pathophysiologic Feature and Is Associated with Disease Severity in Obstructive Sleep Apnea Patients

Katharina Bahr et al. Brain Sci. .

Abstract

Background: We investigated whether the number, duration and intensity of respiratory arousals (RA) on C3-electroencephalographic (EEG) recordings correlate with polysomnography (PSG)-related disease severity in obstructive sleep apnea (OSA) patients. We also investigated if every patient might have an individual RA microstructure pattern, independent from OSA-severity.

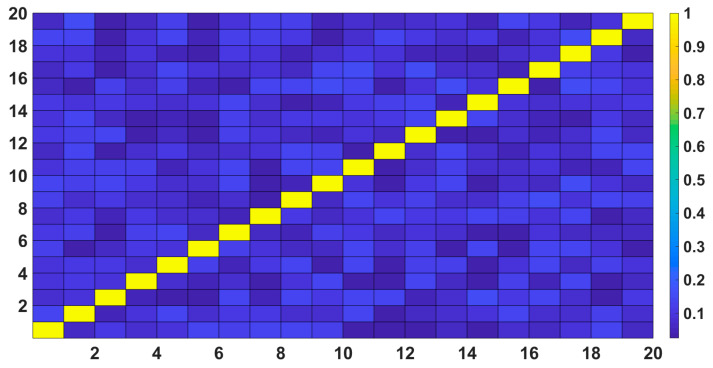
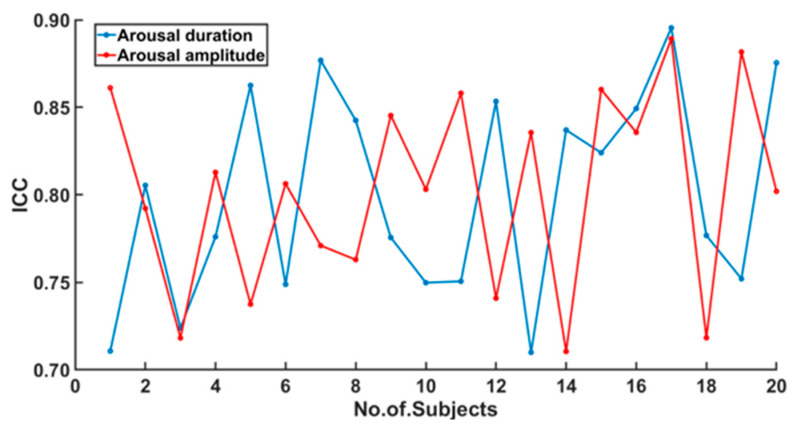
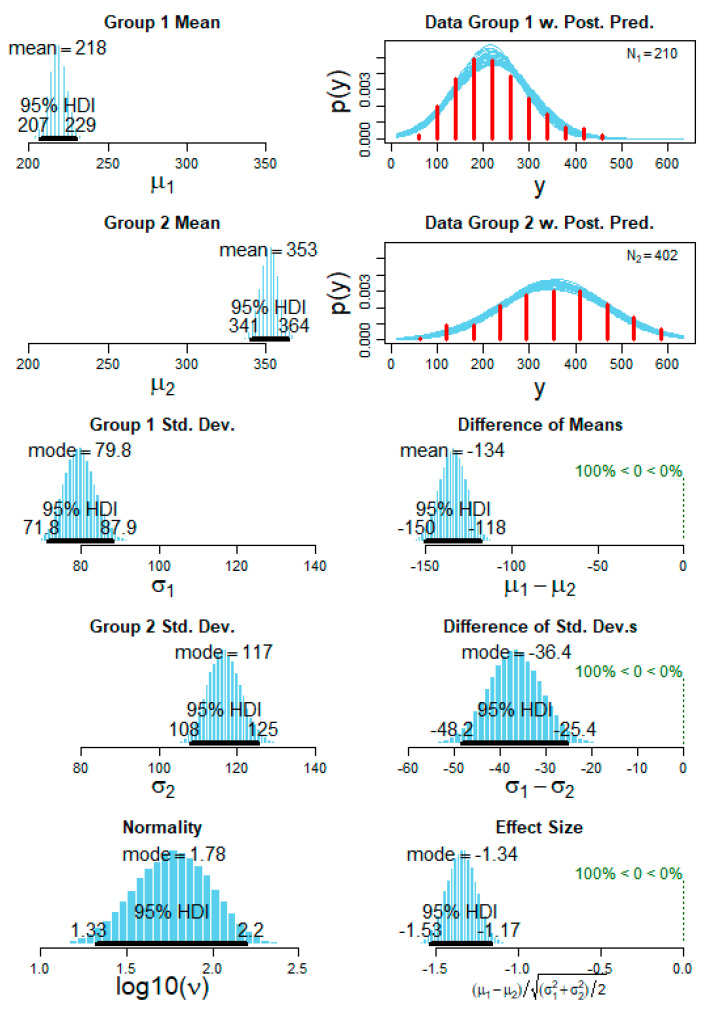
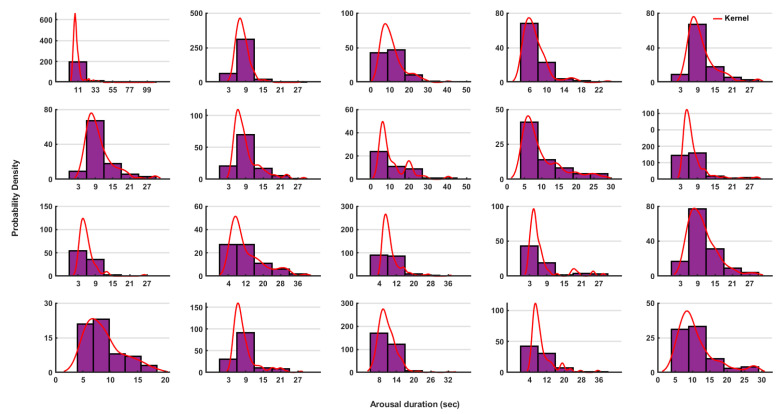
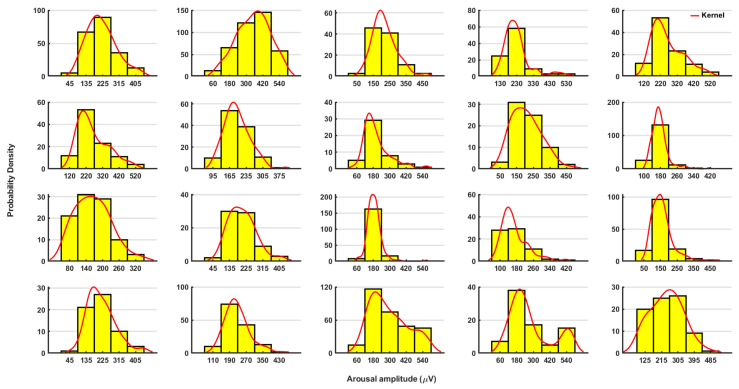
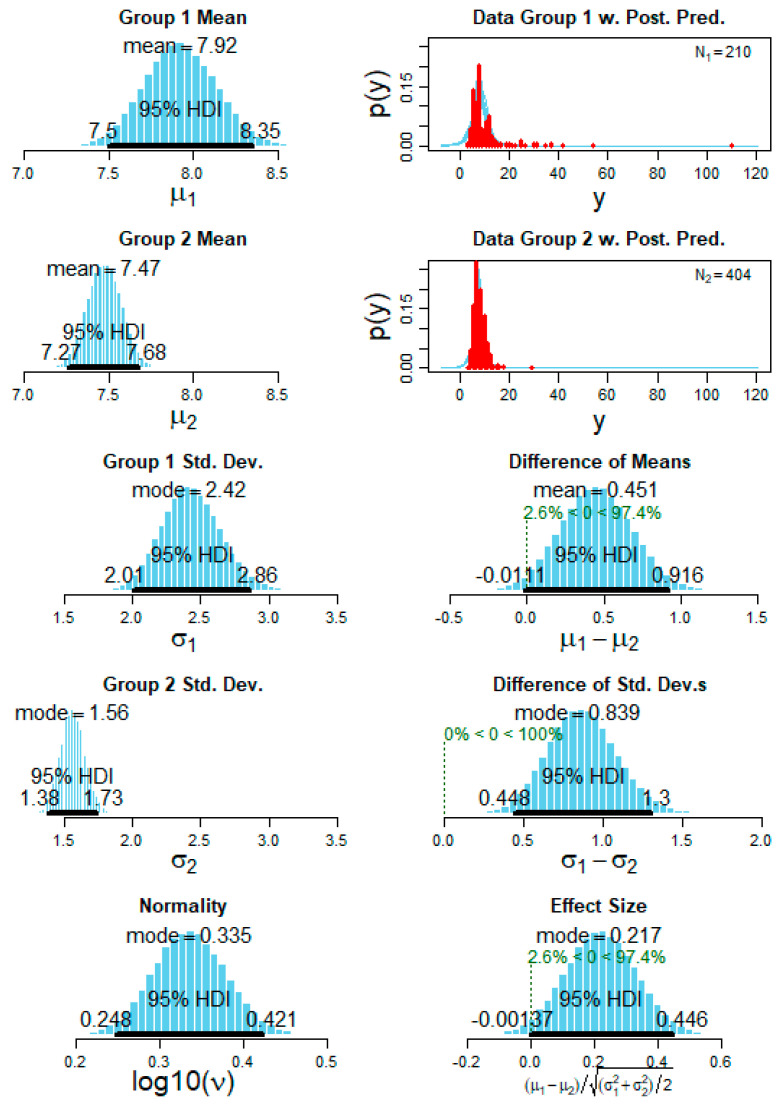
Methods: PSG recordings of 20 OSA patients (9 female; age 27-80 years) were analyzed retrospectively. Correlation coefficients were calculated between RA microstructure (duration, EEG-intensity) and RA number and respiratory disturbance index (RDI), oxygen desaturation index (ODI) and arousal index (AI). Intraclass correlations (ICC) for both RA duration and intensity were calculated. Sleep stage-specific and apnea- and hypopnea-specific analyses were also done. The probability distributions of duration and intensity were plotted, interpolated with a kernel which fits the distribution. A Bayesian posterior distribution analysis and pair-wise comparisons of each patient with all other 19 patients were performed.

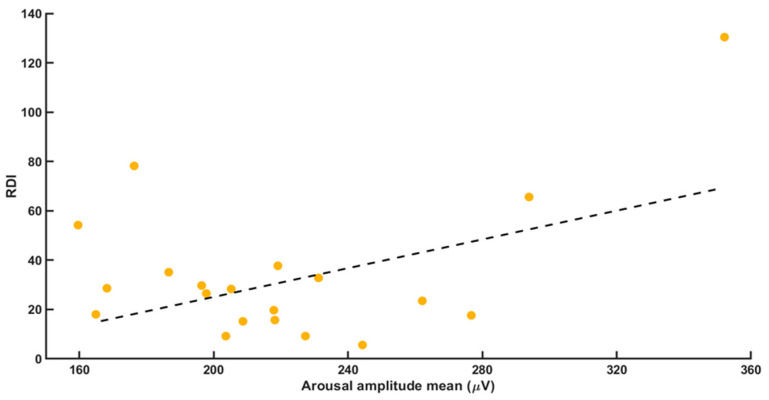
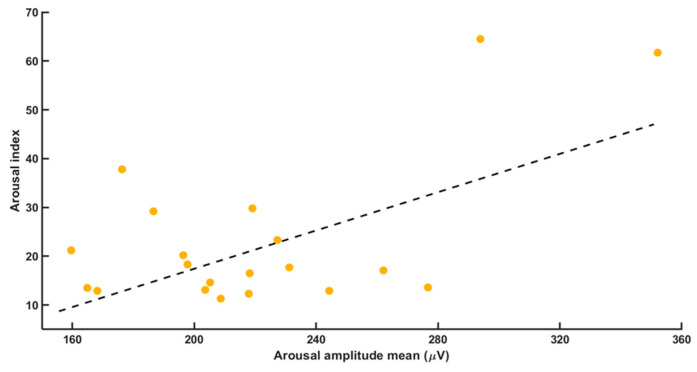
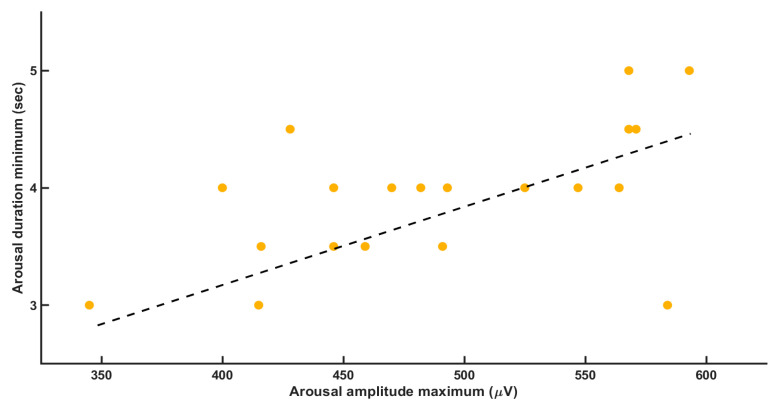
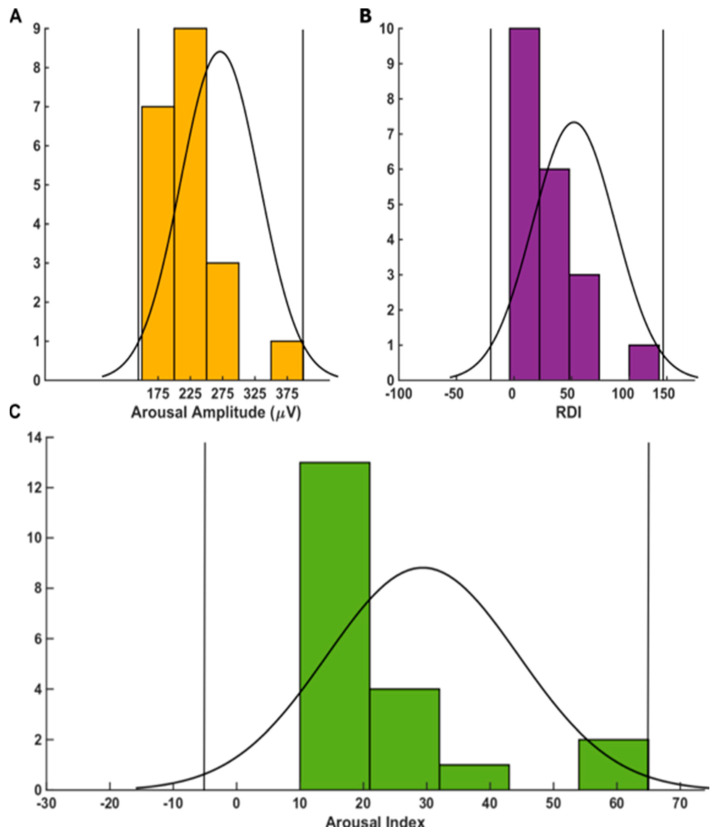
Results: Of the analyzed 2600 RA, strong positive correlations were found between average RA intensity and both RDI and AI. The number of PSG-recorded RA was strongly positively correlated with RDI. Significant correlations between average RA intensity in REM, NREM2 and NREM3 sleep stages and total ODI were identified. No sleep stage-specific correlations of arousal microstructure with age, sex, RDI or AI were identified. Although between-subjects ICC values were <0.25, within-subject ICC values were all >0.7 (all p < 0.05). While apnea-related RA duration did not differ from hypopnea-related RA duration, RA intensity was significantly higher (p = 0.00135) in hypopneas than in apneas. A clear individual pattern of arousal duration for each patient was made distinct. For arousal intensity, a Gaussian distribution was identified in most patients. The Bayesian statistics regarding the arousal microstructure showed significant differences between each pair of patients.

Conclusions: Each individual patient with OSA might have an individual pattern of RA intensity and duration indicating a distinct individual pathophysiological feature. Arousal intensity was significantly higher in hypopneic than in apneic events and may be related causally to the diminished (compared to apneas) respiratory distress associated with hypopneas. RA intensity in REM, NREM2 and NREM3 strongly correlated with ODI.

Keywords: arousal; microstructure; respiratory; sleep apnea; sleep-disturbed breathing.


Conflict of interest statement

The authors declare no conflict of interest.

Figures

Figure 1
Figure 1
The correlation between the variables mean arousal amplitude and the RDI. We found a positive correlation with r = 0.446 and p = 0.038.
Figure 2
Figure 2
The correlation between the variables mean arousal amplitude and the RDI. We found a positive correlation with r = 0.446 and p = 0.038.
Figure 3
Figure 3
It shows the correlation between the variables arousal amplitude maximum and the arousal duration. We found a positive correlation with r = 0.534 and p = 0.0015.
Figure 4
Figure 4
Outlier analyses based on the probability distributions of the measured parameters for each group. We set a 95% threshold to determine the outlier in the analyses. The parameters are arousal mean amplitude in (A), followed by RDI in (B), and the arousal index in (C).
Figure 5
Figure 5
The plots below show the between-subjects ICC as a correlation matrix; except the diagonal all the other values were below (0.25) and was not significant (all p > 0.05).
Figure 6
Figure 6
The within-subjects ICC values for each subject were plotted separately for the two parameters arousal amplitude (red) and arousal duration (blue). The ICC values were all above 0.7 and showed a significant within subject correlation (all p < 0.05).
Figure 7
Figure 7
Calculation of the arousal duration and arousal amplitude separately based on the apnea and hypopnea. For the arousal duration we did not find any significant difference at the group level. However, the arousal amplitude (i.e., intensity) was significantly (p = 0.00135) higher in hypopnea-related arousals.
Figure 8
Figure 8
The probability distributions of the arousal duration (in seconds) are shown for each patient separately. The histogram depicted in violet color and the interpolated kernels are shown in red color. The respective values showed a log-normal distribution.
Figure 9
Figure 9
The probability distribution of the arousal amplitude (in µV) is shown for each patient separately. The histogram depicted in yellow color and the interpolated kernels are shown in red color. The patients showed a normal (Gaussian) distribution. The number of bins was chosen as n = 5.
Figure 10
Figure 10
A representative example of the Bayesian statistics of the posterior predictive distribution (PPD) for the variable arousal amplitude. The first column (top to bottom) shows the subject 1 mean PPD, subject 2 mean PPD followed by standard deviation of each subject and finally the normality PPD for the datasets. The second column (top to bottom) shows the subject 1 raw values distribution with the interpolated kernel (N1 = 210 arousals for subject 1) and the subject 2 raw values distribution (N2 = 402 arousals for subject 1) followed by the difference of the means and standard deviation and finally checking the effect size for the comparison of the two subjects’ data. The difference of means shows a clear distinction of (100%) between the two subjects and also the standard deviation showed a clear distinction with (100%). For all the PPD graphs, the 95% highest density interval (HDI) is shown as dark black lines.

References

    1. Eckert D.J., Younes M.K. Arousal from sleep: Implications for obstructive sleep apnea pathogenesis and treatment. J. Appl. Physiol. 2014;116:302–313. doi: 10.1152/japplphysiol.00649.2013. - DOI - PubMed
    1. Catcheside P.G., Jordan A.S. Reflex tachycardia with airway opening in obstructive sleep apnea. Sleep. 2013;36:819–821. doi: 10.5665/sleep.2698. - DOI - PMC - PubMed
    1. Chamberlin N.L. Brain circuitry mediating arousal from obstructive sleep apnea. Curr. Opin. Neurobiol. 2013;23:774–779. doi: 10.1016/j.conb.2013.06.001. - DOI - PMC - PubMed
    1. Berry R., Brooks R., Gamaldo C., Harding S.M., Lloyd R.M., Marcus C.L., Vaughn B.V. AASM Manual for the Scoring of Sleep and Associated Events: Rules, Terminology and Technical Specifications. American Academy of Sleep Medicine; Darien, IL, USA: 2007.
    1. Amatoury J., Jordan A.S., Toson B., Nguyen C., Wellman A., Eckert D.J. New insights into the timing and potential mechanisms of respiratory-induced cortical arousals in obstructive sleep apnea. Sleep. 2018;41 doi: 10.1093/sleep/zsy160. - DOI - PMC - PubMed

LinkOut - more resources