. 2021 Feb 16;11(2):509.
doi: 10.3390/ani11020509.

Descriptive Histopathological and Ultrastructural Study of Hepatocellular Alterations Induced by Aflatoxin B1 in Rats

Affiliations

Descriptive Histopathological and Ultrastructural Study of Hepatocellular Alterations Induced by Aflatoxin B1 in Rats

Fatma Abo Zakaib Ali et al. Animals (Basel). .

Abstract

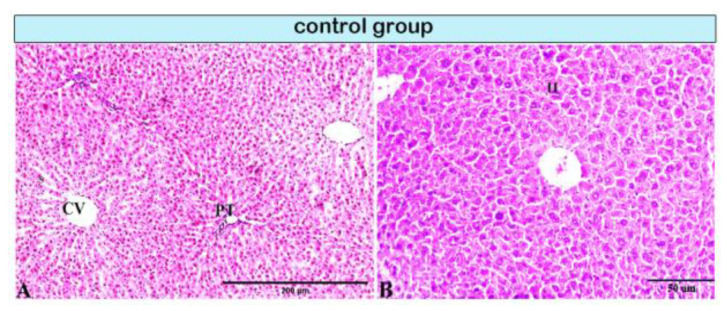
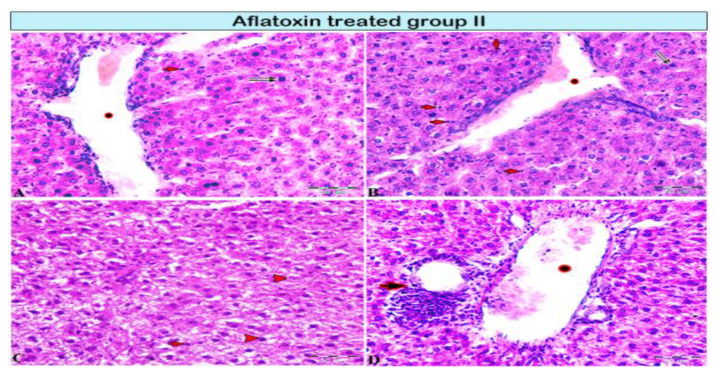
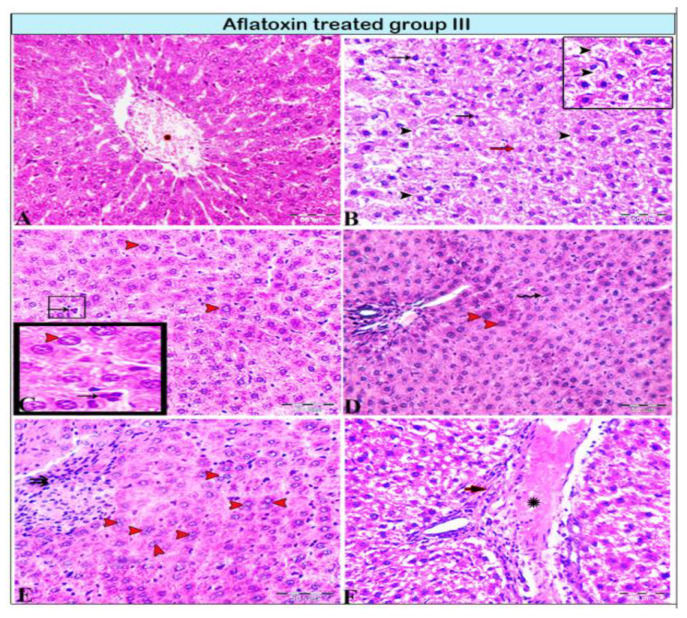
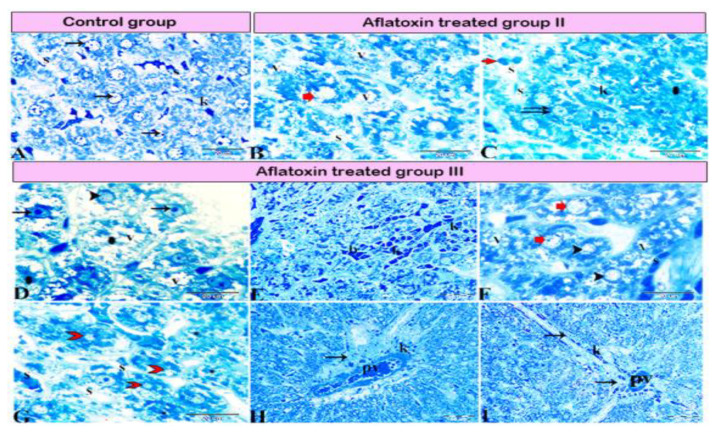
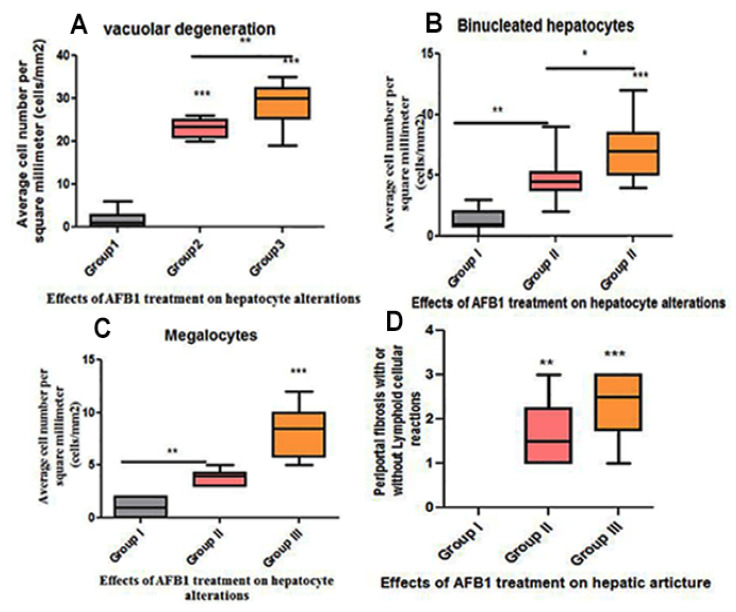
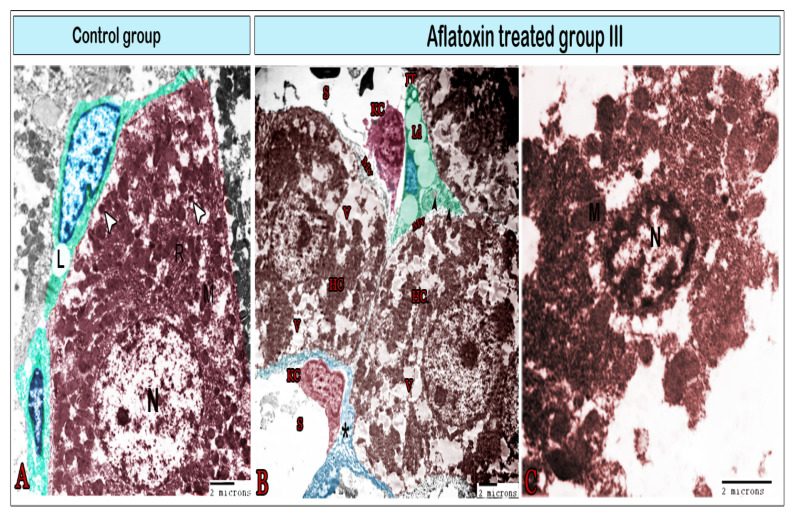
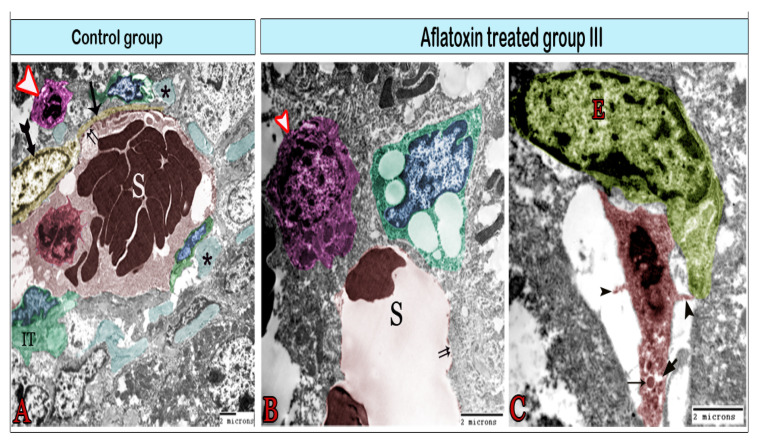
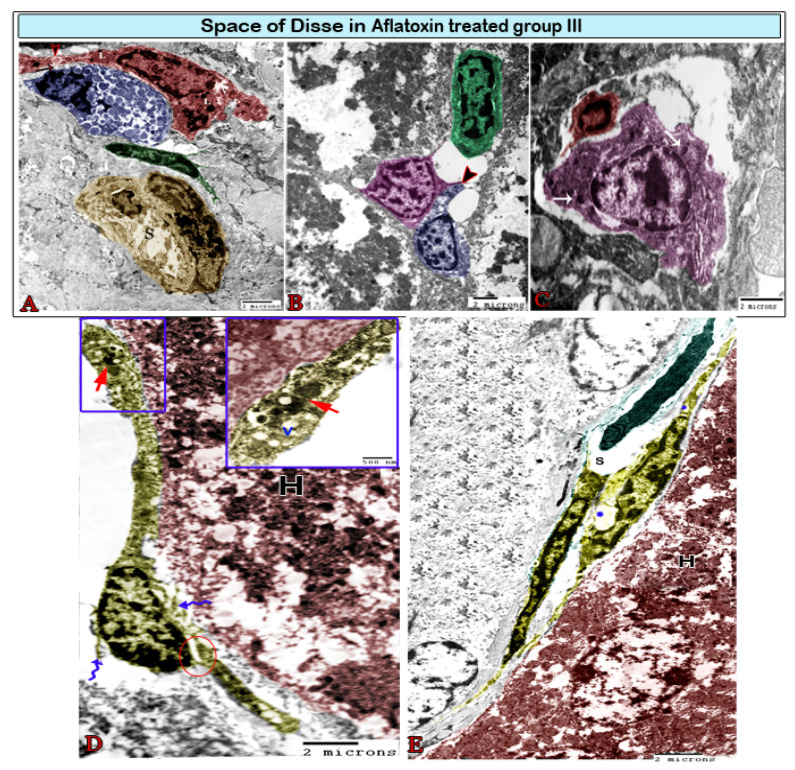
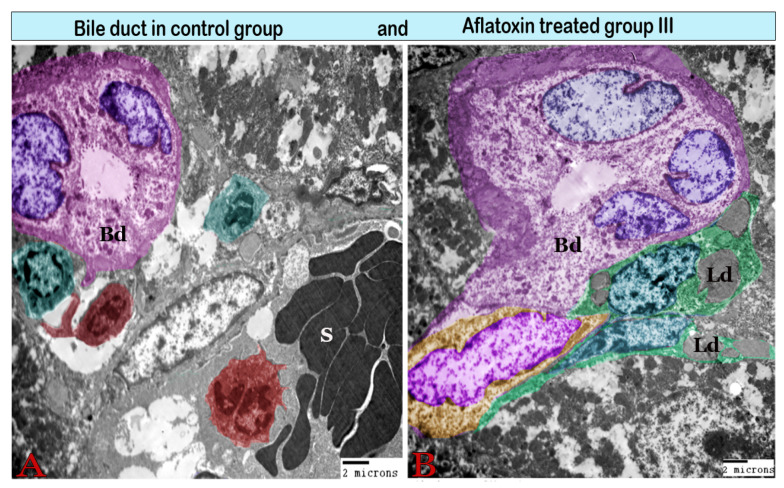
Liver sinusoids are lined by fenestrated endothelial cells surrounded by perisinusoidal cells, Kupffer cells, and pit cells, as well as large granular lymphocytes. The functional ability of the liver cells can be substantially modified by exposure to toxins. In the current work, we assessed the histopathological and ultrastructural effects of a time-course exposure to aflatoxin B1 (AFB1) on the hepatic structures of rats. A total of 30 adult female Wistar rats were randomly divided into three groups: a control group, a group orally administered 250 µg/kg body weight/day of AFB1 for 5 days/week over 4 weeks, and a group that received the same AFB1 treatment but over 8 weeks. Histopathological and ultrastructural examinations of hepatocytes revealed massive vacuolar degeneration and signs of necrosis. Furthermore, the rat liver of the treated group exhibited damage to the sinusoidal endothelium, invasion of the space of Disse with hyperactive Kupffer cells, and some immune cells, as well as Ito cells overloaded with lipids. In addition, damaged telocytes were observed. Taken together, our results indicate that AFB1 induces irreversible adverse effects on the livers of rats.

Keywords: Ito cells; Kupffer cells; aflatoxin B1; fibrosis; necrosis; ultrastructure.


Conflict of interest statement

The authors declare no conflict of interest.

Figures

Figure 1
Figure 1
Photomicrograph of a rat liver in the control group demonstrating normal hepatic architectures. (A) Central vein (CV), sinusoids (S), and intact portal tirade (PT). (B) Hepatocytes (H).
Figure 2
Figure 2
Photomicrograph of a rat liver in aflatoxin B1-treated group II (4-week treatment). (A,B) Central vein dilation (star), mononuclear cell infiltration (red arrows), cellular necrosis (pyknotic nucleus; double black arrow), incomplete mitotic division (A: black arrow). (C) Vacuolar degeneration of hepatocytes (red arrowheads). (D) Interlobular vein extensively dilated and congested with blood (star), periportal interlobular bile duct fibrosis with focal mononuclear cellular infiltration (arrow).
Figure 3
Figure 3
Photomicrograph of a rat liver in aflatoxin B1-treated group III (8-week treatment). (A) Extensive central vein congestion and thrombosis (star). (B) Vacuolar degeneration of hepatocytes (black arrowheads, magnified in the black square) and hepatocellular necrosis; pyknotic cellular nucleus (black arrows) or karyolitic nucleus (red arrow). (C,D) Hepatic megalocytes (red arrowheads), abnormalities in mitosis with tripolar mitosis (C: squares and black arrows, respectively), and Kupffer cell proliferation (D: black arrows). (E) Degenerated binucleated hepatocytes (red arrowheads); a focal area of necrosis; several adjacent hepatocytes are absent and replaced by inflammatory cells (double arrows). (F) Marked dilatation in the portal vein (star) with periportal fibrosis (arrow).
Figure 4
Figure 4
Photomicrograph of a semi-thin section stained with Toluidine blue. (A) Normal hepatocytes (arrows) with narrow blood sinusoids (S) in between; note the presence of Kupffer cells (K) in the sinusoids. (B,C) Aflatoxin B1-treated rat from group II. (B) hepatocellular vacuolar degeneration (V), dilated sinusoids (S), and presence of hepatic megalocytes (red arrow). (C) Binucleated hepatocytes (double arrow), incomplete mitotic division (red arrow), area of necrosis (star), dilated sinusoids (S), and marked Kupffer cell (K) proliferation inside the lumen. (DI) AFB1-treated rat from group III. (D) Severe hepatocellular vacuolar degeneration (V), some hepatocytes with basophilic bodies (arrows), vesicular nuclei (arrowhead), and other hepatocytes showing necrosis with karyolitic nuclei (stars). (E) Sinusoids dilated and filled with blood (b) and marked Kupffer cell (K) proliferation inside the sinusoidal lumen. (F) Hepatocellular vacuolar degeneration (V), presence of hepatic megalocytes (red arrows), and necrotic hepatocytes (arrowheads). (G) Hepatocellular necrosis (red arrowhead) with notable areas of cellular necrosis and lost detail (star). (H) Severe periportal fibrosis (arrow), with the portal vein (PV) engorged with blood, severe fibrosis, and marked Kupffer cell proliferation (K). (I) Marked fibrosis around the portal vein (PV), which diffused inside the hepatic lobule forming tracts of fibrosis (arrows).
Figure 5
Figure 5
Histomorphometry graph showing semiquantitative measurements of hepatocyte changes among experimental groups. (A) Vacuolar degeneration; (B) binucleated hepatocytes; (C) average megalocytes (cells/mm2) among the groups; and (D) periportal fibrosis score with or without periportal lymphocytic cellular reaction. Data are expressed as means ± standard deviations. Significant differences vs. the control group are marked by different asterisks through one-way ANOVA with Tukey’s post hoc test: * p ≤ 0.05, ** p ≤ 0.01, *** p ≤ 0.001).
Figure 6
Figure 6
Digital colored transmission electron microscopy micrographs of the control group (A) and aflatoxin B1-treated group III (B,C). (A) Normal hepatocytes with a large round nucleus (N); cytoplasm contains the mitochondria (M), rER, and lysosomes (arrowheads); Ito cells (green color) surrounding the hepatocyte contain lipid droplets (L). (B) Hepatocytes (HC) demonstrated exaggerated amounts of vacuoles (V); microvilli (MV) on their surface; Ito cells (IT) with a significant increase in lipid droplets (Lp) that condense the nucleus (blue), and collagen bundles within the cell (arrowheads). Kupffer cells (KC) were observed within the sinusoids (s), which were surrounded by a thick layer of fibrous tissue (*). (C) Necrotic hepatocyte exhibiting vacuolation, karyolysis, plasma membrane rupture, and release of cellular contents (note the nucleus (N) and mitochondria (M)).
Figure 7
Figure 7
Digital colored transmission electron microscopy micrographs of the control group (A) and aflatoxin B1-treated group III (B,C). (A) Blood sinusoid (S) lined with fenestrated endothelium (double arrows). The lumen of the sinusoid contains Kupffer cells (red). The blood sinusoid is surrounded by telocytes (TCs; yellow), Ito cells (IT) containing fat droplets, and pit cells (arrowhead). Note the TCs’ cell body (biforked arrow), telopodes (arrow), and bundles of collagen fibers (*). (B) Blood sinusoid in the aflatoxin B1-treated group exhibiting a large gap in the endothelial lining (double arrows). It is surrounded by enlarged pit cells (arrowhead) and Ito cells (IT) which are overloaded with large fat droplets. (C) Kupffer cells (red) are located within the sinusoid and attached to the endothelial cell (E) through its cytoplasmic extensions (arrowheads). They contain lysosomes (arrow) and vacuoles (V).
Figure 8
Figure 8
Digital colored transmission electron microscopy micrographs of the space of Disse in aflatoxin B1-treated group III. (A) Hyperactive large Kupffer cells (red) sending long processes and containing numerous heterogeneous lysosomes (L) and phagosomes (arrowhead). They are in contact (arrow) with mast cells (blue), which are easily recognizable by their granulations; note the blood sinusoids (S) surrounded by pericytes (green), which are considered to be modified perisinusoidal cells. (B) Plasma cells (green) in association with dendritic cells (magenta), which send out their processes (arrowhead) and come into contact with lymphocytes (blue). (C) Pit cells (magenta) in contact with Kupffer cells (red). They are recognizable by their dense granules (arrow). (D) The telocytes (TCs; yellow) surrounding the hepatocyte (H) had cell bodies encircled by dissolute plasma membranes (wavy arrows) and partially dissociated TPs (circle). TPs contain cytoplasmic vacuoles (v) and heterogeneous lysosomes (red arrow). (E) TCs (yellow) exhibiting direct homocellular contact with other TCs. They were characterized by the small perinuclear cytoplasm located between the blood sinusoid (S) and hepatocyte (H), and their cytoplasm contained vacuoles (*).
Figure 9
Figure 9
Digital colored transmission electron microscopy micrographs of a cross section of a bile duct (Bd) from the control group (A) and aflatoxin B1-treated group III (B). (A) Normal interlobular bile duct surrounded by Kupffer cells (red) and pit cells (green); note the lumen (L) and bile duct epithelium (E). (B) Large interlobular bile duct encircled by a thick fibrous sheath. It is surrounded by Ito cells (green), which are loaded with large lipid droplets (Ld).

References

    1. Sana S., Anjum A.A., Yaqub T., Nasir M., Ali M.A., Abbas M. Molecular Approaches for Characterization of Aflatoxin Producing Aspergillus flavus Isolates from Poultry Feed. Pak. Vet. J. 2019;39:169–174. doi: 10.29261/pakvetj/2019.031. - DOI
    1. Ismail A., Gonçalves B.L., de Neeff D.V., Ponzilacqua B., Coppa C.F., Hintzsche H., Sajid M., Cruz A.G., Corassin C.H., Oliveira C.A. Aflatoxin in foodstuffs: Occurrence and recent advances in decontamination. Food Res. Int. 2018;113:74–85. doi: 10.1016/j.foodres.2018.06.067. - DOI - PubMed
    1. Wu F. Measuring the economic impacts of Fusarium toxins in animal feeds. Anim. Feed Sci. Technol. 2007;137:363–374. doi: 10.1016/j.anifeedsci.2007.06.010. - DOI
    1. Pankaj S., Shi H., Keener K.M. A review of novel physical and chemical decontamination technologies for aflatoxin in food. Trends Food Sci. Technol. 2018;71:73–83. doi: 10.1016/j.tifs.2017.11.007. - DOI
    1. Basappa S. Aflatoxins: Formation, Analysis and Control. Alpha Science International; Oxford, UK: 2009.

LinkOut - more resources