. 2021 Feb 19;11(2):346.
doi: 10.3390/diagnostics11020346.

Fast and Automated Segmentation for the Three-Directional Multi-Slice Cine Myocardial Velocity Mapping

Affiliations

Fast and Automated Segmentation for the Three-Directional Multi-Slice Cine Myocardial Velocity Mapping

Yinzhe Wu et al. Diagnostics (Basel). .

Abstract

Three-directional cine multi-slice left ventricular myocardial velocity mapping (3Dir MVM) is a cardiac magnetic resonance (CMR) technique that allows the assessment of cardiac motion in three orthogonal directions. Accurate and reproducible delineation of the myocardium is crucial for accurate analysis of peak systolic and diastolic myocardial velocities. In addition to the conventionally available magnitude CMR data, 3Dir MVM also provides three orthogonal phase velocity mapping datasets, which are used to generate velocity maps. These velocity maps may also be used to facilitate and improve the myocardial delineation. Based on the success of deep learning in medical image processing, we propose a novel fast and automated framework that improves the standard U-Net-based methods on these CMR multi-channel data (magnitude and phase velocity mapping) by cross-channel fusion with an attention module and the shape information-based post-processing to achieve accurate delineation of both epicardial and endocardial contours. To evaluate the results, we employ the widely used Dice Scores and the quantification of myocardial longitudinal peak velocities. Our proposed network trained with multi-channel data shows superior performance compared to standard U-Net-based networks trained on single-channel data. The obtained results are promising and provide compelling evidence for the design and application of our multi-channel image analysis of the 3Dir MVM CMR data.

Keywords: cardiovascular; deep learning; segmentation.


Conflict of interest statement

The authors declare no conflict of interest.

Figures

Figure 1
Figure 1
Network architecture of our proposed myocardium segmentation in three-directional cine multi-slice left ventricular myocardial velocity mapping (3Dir MVM) cardiac magnetic resonance (CMR) (i.e., model [d] in Section 2.2).
Figure 2
Figure 2
Flow chart of the post-processing workflow.
Figure 3
Figure 3
Boxplot of Dice Scores for different models (ac), and [d] per subject, (a) per cine slice (b) and per cine frame (c) of the comparison study results in five-fold cross-validations using different methods. In the boxplot, the orange line indicates the median value, the green line indicates the mean value and the dots around indicate the outliers. Outliers here are defined as data points above Q3 + 1.5 × IQR or below Q1 − 1.5 × IQR of the distribution. (Q1: first quartile, Q3: third quartile, IQR: interquartile range (Q3–Q1).)
Figure 4
Figure 4
Segmentation results for sample cine frames from a subject (blue: true positive automated segmentation; yellow: false positive automated segmentation; red: false negative automated segmentation).
Figure 5
Figure 5
Global velocity curves of the longitudinal, radial and circumferential myocardium velocities per cine slice for a sample cine slice from a subject generated from the manual segmentation and our automated segmentation system.
Figure 6
Figure 6
Dice Score boxplots for the independent testing datasets. In the boxplot, the orange line indicates the median value, the green line indicates the mean value and the dots around indicate the outliers. Outliers here are defined as data points above Q3 + 1.5 × IQR or below Q1 − 1.5 × IQR of the distribution. (Q1: first quartile, Q3: third quartile, IQR: interquartile range (Q3–Q1).)
Figure 7
Figure 7
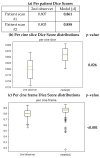
Boxplots for the Dice distribution of the 2nd observer and model [d] and its statistical tests for difference. In the boxplot, the orange line indicates the median value, the green line indicates the mean value and the dots around indicate the outliers. Outliers here are defined as data points above Q3 + 1.5 × IQR or below Q1 − 1.5 × IQR of the distribution. (Q1: first quartile, Q3: third quartile, IQR: interquartile range (Q3–Q1).)

References

    1. Lotz J., Meier C., Leppert A., Galanski M. Cardiovascular flow measurement with phase-contrast MR imaging: Basic facts and implementation. Radiographics. 2002;22:651–671. doi: 10.1148/radiographics.22.3.g02ma11651. - DOI - PubMed
    1. Greil G., Geva T., Maier S.E., Powell A.J. Effect of acquisition parameters on the accuracy of velocity encoded cine magnetic resonance imaging blood flow measurements. J. Magn. Reson. Imaging. 2002;15:47–54. doi: 10.1002/jmri.10029. - DOI - PubMed
    1. Powell A.J., Tsai-Goodman B., Prakash A., Greil G.F., Geva T. Comparison between phase-velocity cine magnetic resonance imaging and invasive oximetry for quantification of atrial shunts. Am. J. Cardiol. 2003;15:1523–1525. doi: 10.1016/S0002-9149(03)00417-X. - DOI - PubMed
    1. Badrinarayanan V., Kendall A., Cipolla R. SegNet: A Deep Convolutional Encoder-Decoder Architecture for Image Segmentation. IEEE Trans. Pattern Anal. Mach. Intell. 2017;39:2481–2495. doi: 10.1109/TPAMI.2016.2644615. - DOI - PubMed
    1. Srivastava N., Salakhutdinov R.R. Multimodal Learning with Deep Boltzmann Machines. In: Pereira F., Burges C.J.C., Bottou L., Weinberger K.Q., editors. Advances in Neural Information Processing Systems 25. Curran Associates, Inc.; Red Hook, NY, USA: 2012. pp. 2222–2230.

LinkOut - more resources