. 2021 Feb 21;22(4):2136.
doi: 10.3390/ijms22042136.

Extensive Placental Methylation Profiling in Normal Pregnancies

Affiliations

Extensive Placental Methylation Profiling in Normal Pregnancies

Ornella Rondinone et al. Int J Mol Sci. .

Erratum in

Abstract

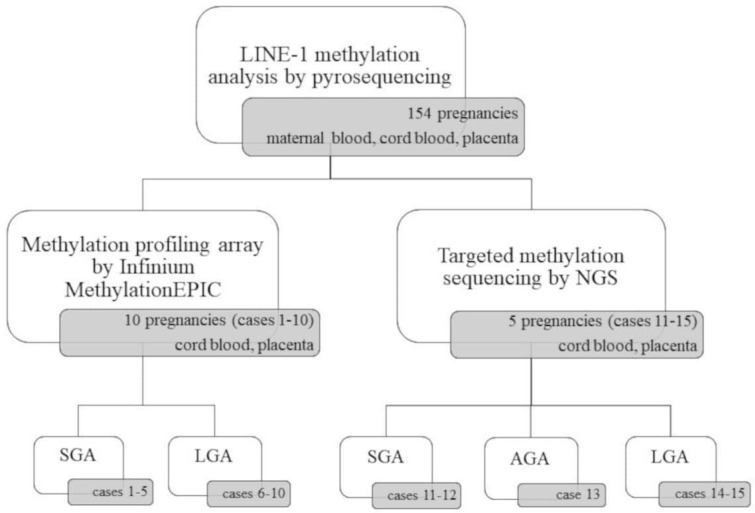
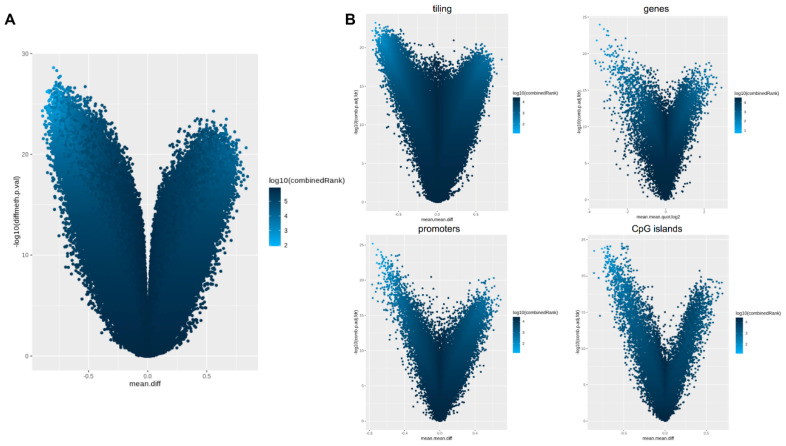
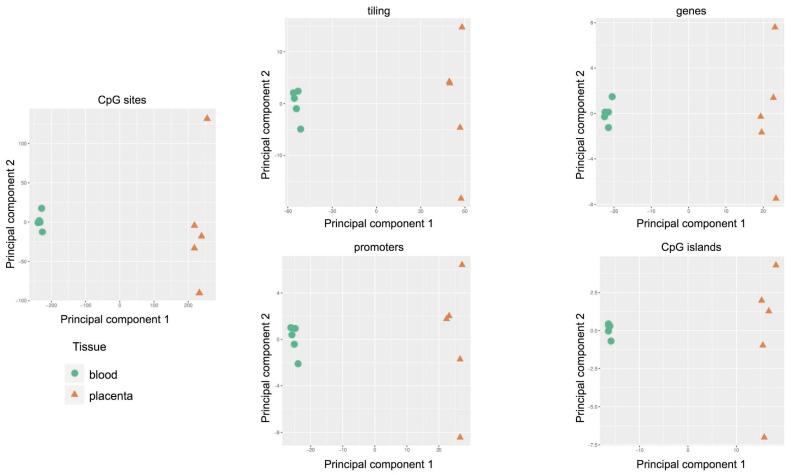
The placental methylation pattern is crucial for the regulation of genes involved in trophoblast invasion and placental development, both key events for fetal growth. We investigated LINE-1 methylation and methylome profiling using a methylation EPIC array and the targeted methylation sequencing of 154 normal, full-term pregnancies, stratified by birth weight percentiles. LINE-1 methylation showed evidence of a more pronounced hypomethylation in small neonates compared with normal and large for gestational age. Genome-wide methylation, performed in two subsets of pregnancies, showed very similar methylation profiles among cord blood samples while placentae from different pregnancies appeared very variable. A unique methylation profile emerged in each placenta, which could represent the sum of adjustments that the placenta made during the pregnancy to preserve the epigenetic homeostasis of the fetus. Investigations into the 1000 most variable sites between cord blood and the placenta showed that promoters and gene bodies that are hypermethylated in the placenta are associated with blood-specific functions, whereas those that are hypomethylated belong mainly to pathways involved in cancer. These features support the functional analogies between a placenta and cancer. Our results, which provide a comprehensive analysis of DNA methylation profiling in the human placenta, suggest that its peculiar dynamicity can be relevant for understanding placental plasticity in response to the environment.

Keywords: LINE-1; birth weight; methylome; normal pregnancies; placenta.


Conflict of interest statement

The authors declare no conflict of interest.

Figures

Figure 1
Figure 1
Schematic overview of the experimental design. SGA, small for gestational age; AGA, appropriate for gestational age; LGA, large for gestational age.
Figure 2
Figure 2
Box-plots of LINE-1 methylation results in 154 pregnancies. (A) Cord blood, maternal blood, and placental methylation level (%) distributions; (B) Placental methylation level (%) distributions stratified according to birth weight percentiles. The rectangles indicate lower, upper quartiles and the median methylation values. Data falling outside the whiskers are plotted as outliers of the data.
Figure 3
Figure 3
Methylation-profiling microarray: Principal Component Analysis (PCA) in 10 pregnancies (cases 1–10). Scatter plot showing the samples coordinates on principal components based on methylation scores of CpG sites and regions: tiling, genes, promoters, and CpG islands.
Figure 4
Figure 4
Methylation-profiling array: Volcano plot for differential methylation in 10 pregnancies (cases 1–10). (A) Volcano plot for differential methylation in CpG sites, quantified using methylation score differences between cord blood and placenta (x-axis) and the p-value of each region (y-axis). Points identify differentially methylated sites that are hypermethylated in placenta (left portion of the plots) or hypermethylated in cord blood (right portion of the plots). Color scale is based on a combined ranking. (B) Volcano plots for differential methylation in tiling, genes, promoters, and CpG islands.
Figure 5
Figure 5
Targeted methylation sequencing: Principal Component Analysis (PCA) in five pregnancies (cases 11–15). Scatter plot showing the samples’ coordinates on principal components based on methylation scores of CpG sites (left) and regions (right): tiling, genes, promoters, and CpG islands.
Figure 6
Figure 6
Targeted methylation sequencing: Hierarchical clustering based on CpG methylation score in cord blood (green) and placenta (orange). The heatmaps show (A) the relative distribution of CpG site methylation scores ranging from 0 (red) to 100% (blue) in the placenta (green) compared to cord blood (orange); (B) the methylation scores for the top 1000 CpG sites based on variance across samples. Color bar on the left indicates CGI relation for each site (shore: <2 kb flanking CpG island; shelf: <2 kb flanking outwards from CpG shore).
Figure 7
Figure 7
Targeted methylation sequencing: RnBeads differential methylation analysis. (A) Volcano plot for differential methylation in tiling, genes, promoters and CpG islands, quantified by the mean methylation score difference between cord blood and placenta (x-axis) and the combined adjusted p-value of each region (y-axis). Points identify differentially methylated regions that are hypermethylated in placenta (left portion of the plots) or hypermethylated in cord blood (right portion of the plots). Color scale is based on combined ranking, which we used to select the top 1000 differentially methylated regions (threshold: log10 (combined Rank) ≤3.312389); (B) Scatter plot showing differential methylation in promoters between cord blood (x-axis) and placenta (y-axis). The top 1000 differentially methylated promoters, based on combined ranking from p-value, methylation difference and methylation ratio, are highlighted in red. Blue shade clouds correspond to high point density, while the 1% of the points in the sparsest populated plot regions are drawn explicitly.

References

    1. Bateson P., Barker D., Clutton-Brock T., Deb D., D’Udine B., Foley R.A., Gluckman P.D., Godfrey K.M., Kirkwood T.B.L., Lahr M.M., et al. Developmental plasticity and human health. Nature. 2004;430:419–421. doi: 10.1038/nature02725. - DOI - PubMed
    1. Turco M.Y., Moffett A. Development of the human placenta. Development. 2019;146:dev163428. doi: 10.1242/dev.163428. - DOI - PubMed
    1. Miozzo M., Grati F., Bulfamante G., Rossella F., Cribiù M., Radaelli T., Cassani B., Persico T., Cetin I., Pardi G., et al. Post-zygotic origin of complete maternal chromosome 7 Isodisomy and consequent loss of placental PEG1/MEST expression. Placenta. 2001;22:813–821. doi: 10.1053/plac.2001.0728. - DOI - PubMed
    1. Grati F.R. Chromosomal mosaicism in human feto-placental development: Implications for prenatal diagnosis. J. Clin. Med. 2014;3:809–837. doi: 10.3390/jcm3030809. - DOI - PMC - PubMed
    1. Miozzo M., Simoni G. The role of imprinted genes in fetal growth. Biol. Neonate. 2002;81:217–228. doi: 10.1159/000056752. - DOI - PubMed