

Construction and Immunogenicity Comparison of Three Virus-Like Particles Carrying Different Combinations of Structural Proteins of Avian Coronavirus Infectious Bronchitis Virus
- PMID: 33670249
- PMCID: PMC7918244
- DOI: 10.3390/vaccines9020146
Construction and Immunogenicity Comparison of Three Virus-Like Particles Carrying Different Combinations of Structural Proteins of Avian Coronavirus Infectious Bronchitis Virus
Abstract
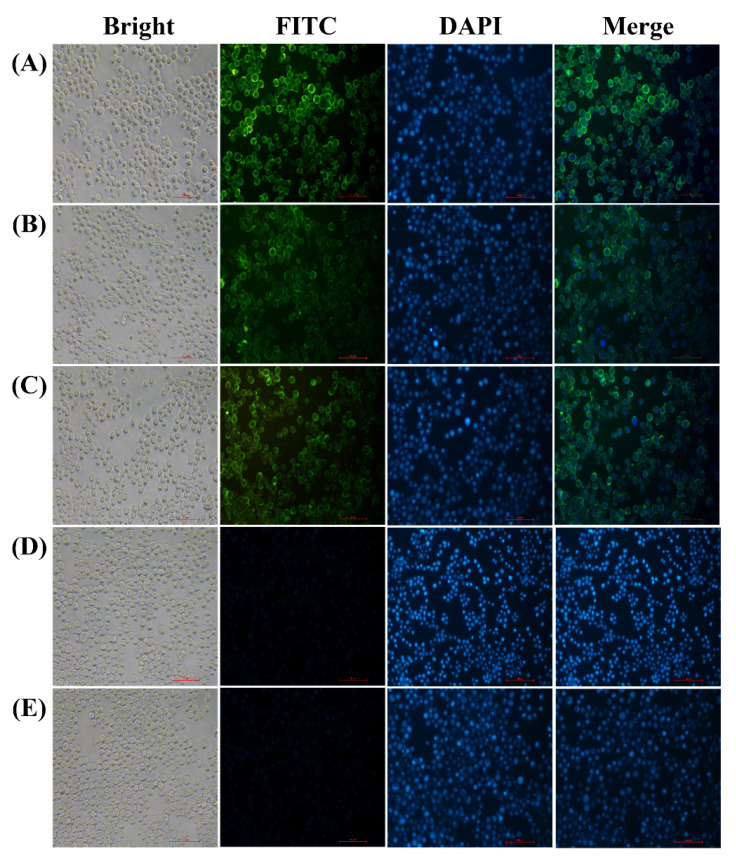
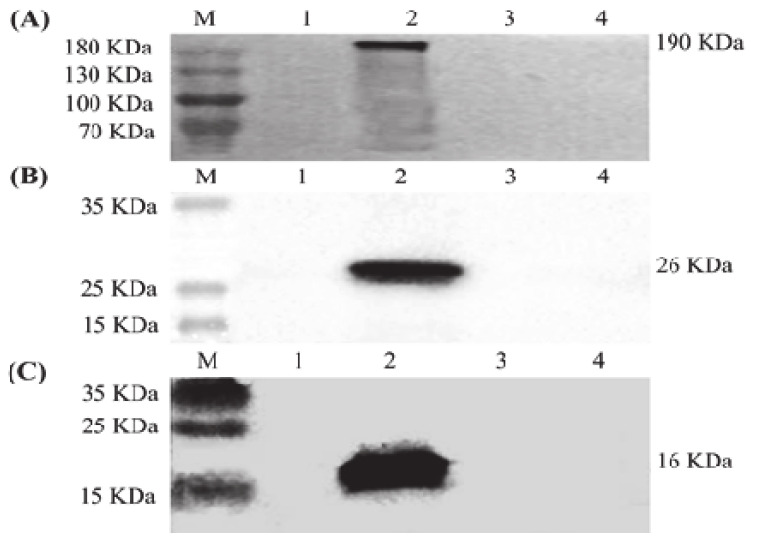
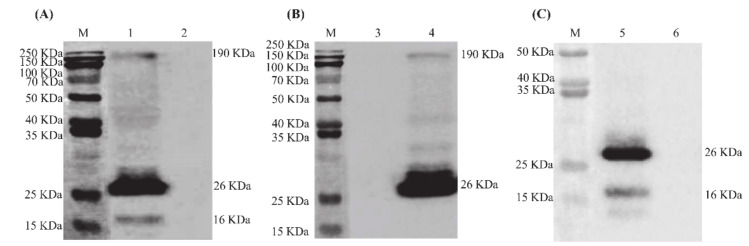
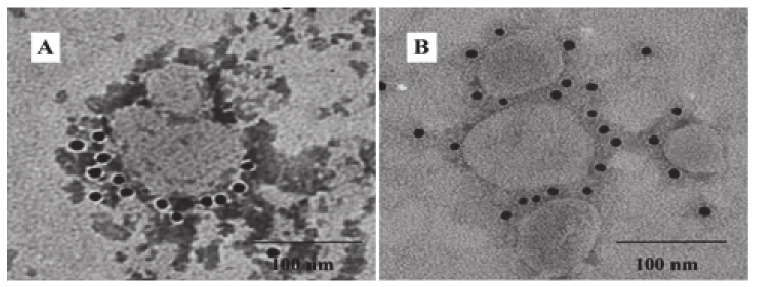
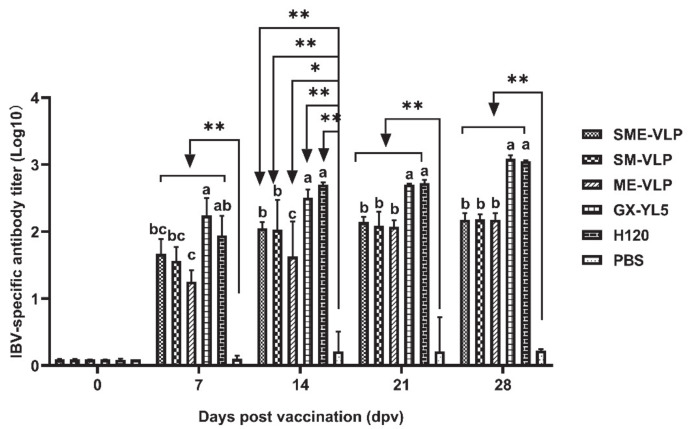
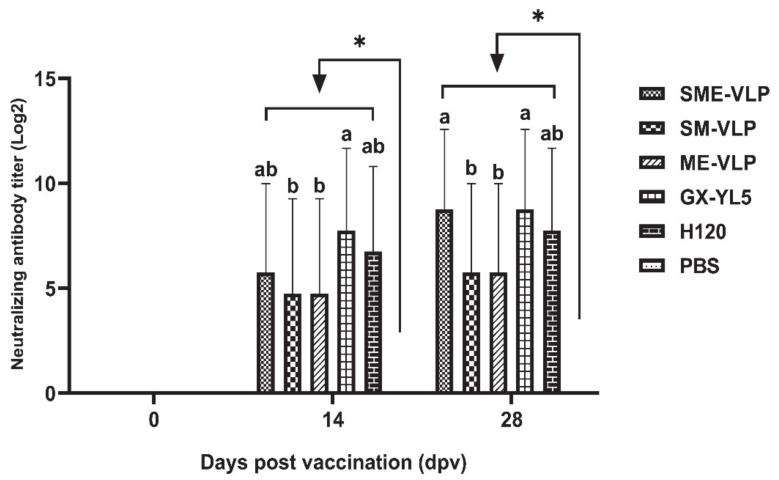
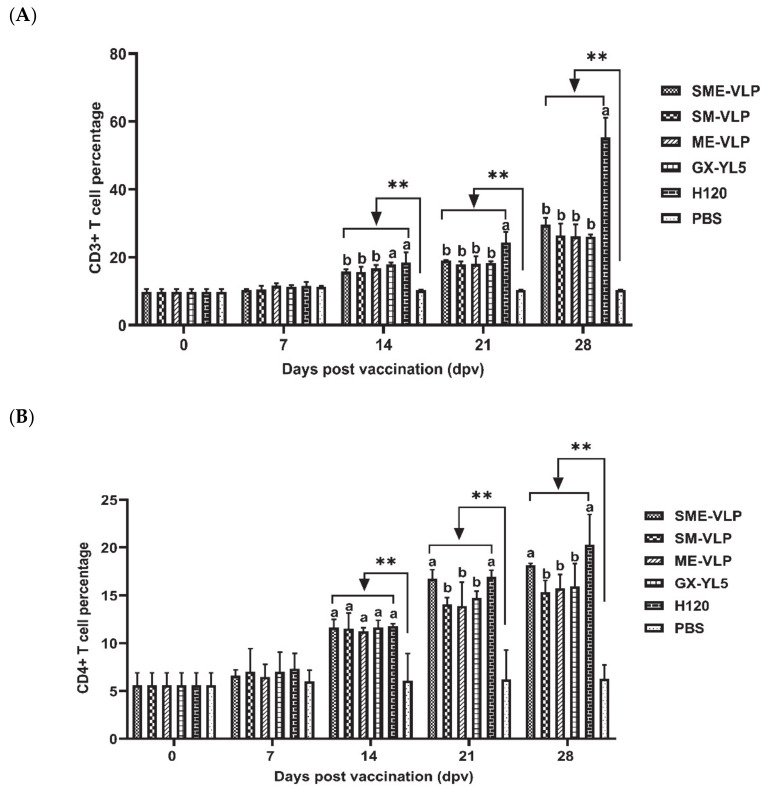
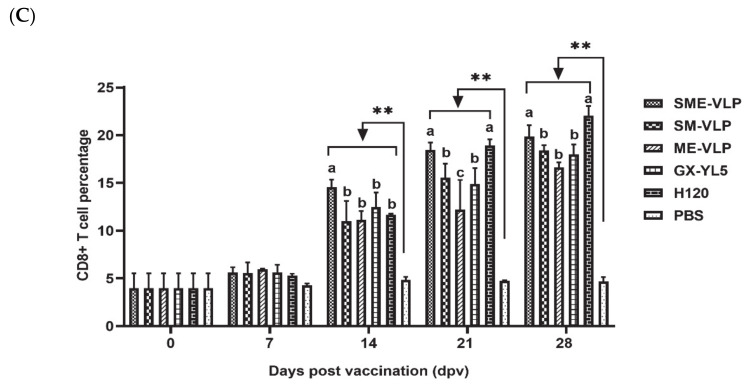
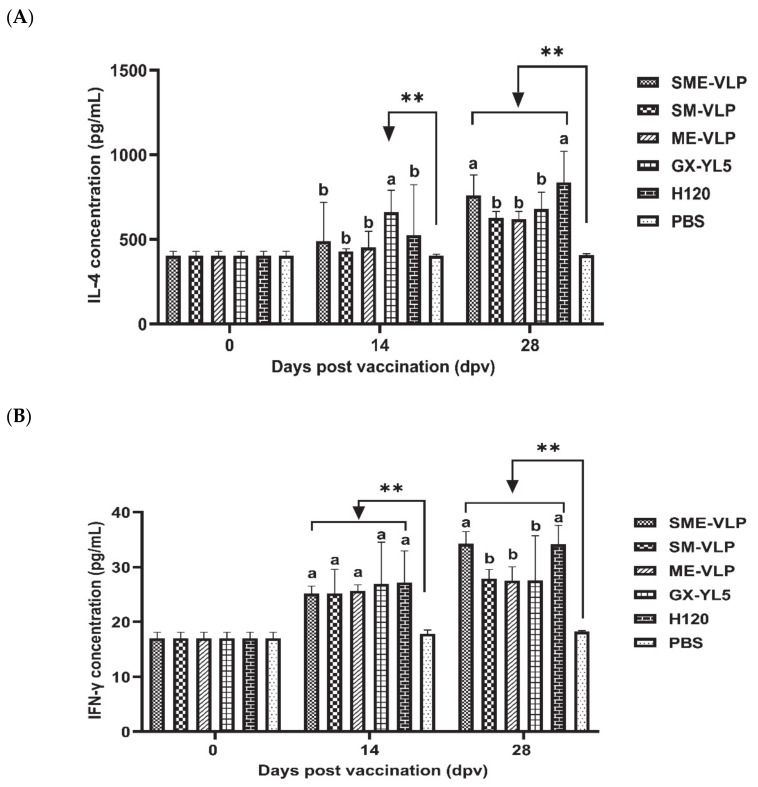
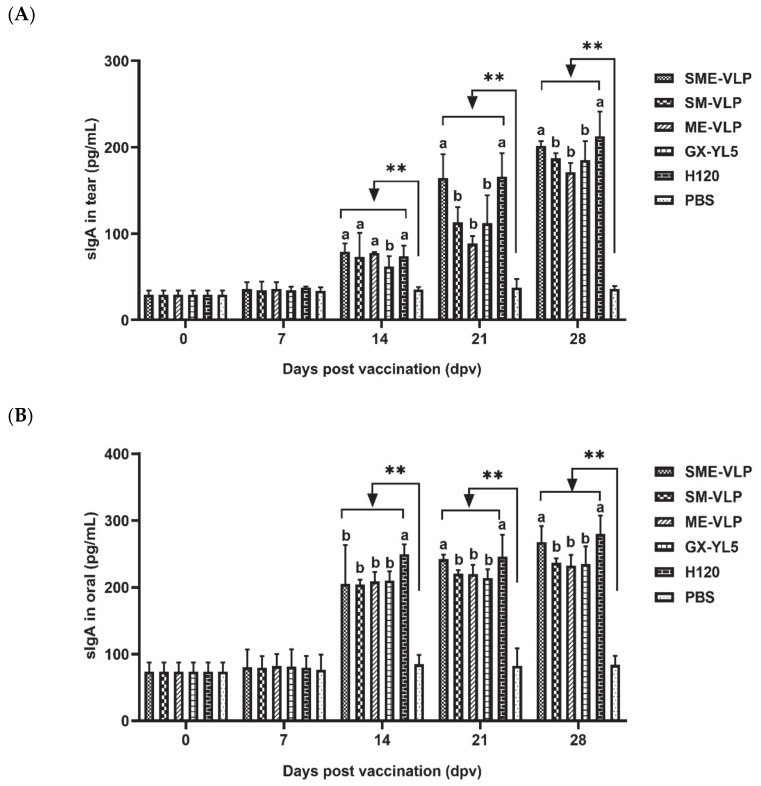
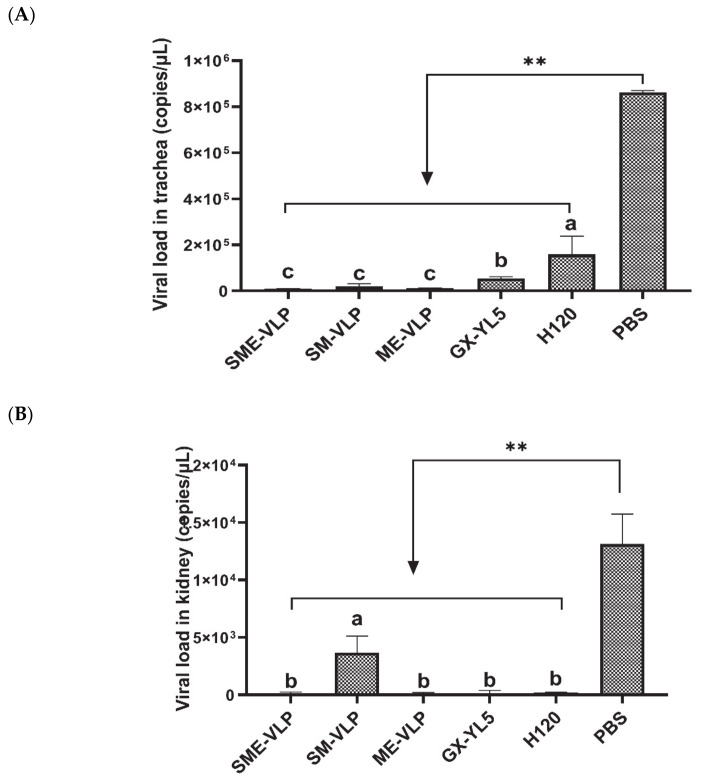
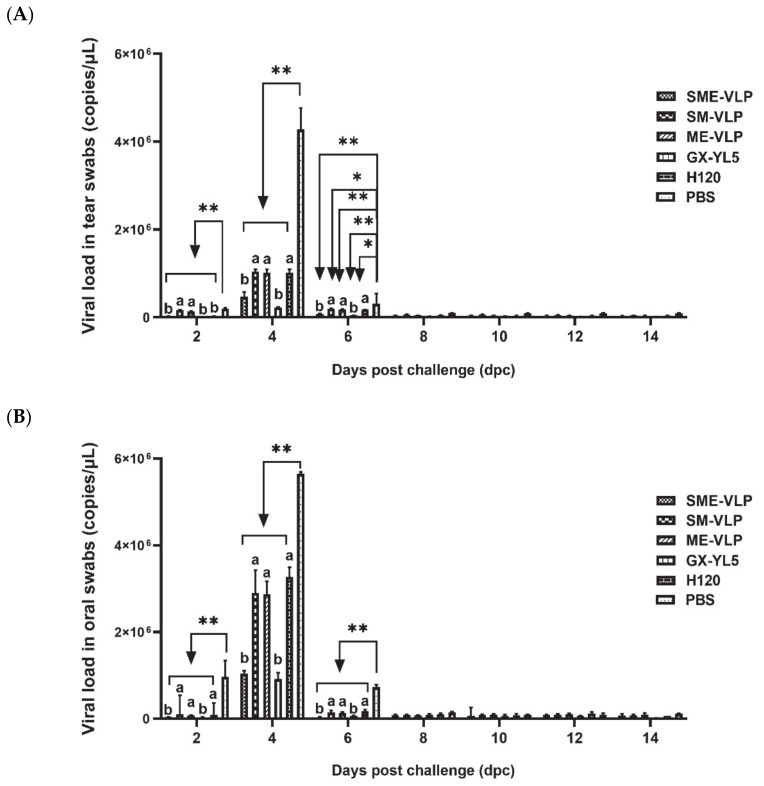
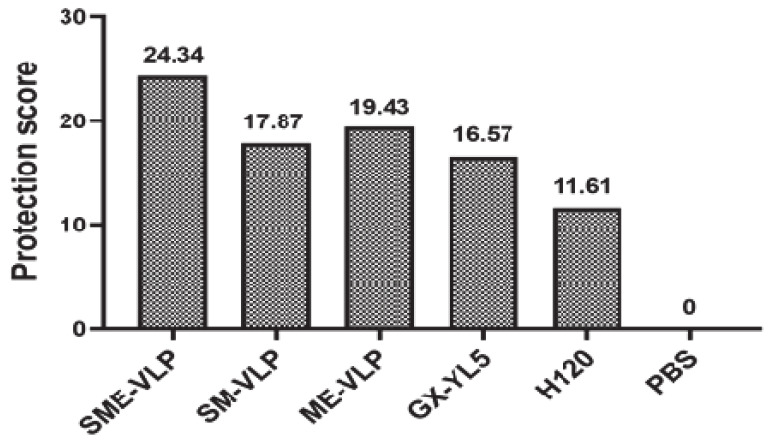
Infectious bronchitis virus (IBV) poses massive economic losses in the global poultry industry. Here, we firstly report the construction and immunogenicity comparison of virus-like particles (VLPs) carrying the S, M and E proteins (SME-VLPs); VLPs carrying the S and M proteins (SM-VLPs); and VLPs carrying the M and E proteins (ME-VLPs) from the dominant serotype representative strain GX-YL5 in China. The neutralizing antibody response induced by the SME-VLPs was similar to that induced by the inactivated oil vaccine (OEV) of GX-YL5, and higher than those induced by the SM-VLPs, ME-VLPs and commercial live vaccine H120. More importantly, the SME-VLPs elicited higher percentages of CD4+ and CD8+ T lymphocytes than the SM-VLPs, ME-VLPs and OEV of GX-YL5. Compared with the OEV of GX-YL5, higher levels of IL-4 and IFN-γ were also induced by the SME-VLPs. Moreover, the mucosal immune response (sIgA) induced by the SME-VLPs in the tear and oral swabs was comparable to that induced by the H120 vaccine and higher than that induced by the OEV of GX-YL5. In the challenge experiment, the SME-VLPs resulted in significantly lower viral RNA levels in the trachea and higher protection scores than the OEV of GX-YL5 and H120 vaccines, and induced comparable viral RNA levels in the kidneys, and tear and oral swabs to the OEV of GX-YL5. In summary, among the three VLPs, the SME-VLPs carrying the S, M and E proteins of IBV could stimulate the strongest humoral, cellular and mucosal immune responses and provide effective protection, indicating that it would be an attractive vaccine candidate for IB.
Keywords: construction; immunogenicity; infectious bronchitis virus; virus-like particles.
Conflict of interest statement
The authors have no conflict of interest to declare.
Figures
Similar articles
-
Immune protection conferred by three commonly used commercial live attenuated vaccines against the prevalent local strains of avian infectious bronchitis virus in southern China.J Vet Med Sci. 2018 Sep 26;80(9):1438-1444. doi: 10.1292/jvms.18-0249. Epub 2018 Jul 18. J Vet Med Sci. 2018. PMID: 30022779 Free PMC article.
-
Protection against Virulent Infectious Bronchitis Virus Challenge Conferred by a Recombinant Baculovirus Co-Expressing S1 and N Proteins.Viruses. 2018 Jun 27;10(7):347. doi: 10.3390/v10070347. Viruses. 2018. PMID: 29954092 Free PMC article.
-
Construction and Immunogenicity of Novel Chimeric Virus-Like Particles Bearing Antigens of Infectious Bronchitis Virus and Newcastle Disease Virus.Viruses. 2019 Mar 13;11(3):254. doi: 10.3390/v11030254. Viruses. 2019. PMID: 30871190 Free PMC article.
-
Combination of H120 and 1/96 avian infectious bronchitis virus vaccine strains protect chickens against challenge with IS/1494/06 (variant 2)-like infectious bronchitis virus.Acta Virol. 2017;61(2):150-160. doi: 10.4149/av_2017_02_04. Acta Virol. 2017. PMID: 28523921 Clinical Trial.
-
Virus-like Particles as Antiviral Vaccine: Mechanism, Design, and Application.Biotechnol Bioprocess Eng. 2023;28(1):1-16. doi: 10.1007/s12257-022-0107-8. Epub 2023 Jan 6. Biotechnol Bioprocess Eng. 2023. PMID: 36627930 Free PMC article. Review.
Cited by
-
Vaccines against Major Poultry Viral Diseases: Strategies to Improve the Breadth and Protective Efficacy.Viruses. 2022 May 31;14(6):1195. doi: 10.3390/v14061195. Viruses. 2022. PMID: 35746665 Free PMC article. Review.
-
A Novel Time-resolved Fluorescence Immunochromatographic Strip for the Diagnosis of Avian Infectious Bronchitis Virus.J Fluoresc. 2025 Aug 22. doi: 10.1007/s10895-025-04483-9. Online ahead of print. J Fluoresc. 2025. PMID: 40844580
-
Virus-like particles in poultry disease: an approach to effective and safe vaccination.Front Vet Sci. 2024 Sep 9;11:1405605. doi: 10.3389/fvets.2024.1405605. eCollection 2024. Front Vet Sci. 2024. PMID: 39315089 Free PMC article. Review.
References
-
- McMullin P. Diseases of poultry 14th edition. Avian Pathol. 2020;49:167–188. doi: 10.1080/03079457.2020.1794237. - DOI
-
- Liu X., Ma H., Xu Q., Sun N., Han Z., Sun C., Guo H., Shao Y., Kong X., Liu S. Characterization of a recombinant coronavirus infectious bronchitis virus with distinct S1 subunits of spike and nucleocapsid genes and a 3’ untranslated region. Vet. Microbiol. 2013;162:429–436. doi: 10.1016/j.vetmic.2012.10.027. - DOI - PMC - PubMed
Grants and funding
LinkOut - more resources
Full Text Sources
Other Literature Sources
Research Materials
