. 2021 Feb 11;22(4):1792.
doi: 10.3390/ijms22041792.

Signatures of Dermal Fibroblasts from RDEB Pediatric Patients

Affiliations

Signatures of Dermal Fibroblasts from RDEB Pediatric Patients

Arkadii K Beilin et al. Int J Mol Sci. .

Abstract

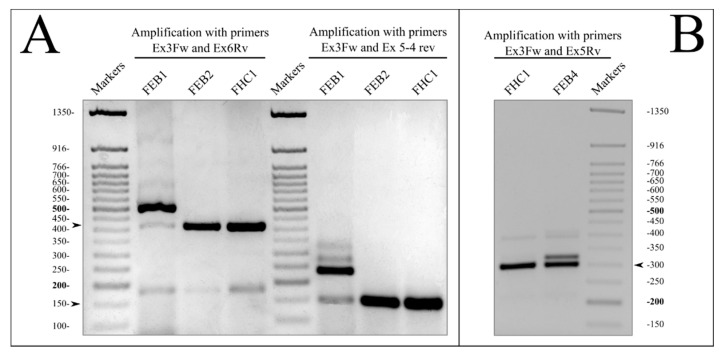
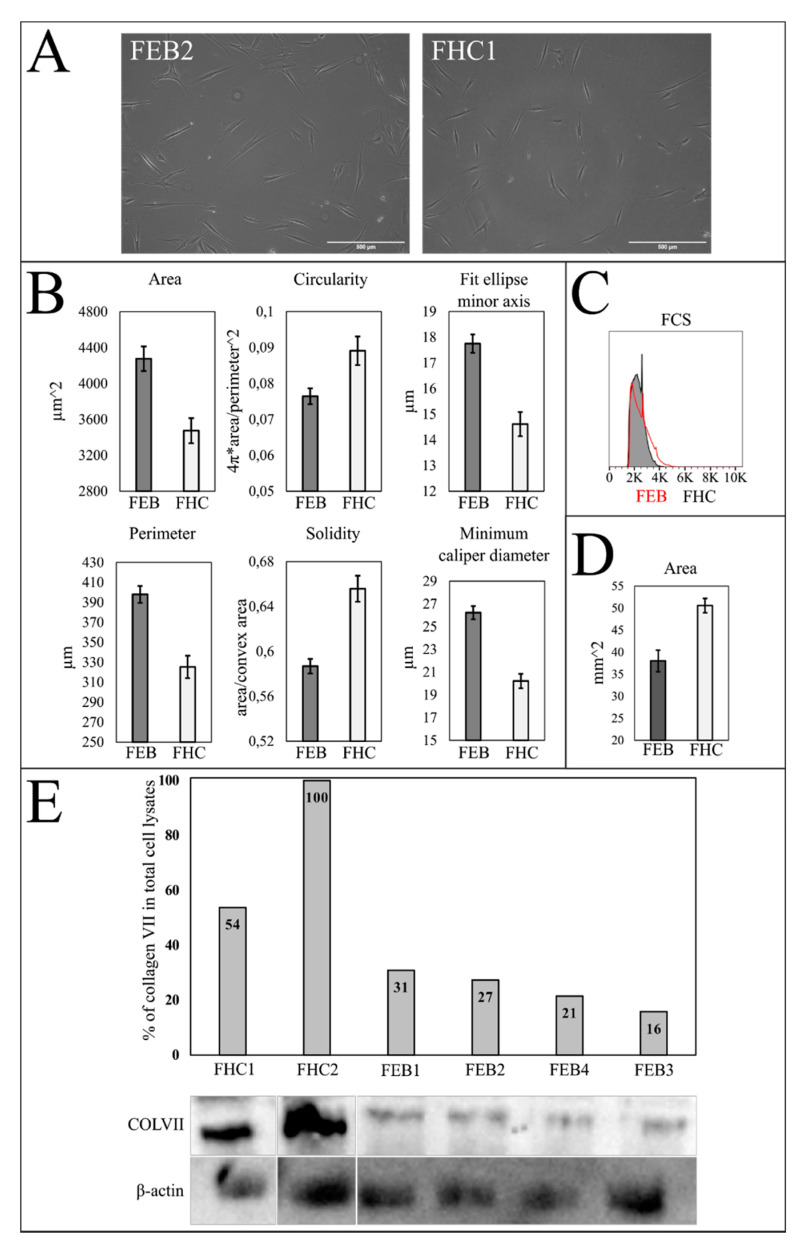
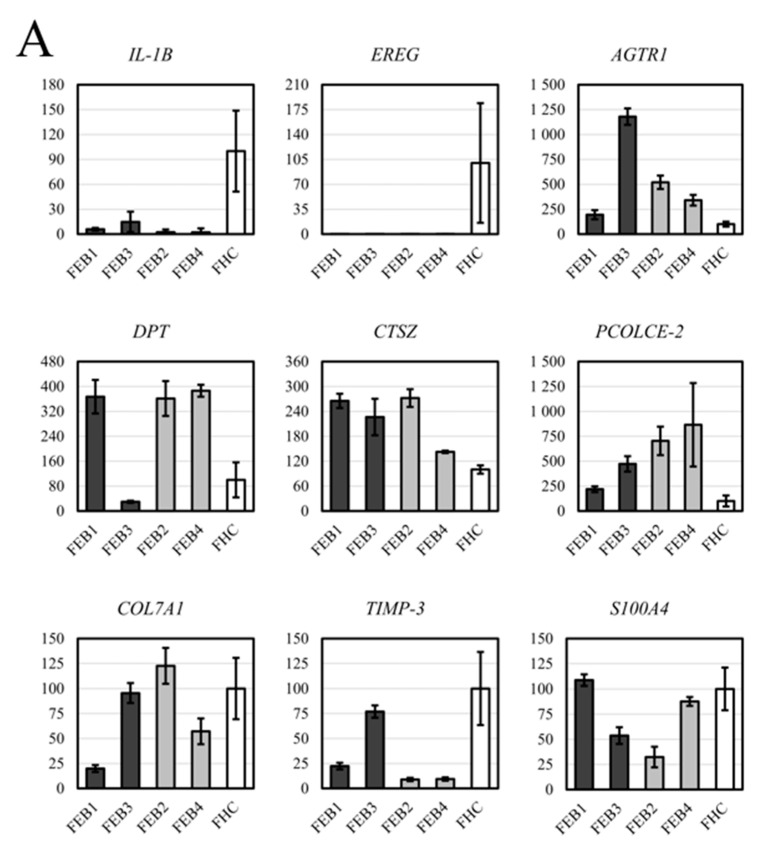
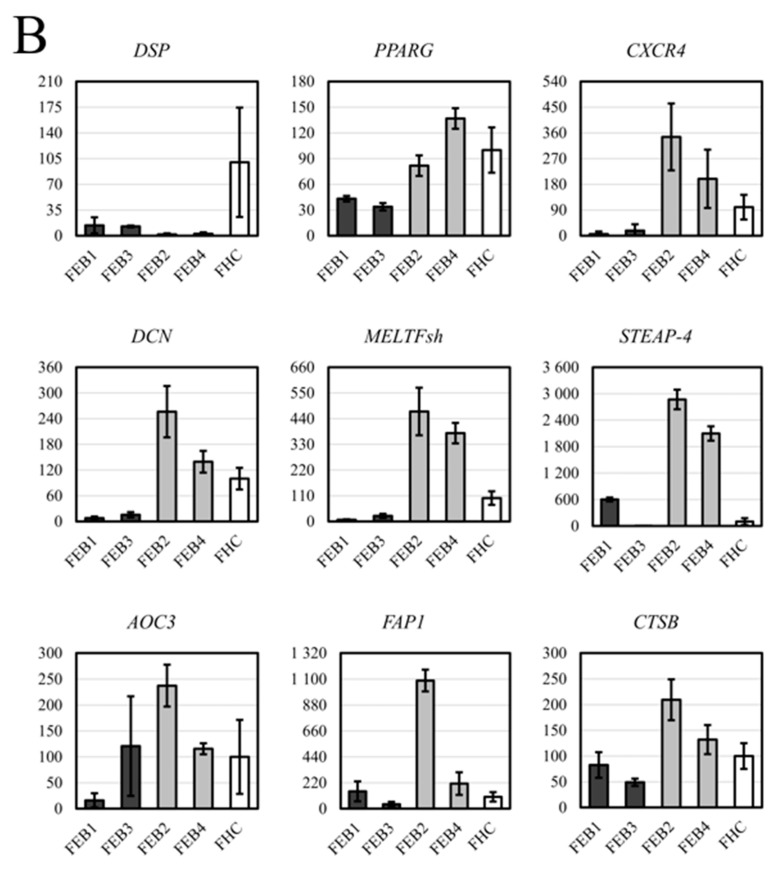
The recessive form of dystrophic epidermolysis bullosa (RDEB) is a debilitating disease caused by impairments in the junctions of the dermis and the basement membrane of the epidermis. Mutations in the COL7A1 gene induce multiple abnormalities, including chronic inflammation and profibrotic changes in the skin. However, the correlations between the specific mutations in COL7A1 and their phenotypic output remain largely unexplored. The mutations in the COL7A1 gene, described here, were found in the DEB register. Among them, two homozygous mutations and two cases of compound heterozygous mutations were identified. We created the panel of primary patient-specific RDEB fibroblast lines (FEB) and compared it with control fibroblasts from healthy donors (FHC). The set of morphological features and the contraction capacity of the cells distinguished FEB from FHC. We also report the relationships between the mutations and several phenotypic traits of the FEB. Based on the analysis of the available RNA-seq data of RDEB fibroblasts, we performed an RT-qPCR gene expression analysis of our cell lines, confirming the differential status of multiple genes while uncovering the new ones. We anticipate that our panels of cell lines will be useful not only for studying RDEB signatures but also for investigating the overall mechanisms involved in disease progression.

Keywords: COL7A1; RDEB; cell culture; dermal fibroblast; differential gene expression; disease mutation; epidermolysis bullosa; extracellular matrix; splicing.


Conflict of interest statement

The authors declare no conflict of interest.

Figures

Figure 1
Figure 1
RT-PCR analysis of COL7A1. Markers-Fast DNA Ladder 50 bp (New England BioLabs, Ipswich, MA, USA). (A). COL7A1 splicing in the FEB1, FEB2 and FHC1 lines. PCR with two pairs of primers, corresponding to exon 3 and exon 6 (Ex3fw, Ex6Rv) and exon 3 and the exon 5-exon 4 junction (Ex3fw, Ex5-4rv), respectively. Normal splicing forms, indicated by arrows, represent the bands of 420 bp and 150 bp in lanes FEB2 and FHC1. For FEB1, the presence of the normal splicing form is clearly visible. The major splice form of FEB1 is the intron-retaining form with length of 505 bp. (B). COL7A1 splicing in FHC1 and FEB4. PCR with exon 3- and exon 5-specific primers (Ex3fw, Ex5Rv). Normal splicing forms (indicated by the arrows) represent the band of 300 bp; the aberrant splicing form represents the band of 320 bp in FEB4 lane. For uncut images, see Supplementary Figure S5.
Figure 2
Figure 2
Immunohystochemistry IHC staining of skin cryosections. (A) Skin of healthy donor d6. (B) Skin of patient d2 with RDEB inversa. (C) Skin of patient d3 with generalized severe RDEB. (D) Autoimmunofluorescence of skin. Green channel—type VII collagen. Blue channel—DNA (DAPI). Fluorescent microscopy.
Figure 3
Figure 3
Immunocytochemistry ICC staining of FEB1 (FEB) and FHC1 (FHC). (A). Red channel shows markers: COLI—type I collagen; COLIV—type IV collagen; FN—fibronectin; S100A4—fibroblast-specific protein 1; TGL—transgelin; COLVII—type VII collagen. Blue channel shows nuclei (DAPI). Scale bar—100 µm. Confocal microscopy (COLI, COLIV, FN, S100A4, TGL) and fluorescence microscopy (COLVII). (B). Red channel shows ɑSMA—alpha smooth muscle actin. Green channel shows FN ED-A—the ED-A segment of fibronectin. Blue channel shows nuclei (DAPI). Scale bar—100 µm. Confocal microscopy. (C). ɑSMA expression level in FEB and FHC lines. Mean value and 95% confidence interval shown for combined FEB (1–4) and FHC1 (FHC). The FHC was taken as 100%. (D). FN ED-A expression level in FEB and FHC lines. Mean value and 95% confidence interval shown for combined FEB (1–4) and FHC1 (FHC). The FHC was taken as 100%.
Figure 3
Figure 3
Immunocytochemistry ICC staining of FEB1 (FEB) and FHC1 (FHC). (A). Red channel shows markers: COLI—type I collagen; COLIV—type IV collagen; FN—fibronectin; S100A4—fibroblast-specific protein 1; TGL—transgelin; COLVII—type VII collagen. Blue channel shows nuclei (DAPI). Scale bar—100 µm. Confocal microscopy (COLI, COLIV, FN, S100A4, TGL) and fluorescence microscopy (COLVII). (B). Red channel shows ɑSMA—alpha smooth muscle actin. Green channel shows FN ED-A—the ED-A segment of fibronectin. Blue channel shows nuclei (DAPI). Scale bar—100 µm. Confocal microscopy. (C). ɑSMA expression level in FEB and FHC lines. Mean value and 95% confidence interval shown for combined FEB (1–4) and FHC1 (FHC). The FHC was taken as 100%. (D). FN ED-A expression level in FEB and FHC lines. Mean value and 95% confidence interval shown for combined FEB (1–4) and FHC1 (FHC). The FHC was taken as 100%.
Figure 4
Figure 4
FEB and FHC comparison. (A) Phase-contrast microscopy of fibroblasts in culture. Magnification ×100. (B) The results of morphological analysis of FEB and FHC. Area, perimeter, minimum caliper diameter and fit ellipse minor axis are significantly bigger (p < 0.05) and circularity and solidity are significantly lower (p < 0.05) for FEB compared to FHC when compared by two-sample t test. Error—standard error. (C) Forward Scatter FSC histogram of FHC and combined FEBs (1–4). Distributions are significantly different (T(x) = 868; p < 0.05). (D) Collagen gel contraction assay. The results of the Mann–Whitney test show that distributions are significantly different (p < 0.05). (E) Western blot analysis of total cell lysates. Semi-quantitative estimation of type VII collagen expression. β-actin used as a loading control. SDS-PAGE (8%) with 8 M urea, anti-collagen VII polyclonal antibody (upper panel) and anti-β-actin (lower panel); electro-chemiluminescence (ECL) detection. For the uncut and unadjusted version, see Supplementary Figure S3.
Figure 5
Figure 5
RT-qPCR analysis of DEG in FEB and FHC lines. Dark grey and light grey column colors indicate cell lines from patients with severe (FEB1, FEB3) and mild (FEB2, FEB4) forms of EB, respectively. White column color indicates the healthy control. The ordinate value is U—relative gene expression, estimated as ΔΔCT, normalized to the mean of FHC. The mean of FHC was taken as 100%. The mean value and 95% confidence level is given for each FEB line and the average value of pooled data from several FHC lines. (A). Strong downregulation of IL1B, EREG genes was demonstrated, the upregulation of AGTR, PCOLCE-2,CTSZ were shown. (B). PPARG, CXCR4, DCN, MELTF, IL7 and CTSB were increased in the milder group and decreased in the severe FEB group. DSP and TIMP3 were downregulated in all FEB lines, with a tendency to be further decreased in mild groups of FEB.
Figure 5
Figure 5
RT-qPCR analysis of DEG in FEB and FHC lines. Dark grey and light grey column colors indicate cell lines from patients with severe (FEB1, FEB3) and mild (FEB2, FEB4) forms of EB, respectively. White column color indicates the healthy control. The ordinate value is U—relative gene expression, estimated as ΔΔCT, normalized to the mean of FHC. The mean of FHC was taken as 100%. The mean value and 95% confidence level is given for each FEB line and the average value of pooled data from several FHC lines. (A). Strong downregulation of IL1B, EREG genes was demonstrated, the upregulation of AGTR, PCOLCE-2,CTSZ were shown. (B). PPARG, CXCR4, DCN, MELTF, IL7 and CTSB were increased in the milder group and decreased in the severe FEB group. DSP and TIMP3 were downregulated in all FEB lines, with a tendency to be further decreased in mild groups of FEB.

References

    1. Chung H.J., Uitto J. Type VII Collagen: The Anchoring Fibril Protein at Fault in Dystrophic Epidermolysis Bullosa. Dermatol. Clin. 2010;28:93–105. doi: 10.1016/j.det.2009.10.011. - DOI - PMC - PubMed
    1. Fine J.-D., Johnson L.B., Weiner M., Li K.-P., Suchindran C. Epidermolysis Bullosa and the Risk of Life-Threatening Cancers: The National EB Registry Experience, 1986–2006. J. Am. Acad. Dermatol. 2009;60:203–211. doi: 10.1016/j.jaad.2008.09.035. - DOI - PubMed
    1. Odorisio T., Di Salvio M., Orecchia A., Di Zenzo G., Piccinni E., Cianfarani F., Travaglione A., Uva P., Bellei B., Conti A., et al. Monozygotic Twins Discordant for Recessive Dystrophic Epidermolysis Bullosa Phenotype Highlight the Role of TGF-β Signalling in Modifying Disease Severity. Hum. Mol. Genet. 2014;23:3907–3922. doi: 10.1093/hmg/ddu102. - DOI - PubMed
    1. Condorelli A.G., Dellambra E., Logli E., Zambruno G., Castiglia D. Epidermolysis Bullosa-Associated Squamous Cell Carcinoma: From Pathogenesis to Therapeutic Perspectives. Int. J. Mol. Sci. 2019;20:5707. doi: 10.3390/ijms20225707. - DOI - PMC - PubMed
    1. March O.P., Kocher T., Koller U. Context-Dependent Strategies for Enhanced Genome Editing of Genodermatoses. Cells. 2020;9:112. doi: 10.3390/cells9010112. - DOI - PMC - PubMed

LinkOut - more resources