

Methods and Limits for Micro Scale Blood Vessel Flow Imaging in Scattering Media by Optical Feedback Interferometry: Application to Human Skin
- PMID: 33670276
- PMCID: PMC7918789
- DOI: 10.3390/s21041300
Methods and Limits for Micro Scale Blood Vessel Flow Imaging in Scattering Media by Optical Feedback Interferometry: Application to Human Skin
Abstract
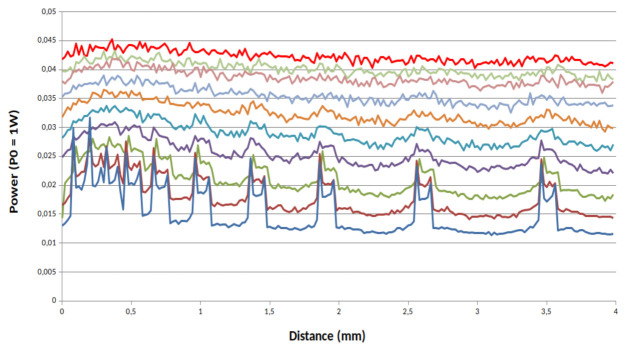
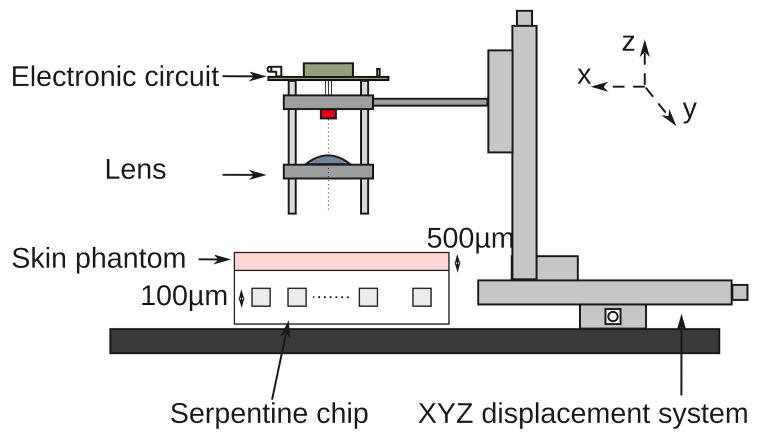
At the micrometric scale, vessels or skin capillaries network architecture can provide useful information for human health management. In this paper, from simulation to in vitro, we investigate some limits and interests of optical feedback interferometry (OFI) for blood flow imaging of skin vascularization. In order to analyze the tissue scattering effect on OFI performances, a series of skin-tissue simulating optical phantoms have been designed, fabricated and characterized. The horizontal (2D) and vertical (depth penetration) sensing resolution of the OFI sensor have been estimated. The experimental results that we present on this study are showing a very good accordance with theoretical models. In the case of a skin phantom of 0.5 mm depth with a scattering coefficient from 0 to 10.8 mm-1, the presented OFI system is able to distinguish a pair of micro fluidic channels (100 µm × 100 µm) spaced by 10 µm. Eventually, an in vivo test on human skin is presented and, for the first time using an OFI sensor, a 2D blood flow image of a vein located just beneath the skin is computed.
Keywords: imaging; micro scale blood flow; optical feedback interferometry.
Conflict of interest statement
The authors declare no conflict of interest.
Figures


References
-
- Hagblad J., Lindberg L.G., Kaisdotter Andersson A., Bergstrand S., Lindgren M., Ek A.C., Folke M., Lindén M. A technique based on laser Doppler flowmetry and photoplethysmography for simultaneously monitoring blood flow at different tissue depths. Med. Biol. Eng. Comput. 2010;48:415–422. doi: 10.1007/s11517-010-0577-2. - DOI - PubMed
-
- Hu C.L., Lin Z.S., Chen Y.Y., Lin Y.H., Li M.L. Portable laser Doppler flowmeter for microcirculation detection. Biomed. Eng. Lett. 2013;3:109–114. doi: 10.1007/s13534-013-0095-x. - DOI
-
- Kuwabara K., Higuchi Y., Ogasawara T., Koizumi H., Haga T. Wearable blood flowmeter appcessory with low-power laser Doppler signal processing for daily-life healthcare monitoring; Proceedings of the 2014 36th Annual International Conference of the IEEE Engineering in Medicine and Biology Society; Chicago, IL, USA. 26–30 August 2014; pp. 6274–6277. - DOI - PubMed
-
- Donati S., Norgia M. Self-Mixing Interferometry for Biomedical Signals Sensing. IEEE J. Sel. Top. Quantum Electron. 2014;20:104–111. doi: 10.1109/JSTQE.2013.2270279. - DOI
MeSH terms
LinkOut - more resources
Full Text Sources
Other Literature Sources
