. 2021 Feb 11;22(4):1808.
doi: 10.3390/ijms22041808.

Human Primary Breast Cancer Stem Cells Are Characterized by Epithelial-Mesenchymal Plasticity

Affiliations

Human Primary Breast Cancer Stem Cells Are Characterized by Epithelial-Mesenchymal Plasticity

Juliane Strietz et al. Int J Mol Sci. .

Abstract

Triple-negative breast cancer (TNBC) is one of the most aggressive subtypes of breast cancer, with only limited treatment options available. Recently, cancer stem cells (CSCs) have emerged as the potential drivers of tumor progression due to their ability to both self-renew and give rise to differentiated progeny. The CSC state has been linked to the process of epithelial-mesenchymal transition (EMT) and to the highly flexible state of epithelial-mesenchymal plasticity (EMP). We aimed to establish primary breast cancer stem cell (BCSC) cultures isolated from TNBC specimens. These cells grow as tumor spheres under anchorage-independent culture conditions in vitro and reliably form tumors in mice when transplanted in limiting dilutions in vivo. The BCSC xenograft tumors phenocopy the original patient tumor in architecture and gene expression. Analysis of an EMT-related marker profile revealed the concomitant expression of epithelial and mesenchymal markers suggesting an EMP state for BCSCs of TNBC. Furthermore, BCSCs were susceptible to stimulation with the EMT inducer TGF-β1, resulting in upregulation of mesenchymal genes and enhanced migratory abilities. Overall, primary BCSC cultures are a promising model close to the patient that can be used both in vitro and in vivo to address questions of BCSC biology and evaluate new treatment options for TNBC.

Keywords: cancer stem cells; epithelial-mesenchymal plasticity; epithelial-mesenchymal transition; triple-negative breast cancer.


Conflict of interest statement

The authors declare no conflict of interest.

Figures
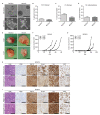
Figure 1
Figure 1
Characterization of BCSC3 and BCSC4 in vitro and in vivo. (A) Phase contrast images of BCSC3 and BCSC4 growing in MSC medium containing 50% Matrigel (3D culture) or 2% Matrigel (2D culture). Scale bars represent 100 μm. (BD) Quantification of colony formation capacities of BCSC3 and BCSC4 single cells seeded in 3D in Matrigel (B), in 2D (C), or under anchorage-independent culture conditions (D). Spheres or colonies were counted. Values are sphere or colony formation relative to seeded cell number in percent (n = 3). Data represents means + SEM. (E) Images of representative BCSC3 and BCSC4 xenograft tumors generated from indicated cell numbers. Scale bars represent 5 mm. (F,G) Representative growth curves of BCSC xenograft tumors. BCSC3 and BCSC4 were transplanted orthotopically into NOD/SCID mice in limiting dilutions as indicated and the tumor size was measured over time (n ≥ 8 tumors per dilution). (H,I) Immunohistochemical analysis of BCSC3 and BCSC4 patient and xenograft tumors. Depicted are representative images of hematoxylin and eosin (H&E) staining as well as expression of keratin 5/6 (K5/6), keratin 8/18 (K8/18), E-cadherin (E-cad), vimentin (Vim), and Ki67. Scale bars represent 100 μm.
Figure 2
Figure 2
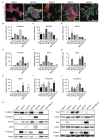
Breast cancer stem cells (BCSCs) exhibit cellular heterogeneity in vitro. (A) Immunofluorescence analysis of myoepithelial keratin 5 and luminal epithelial keratin 8 expression in BCSCs. Depicted are representative images. Nuclei were counterstained with DAPI. Merge and single channels of extended depth of focus z-stack images are shown. Scale bars represent 100 μm. (BE) Flow cytometry analysis of BCSC surface marker expression in BCSC3 and BCSC4. Shown are representative expression patterns of CD24 and CD44 (B,D) as well as EpCAM and CD49f (C,E) (n = 3). Numbers represent the percentage of cells in the respective quadrant.
Figure 3
Figure 3
BCSCs co-express epithelial and mesenchymal markers. (A) Immunofluorescence analysis of BCSCs using antibodies against epithelial E-cadherin (red) and mesenchymal vimentin (green). Cell nuclei were counterstained with DAPI. Scale bars represent 100 μm. (BJ) Analysis of EMT-related gene expression in BCSCs at the mRNA level using qRT-PCR. MCF7 and MDA-MB-231 are depicted as points of reference. Shown are mRNA levels of E-cadherin (B), EpCAM (C), JAM-A (D), Vimentin (E), Snail (F), Slug (G), ZEB1 (H), P-cadherin (I), and N-cadherin (J) relative to HPRT1 (n ≥ 3). Data represents means + SEM. (K) Western blot analysis of epithelial and mesenchymal marker expression in BCSCs on the protein level. MCF7 and MDA-MB-231 are depicted as points of reference. β-actin served as loading control and is depicted for each individual Western blot membrane. Shown are representative blots (n = 3).
Figure 4
Figure 4
TGF-β1 promotes mesenchymal features in BCSCs. (A) Morphology of BCSC1, BCSC2, and BCSC5 without or with TGF-β1 stimulation. Cell morphology was documented using phase contrast microscopy. Scale bars represent 100 μm. (BD) Analysis of EMT-related gene expression in BCSC1 (B), BCSC2 (C), and BCSC5 (D) without or with TGF-β1 stimulation using qRT-PCR (n = 3). Data represents means + SEM. * p < 0.05, *** p < 0.001 by two-way ANOVA. (EH) Growth of BCSC1, BCSC2, and BCSC5 without or with TGF-β1 stimulation. Sphere formation in 50% Matrigel was analyzed relative to control cells (E). Proliferation of BCSC1 (F), BCSC2 (G), and BCSC5 (H) was assessed every day for 7 days by counting DAPI-positive nuclei (n = 2). Data represents means ± SEM. *** p < 0.001 by two-way ANOVA.
Figure 5
Figure 5
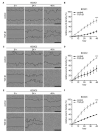
Stimulation with TGF-β1 promotes BCSC migration. Scratch wound assays with and without TGF-β1 stimulation monitored over 48 h. (A,C,E) Depicted are representative images at 0 h, 24 h, and 48 h for BCSC1 (A), BCSC2 (C), and BCSC5 (E). Detected wound edges are marked by a black line. Scale bars represent 500 μm. (B,D,F) Quantification of wound closure is depicted in relative wound density in percent (n = 2). Data represents means ± SEM. *** p < 0.001 by two-way ANOVA.

Similar articles

Cited by

References

    1. Wild C., Weiderpass E., Stewart B. In: World Cancer Report: Cancer Research for Cancer Prevention. Wild C., Weiderpass E., Stewart B., editors. International Agency for Research on Cancer; Lyon, France: 2020.
    1. Goldhirsch A., Winer E.P., Coates A.S., Gelber R.D., Piccart-Gebhart M., Thürlimann B., Senn H.-J. Personalizing the treatment of women with early breast cancer: Highlights of the St Gallen International Expert Consensus on the Primary Therapy of Early Breast Cancer 2013. Ann. Oncol. Off. J. Eur. Soc. Med. Oncol. 2013;24:2206–2223. doi: 10.1093/annonc/mdt303. - DOI - PMC - PubMed
    1. Foulkes W.D., Smith I.E., Reis-Filho J.S. Triple-negative breast cancer. N. Engl. J. Med. 2010;363:1938–1948. doi: 10.1056/NEJMra1001389. - DOI - PubMed
    1. Prat A., Pineda E., Adamo B., Galván P., Fernández A., Gaba L., Díez M., Viladot M., Arance A., Muñoz M. Clinical implications of the intrinsic molecular subtypes of breast cancer. Breast. 2015;24(Suppl. 2):S26–S35. doi: 10.1016/j.breast.2015.07.008. - DOI - PubMed
    1. Geyer F.C., Pareja F., Weigelt B., Rakha E., Ellis I.O., Schnitt S.J., Reis-Filho J.S. The Spectrum of Triple-Negative Breast Disease: High- and Low-Grade Lesions. Am. J. Pathol. 2017;187:2139–2151. doi: 10.1016/j.ajpath.2017.03.016. - DOI - PMC - PubMed

MeSH terms

Substances

LinkOut - more resources