. 2021 Feb 18;11(2):254.
doi: 10.3390/brainsci11020254.

Corticomuscular Coherence and Motor Control Adaptations after Isometric Maximal Strength Training

Affiliations

Corticomuscular Coherence and Motor Control Adaptations after Isometric Maximal Strength Training

Dimitri Elie et al. Brain Sci. .

Abstract

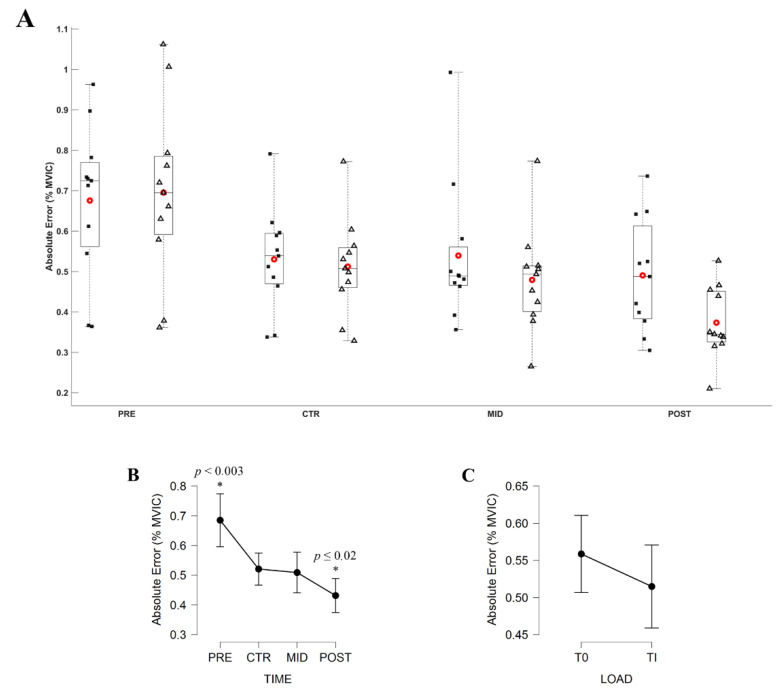
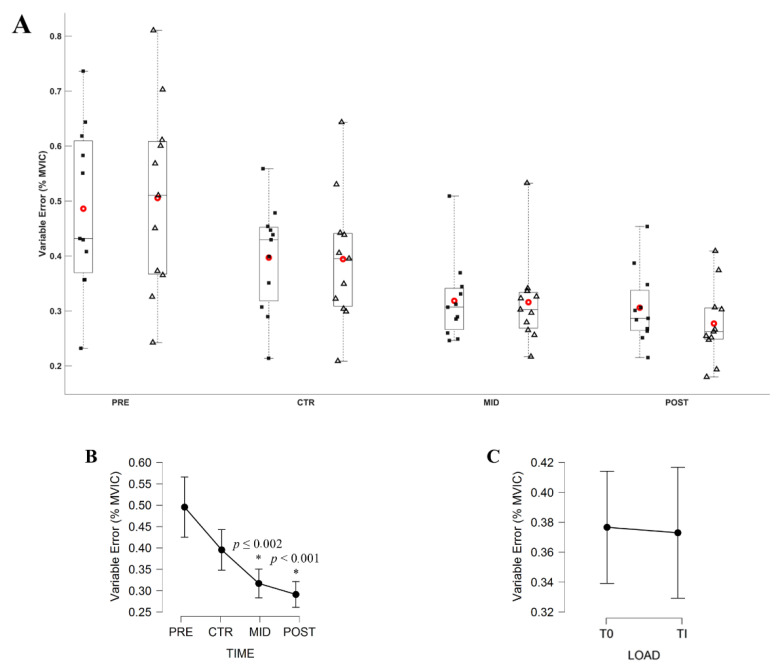
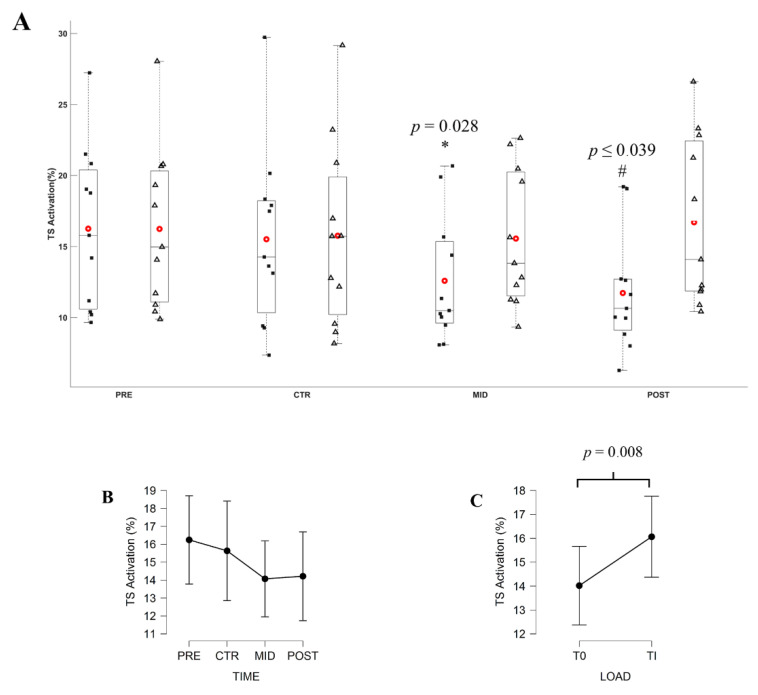
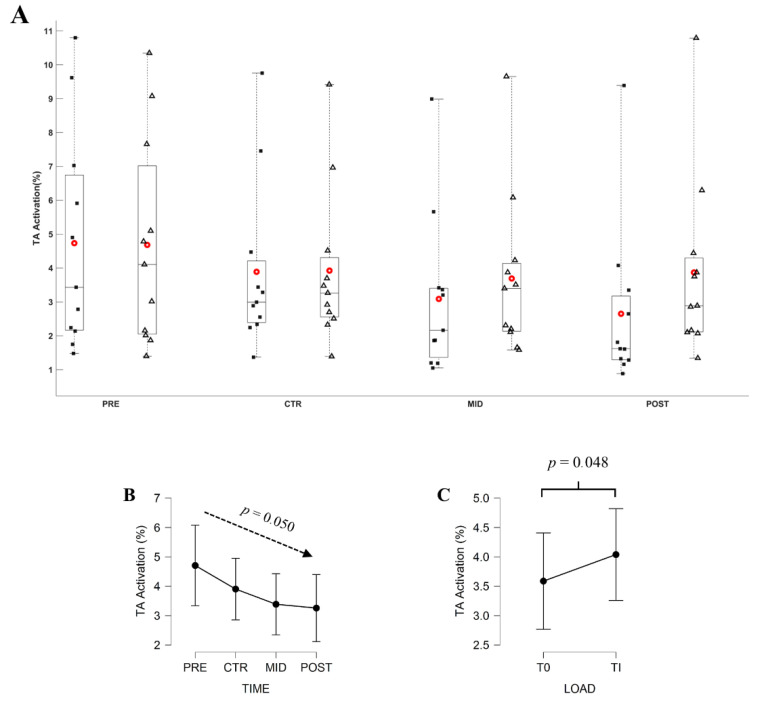
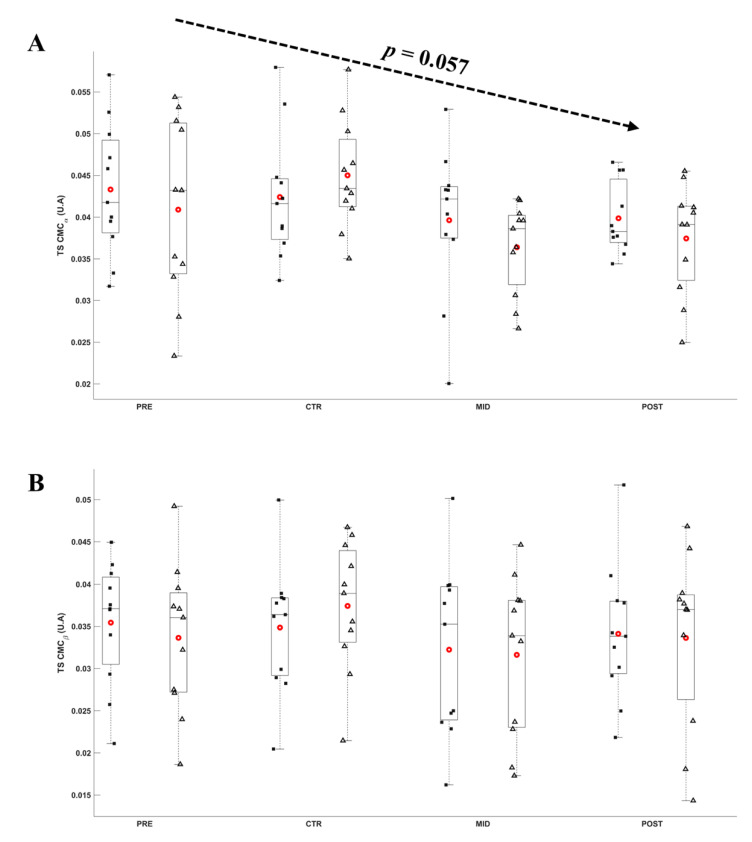
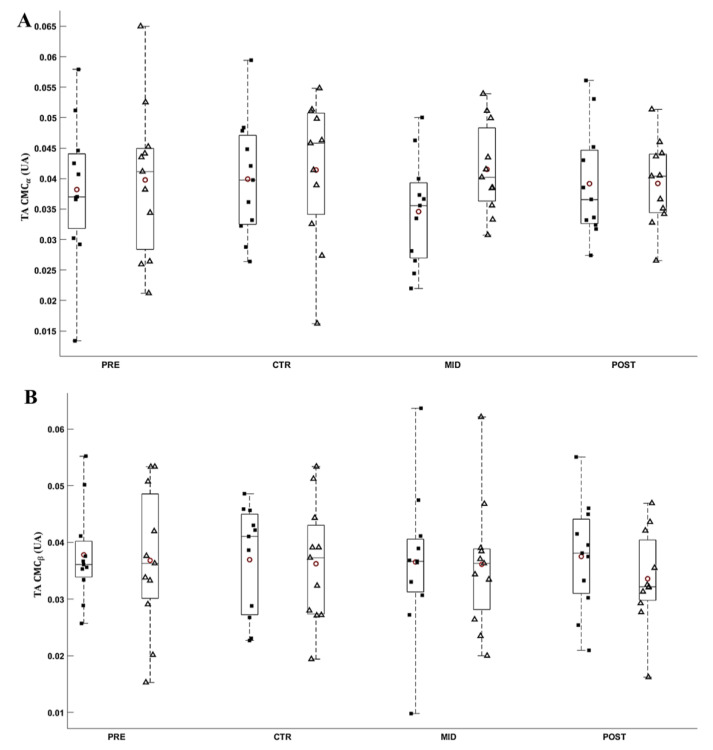
Strength training (ST) induces corticomuscular adaptations leading to enhanced strength. ST alters the agonist and antagonist muscle activations, which changes the motor control, i.e., force production stability and accuracy. This study evaluated the alteration of corticomuscular communication and motor control through the quantification of corticomuscular coherence (CMC) and absolute (AE) and variable error (VE) of the force production throughout a 3 week Maximal Strength Training (MST) intervention specifically designed to strengthen ankle plantarflexion (PF). Evaluation sessions with electroencephalography, electromyography, and torque recordings were conducted pre-training, 1 week after the training initiation, then post-training. Training effect was evaluated over the maximal voluntary isometric contractions (MVIC), the submaximal torque production, AE and VE, muscle activation, and CMC changes during submaximal contractions at 20% of the initial and daily MVIC. MVIC increased significantly throughout the training completion. For submaximal contractions, agonist muscle activation decreased over time only for the initial torque level while antagonist muscle activation, AE, and VE decreased over time for each torque level. CMC remained unaltered by the MST. Our results revealed that neurophysiological adaptations are noticeable as soon as 1 week post-training. However, CMC remained unaltered by MST, suggesting that central motor adaptations may take longer to be translated into CMC alteration.

Keywords: EEG; EMG; plantarflexion; training performances.


Conflict of interest statement

The authors declare no conflict of interest.

Figures

Figure 1
Figure 1
(A) Experimental design timeline including the experimental sessions (PRE, CTR, MID, and POST; black triangles) and training sessions (T; white triangles). (B) Progress of one training session. (C) Typical representation of the net torque feedback (N.m; red line) and target line (grey bar) as a function of time (s) during the training session. (D) Typical representation of the net torque feedback (N.m; red line) as a function of time (s) during one trial of the evaluation session.
Figure 2
Figure 2
Typical recording of (A) Gastrocnémius Medialis (GM) electromyographic (EMG) and (B) Cz electroencephalographic (EEG) activities obtained during the experimental procedure. Wavelet auto-spectra of the GM EMG (C) and Cz EEG (D) signals. (E) Wavelet cross-spectrum and (F) wavelet-magnitude squared coherence between GM EMG and Cz EEG signals in the time-frequency domain. The red rectangles delimit the α (8–13 Hz) and ß (13–31 Hz) frequency band over the period of interest.
Figure 3
Figure 3
Average torque during MVIC in plantarflexion (N.m) according to the evaluation session (PRE, CTR, MID, POST sessions). Each whiskers box indicates the mean (red circle) and the median (horizontal line). The inferior edge and superior edges of the box indicate the 25th and 75th percentile, respectively. Error bars represent the most extreme and non-outlier data points. Black dots represent individual participant performance.
Figure 4
Figure 4
(A) Average normalized torque (% MVIC) during submaximal contractions computed according to the torque levels, T0 (black square) and Ti (white triangle), and evaluation sessions (PRE, CTR, MID, POST sessions). Each whiskers box indicates the mean (red circle) and the median (horizontal line). The inferior and superior edges of the box indicate the 25th and 75th percentile, respectively. Black dots represent individual participant performance. (B) Average normalized torque (N.m) during submaximal contractions computed according to evaluation sessions and (C) to the torque levels. Error bars represent the most extreme and non-outlier data points (A) and 95% confidence intervals (B,C). * significantly different from all other conditions.
Figure 5
Figure 5
(A) Absolute Error (AE; % MVIC) during submaximal contractions computed according to the torque levels, T0 (black square) and Ti (white triangle), and evaluation sessions (PRE, CTR, MID, POST sessions). Each whiskers box indicates the mean (red circle) and the median (horizontal line). The inferior and superior edges of the box indicate the 25th and 75th percentile, respectively. Black dots represent individual participant performance. (B) AE during submaximal contractions computed according to evaluation sessions and (C) to the torque levels. Error bars represent the most extreme and non-outlier data points (A) and 95% confidence intervals (B,C). * significantly different from all other conditions.
Figure 6
Figure 6
(A) Variable Error (VE; % MVIC) during submaximal contractions computed according to the torque levels, T0 (black square) and Ti (white triangle), and evaluation sessions (PRE, CTR, MID, POST sessions). Each whiskers box indicates the mean (red circle) and the median (horizontal line). The inferior and superior edges of the box indicate the 25th and 75th percentile, respectively. Black dots represent individual participant performance. (B) VE during submaximal contractions computed according to evaluation sessions and (C) to the torque levels. Error bars represent the most extreme and non-outlier data points (A) and 95% confidence intervals (B,C). * Significantly different from PRE and CTR evaluation.
Figure 7
Figure 7
(A) Average EMGTS during submaximal contractions computed according to the torque levels, T0 (black square) and Ti (white triangle), and evaluation sessions (PRE, CTR, MID, POST sessions). Each whiskers box indicates the mean (red circle) and the median (horizontal line). The inferior and superior edges of the box indicate the 25th and 75th percentile, respectively. Black dots represent individual participant performance. (B) Average EMGTS during submaximal contractions computed according to evaluation sessions and (C) to the torque levels. Error bars represent the most extreme and non-outlier data points (A) and 95% confidence intervals (B,C). * Significant difference in comparison to Ti torque level recording at MID evaluation. # significant difference in comparison to T0 and Ti torque level respectively recorded at PRE and POST evaluation.
Figure 8
Figure 8
(A) Average EMGTA during submaximal contractions computed according to the torque levels, T0 (black square) and Ti (white triangle), and evaluation sessions (PRE, CTR, MID, POST sessions). Each whiskers box indicates the mean (red circle) and the median (horizontal line). The inferior and superior edges of the box indicate the 25th and 75th percentile, respectively. Black dots represent individual participant performance. (B) Average EMGTA during submaximal contractions computed according to evaluation sessions and (C) to the torque levels. Error bars represent the most extreme and non-outlier data points (A) and 95% confidence intervals (B,C).
Figure 9
Figure 9
Average α (A) and ß (B) CMCTS during submaximal contractions computed according to the torque levels, T0 (black square) and Ti (white triangle), and evaluation sessions (PRE, CTR, MID, POST sessions). Each whiskers box indicates the mean (red circle) and the median (horizontal line). The inferior and superior edges of the box indicate the 25th and 75th percentile, respectively. Black dots represent individual participant performance. Error bars represent the most extreme and non-outlier data points.
Figure 10
Figure 10
Average α (A) and ß (B) CMCTA during submaximal contractions computed according to the torque levels, T0 (black square) and Ti (white triangle), and evaluation sessions (PRE, CTR, MID, POST sessions). Each whiskers box indicates the mean (red circle) and the median (horizontal line). The inferior and superior edges of the box indicate the 25th and 75th percentile, respectively. Black dots represent individual participant performance. Error bars represent the most extreme and non-outlier data points.

Similar articles

Cited by

References

    1. Gribble P.L., Mullin L.I., Cothros N., Mattar A. Role of cocontraction in arm movement accuracy. J. Neurophysiol. 2003;89:2396–2405. doi: 10.1152/jn.01020.2002. - DOI - PubMed
    1. Latash M.L. Muscle coactivation: Definitions, mechanisms, and functions. J. Neurophysiol. 2018;120:88–104. doi: 10.1152/jn.00084.2018. - DOI - PMC - PubMed
    1. Remaud A., Guevel A., Cornu C. Antagonist muscle coactivation and muscle inhibition: Effects on external torque regulation and resistance training-induced adaptations. Neurophysiol. Clin. Clin. Neurophysiol. 2007;37:1–14. doi: 10.1016/j.neucli.2007.01.002. - DOI - PubMed
    1. Carolan B., Cafarelli E. Adaptations in coactivation after isometric resistance training. J. Appl. Physiol. 1992;73:911–917. doi: 10.1152/jappl.1992.73.3.911. - DOI - PubMed
    1. Hortobagyi T., Tunnel D., Moody J., Beam S., DeVita P. Low-or high-intensity strength training partially restores impaired quadriceps force accuracy and steadiness in aged adults. J. Gerontol. Ser. A Biol. Sci. Med. Sci. 2001;56:B38–B47. doi: 10.1093/gerona/56.1.B38. - DOI - PubMed

LinkOut - more resources