. 2021 Feb 18;13(4):852.
doi: 10.3390/cancers13040852.

Weakly Acidic Bile Is a Risk Factor for Hypopharyngeal Carcinogenesis Evidenced by DNA Damage, Antiapoptotic Function, and Premalignant Dysplastic Lesions In Vivo

Affiliations

Weakly Acidic Bile Is a Risk Factor for Hypopharyngeal Carcinogenesis Evidenced by DNA Damage, Antiapoptotic Function, and Premalignant Dysplastic Lesions In Vivo

Clarence T Sasaki et al. Cancers (Basel). .

Abstract

Background: There is recent in vivo discovery documenting the carcinogenic effect of bile at strongly acidic pH 3.0 in hypopharynx, while in vitro data demonstrate that weakly acidic bile (pH 5.5) has a similar oncogenic effect. Because esophageal refluxate often occurs at pH > 4.0, here we aim to determine whether weakly acidic bile is also carcinogenic in vivo.

Methods: Using 32 wild-type mice C57B16J, we performed topical application of conjugated primary bile acids with or without unconjugated secondary bile acid, deoxycholic acid (DCA), at pH 5.5 and controls, to hypopharyngeal mucosa (HM) twice per day, for 15 weeks.

Results: Chronic exposure of HM to weakly acidic bile, promotes premalignant lesions with microinvasion, preceded by significant DNA/RNA oxidative damage, γH2AX (double strand breaks), NF-κB and p53 expression, overexpression of Bcl-2, and elevated Tnf and Il6 mRNAs, compared to controls. Weakly acidic bile, without DCA, upregulates the "oncomirs", miR-21 and miR-155. The presence of DCA promotes Egfr, Wnt5a, and Rela overexpression, and a significant downregulation of "tumor suppressor" miR-451a.

Conclusion: Weakly acidic pH increases the risk of bile-related hypopharyngeal neoplasia. The oncogenic properties of biliary esophageal reflux on the epithelium of the upper aerodigestive tract may not be fully modified when antacid therapy is applied. We believe that due to bile content, alternative therapeutic strategies using specific inhibitors of relevant molecular pathways or receptors may be considered in patients with refractory GERD.

Keywords: DNA damage; NF-κB; bile; head and neck cancer; hypopharyngeal cancer; in vivo; laryngopharyngeal reflux; weakly acidic reflux.


Conflict of interest statement

The authors whose names are listed in this article certify that they have no affiliations with or involvement in any organization or entity with any financial or non-financial interest in the subject matter or materials discussed in this manuscript.

Figures

Figure 1
Figure 1
Weakly acidic bile-induced pre-malignant changes in murine hypopharyngeal squamous mucosa (HM) of C57Bl/6J mice (A). (H&E staining) (from left to right). Normal HM: (a) keratinized stratified squamous epithelium/single layer of basal cells; Dysplastic HM: (b) mild dysplastic epithelium with rete ridges shape; (c) thickness of stratified epithelium and hyperchromatic or pleiomorphic basal cells extend into the upper layers of the mucosa and well differentiated squamous epithelial cells forming islands with architectural changes in submucosa and underlying muscle with hyperchromatic nuclei. Dysplasia-Micro-invasion: (d) submucosal invasion by basal cells while HM maintaining full thickness nuclear hyperchromatism without surface maturation, and (e) atypical neoplastic cells in the submucosa characterized by mitotic figures (yellow arrows) and possible intercellular bridges of the atypical cells (green arrows). (B). Percentage (%) of C57BL/6J mice exhibiting histopathological alterations of HM after 15 weeks of exposure.
Figure 2
Figure 2
Molecular alterations underlying weakly acidic bile-induced histopathological changes of murine hypopharyngeal mucosa (HM) after 15 weeks of exposure, linked to increased cell proliferation (Ki67 and CK14), DNA damage, and decreased cell–cell interactions (E-Cadherin). A. Immunofluorescence staining and automated quantitative analysis (AQUA) were used for Ki67, γΗ2ΑΧ, CK14, DNA/RNA oxidative damage (Oxid. damage), and E-Cadherin [DyLight®549 used for red; DyLight®488 used for green; DAPI was used for nuclei staining (not seen here)]. B. Graphs created by GraphPad Prism 7.0 indicate a statistically significant difference of AQUA-score means for (a) Ki67 (nuclear), (b) CK14 (nuclear and cytoplasmic), (c) γΗ2ΑΧ (nuclear), (d) DNA/RNA oxidative damage markers (nuclear and cytoplasmic), and (e) E-Cadherin (membrane/cytoplasmic) between weakly acidic bile with or without DCA vs. controls (* p < 0.01; ** p < 0.001; *** p < 0.0001; **** p < 0.00001; by t-test; multiple comparisons by Holm-Sidak; GraphPad Prism 7.0).
Figure 3
Figure 3
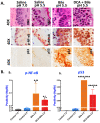
Weakly acidic bile-induced NF-κB activation and increased expression of p53 in murine hypopharyngeal mucosa (HM) after 15 weeks of exposure. (A). Immunohistochemical analysis (IHC), using chromogenic staining, was performed for p-NF-κB (p65 S536) (brown) and p53 (brown). (B). Graphs created by GraphPad Prism 7.0 indicate a statistically significant difference of (a) nuclear positivity for p-NF-κB and (b) cytoplasmic positivity for p53 (by Image Scope software) between weakly acidic bile with or without DCA vs. controls (* p < 0.01; ** p < 0.001; *** p < 0.0001; **** p < 0.00001; by t-test; multiple comparisons by Holm-Sidak; GraphPad Prism 7.0).
Figure 4
Figure 4
Weakly acidic bile-induced transcriptional activation of NF-κB-related oncogenic phenotype in murine hypopharyngeal mucosa (HM) after 15 weeks of exposure. (A) Graph depicts mRNA levels of all analyzed NF-κB-related genes (Bcl2, Il6, Tnf, Egfr, Wnt5a, Rela, and Stat3) after exposure to bile at pH 5.5 with or without DCA vs. controls (p value using one-way ANOVA, Friedman test; Graph Pad Prism software 7.0). (B) Graphs indicate transcriptional levels of each analyzed gene in HM exposed to weakly acidic bile vs. controls (* p < 0.01; ** p < 0.001; t-test; multiple comparisons using Holm-Sidak; GraphPad Prism 7.0). (C) Table shows the changes of the mRNA oncogenic phenotype (fold-change of mRNAs) caused by bile with or without DCA at weakly acidic pH 5.5 vs. control (saline at pH 7.0). (By real-time qPCR analysis; data obtained from four analyzed samples).
Figure 5
Figure 5
Weakly acidic bile-induced deregulation of the miRNA oncogenic phenotype in murine hypopharyngeal mucosa (HM) after 15 weeks of exposure. (A) (a) Graph depicts total “oncomirs” levels after exposure to bile at pH 5.5 with or without DCA vs. controls (one-way ANOVA; Graph Pad Prism software 7.0) (b) Graphs indicate expression levels for each analyzed “oncomir” miR-21 and miR-155 after exposure to weakly acidic bile vs. controls (Graph Pad Prism software 7.0). (B) (a) Graph depicts total “tumor suppressor” miRNA levels after exposure to bile at pH 5.5 with or without DCA vs. controls (one-way ANOVA; Graph Pad Prism software 7.0) (b). Graphs indicate expression levels for each analyzed “tumor suppressor” miR-375 and miR-451a after exposure to weakly acidic bile vs. controls. (* p < 0.01; t-test; multiple comparisons using Holm-Sidak; GraphPad Prism 7.0). (By real-time qPCR analysis; data obtained from four analyzed samples).

References

    1. Parsel S.M., Wu E.L., Riley C.A., McCoul E.D. Gastroesophageal and Laryngopharyngeal Reflux Associated with Laryngeal Malignancy: A Systematic Review and Meta-analysis. Clin. Gastroenterol. Hepatol. 2019;17:1253–1264.e5. doi: 10.1016/j.cgh.2018.10.028. - DOI - PubMed
    1. Langevin S.M., Michaud D.S., Marsit C.J., Nelson H.H., Birnbaum A.E., Eliot M., Christensen B.C., McClean M.D., Kelsey K.T. Gastric reflux is an independent risk factor for laryngopharyngeal carcinoma. Cancer Epidemiol. Biomark. Prev. 2013;22:1061–1068. doi: 10.1158/1055-9965.EPI-13-0183. - DOI - PMC - PubMed
    1. Gotley D.C., Morgan A.P., Cooper M.J. Bile acid concentrations in the refluxate of patients with reflux oesophagitis. Br. J. Surg. 1988;75:587–590. doi: 10.1002/bjs.1800750632. - DOI - PubMed
    1. Covington M.F., Krupinski E., Avery R.J., Kuo P.H. Classification schema of symptomatic enterogastric reflux utilizing sincalide augmentation on hepatobiliary scintigraphy. J. Nucl. Med. Technol. 2014;42:198–202. doi: 10.2967/jnmt.114.141168. - DOI - PubMed
    1. McQuaid K.R., Laine L., Fennerty M.B., Souza R., Spechler S.J. Systematic review: The role of bile acids in the pathogenesis of gastro-oesophageal reflux disease and related neoplasia. Aliment. Pharmacol. Ther. 2011;34:146–165. doi: 10.1111/j.1365-2036.2011.04709.x. - DOI - PubMed

LinkOut - more resources