. 2021 Feb 18;22(4):2021.
doi: 10.3390/ijms22042021.

Role of Constitutive STAR in Leydig Cells

Affiliations

Role of Constitutive STAR in Leydig Cells

Melanie Galano et al. Int J Mol Sci. .

Abstract

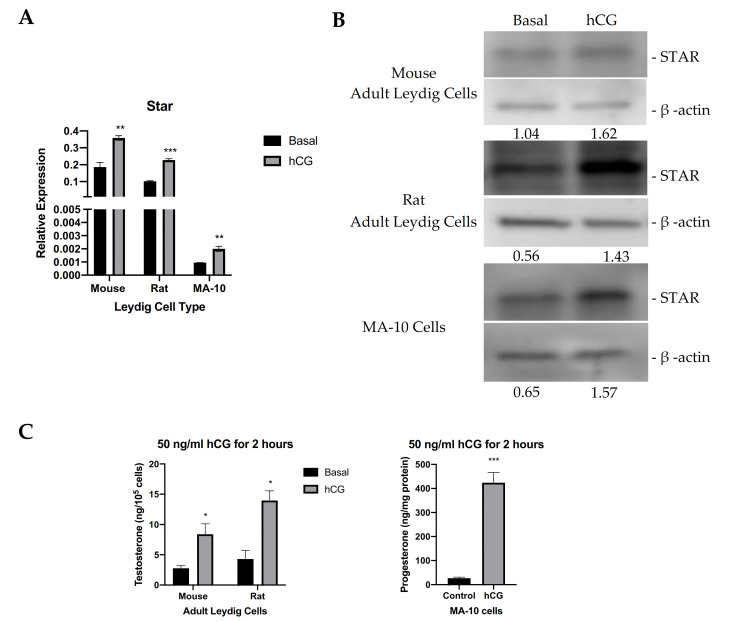
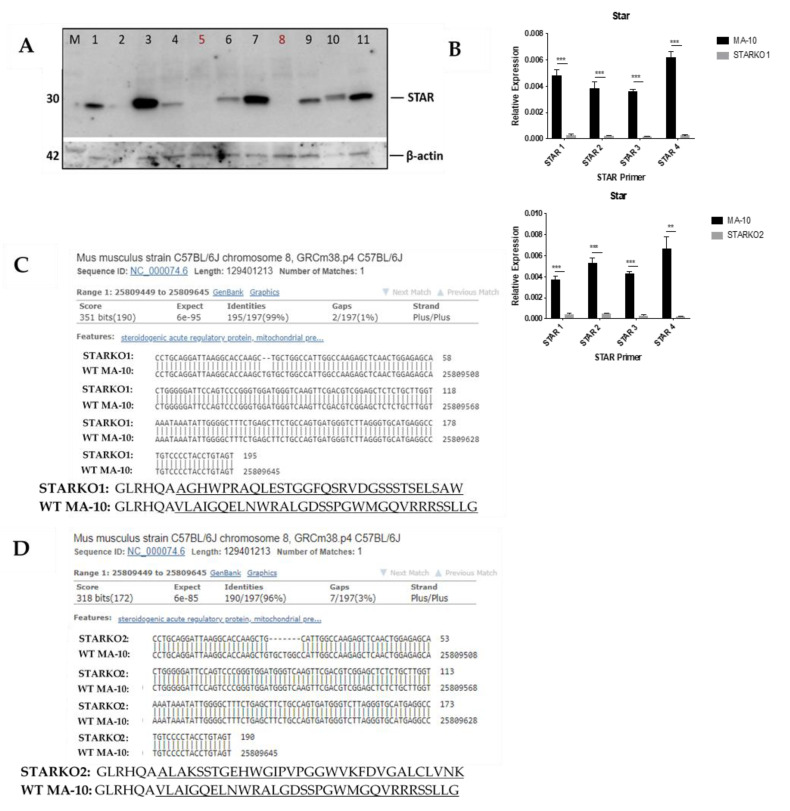
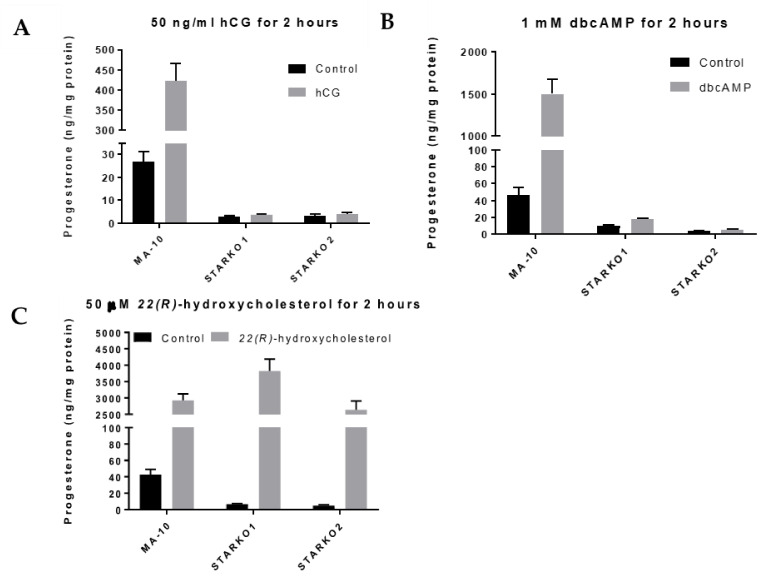
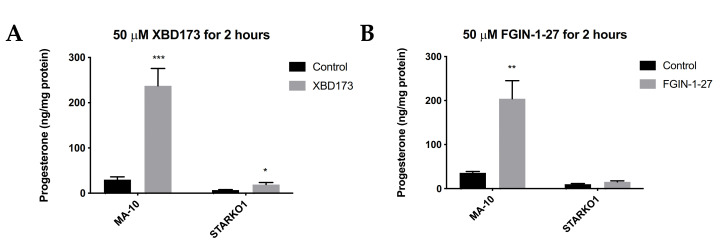
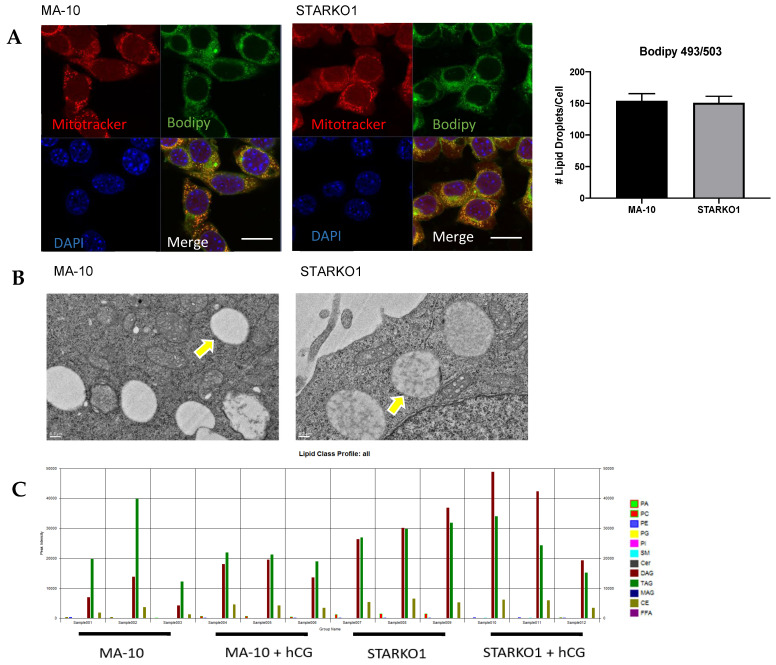
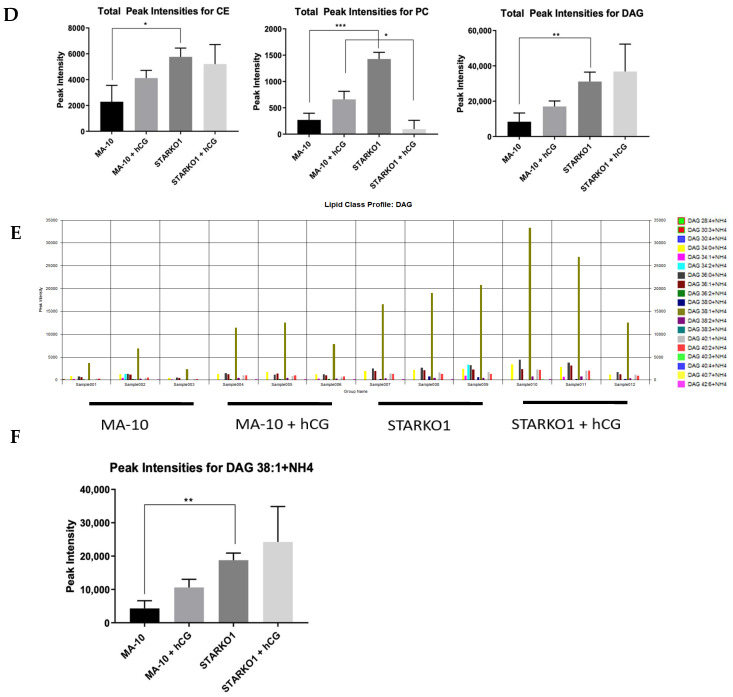
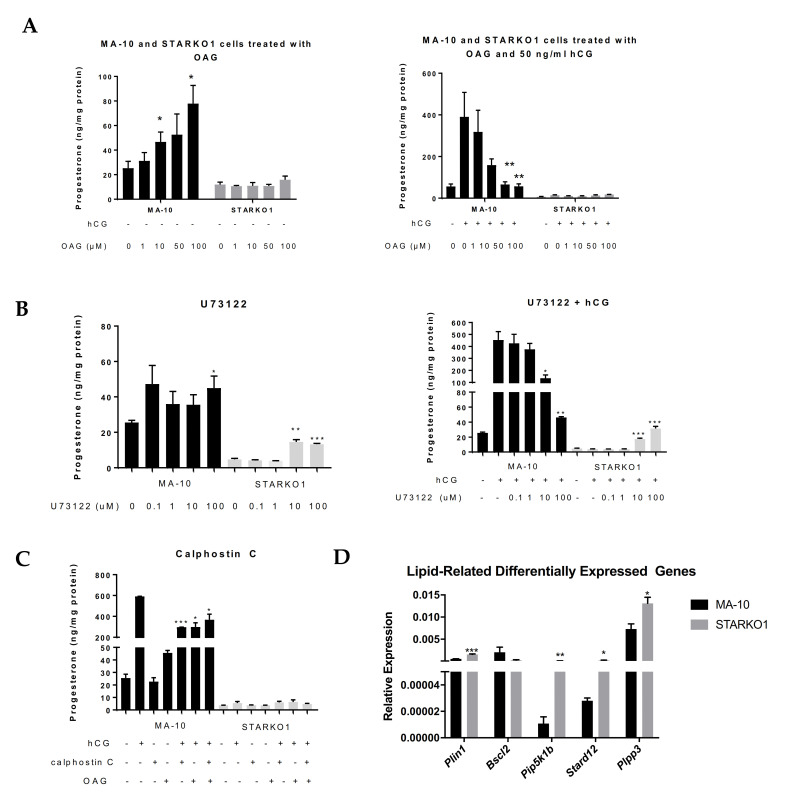
Leydig cells contain significant amounts of constitutively produced steroidogenic acute regulatory protein (STAR; STARD1). Hormone-induced STAR plays an essential role in inducing the transfer of cholesterol into the mitochondria for hormone-dependent steroidogenesis. STAR acts at the outer mitochondrial membrane, where it interacts with a protein complex, which includes the translocator protein (TSPO). Mutations in STAR cause lipoid congenital adrenal hyperplasia (lipoid CAH), a disorder characterized by severe defects in adrenal and gonadal steroid production; in Leydig cells, the defects are seen mainly after the onset of hormone-dependent androgen formation. The function of constitutive STAR in Leydig cells is unknown. We generated STAR knockout (KO) MA-10 mouse tumor Leydig cells and showed that STAR KO cells failed to form progesterone in response to dibutyryl-cAMP and to TSPO drug ligands, but not to 22(R)-hydroxycholesterol, which is a membrane-permeable intermediate of the CYP11A1 reaction. Electron microscopy of STAR KO cells revealed that the number and size of lipid droplets were similar to those in wild-type (WT) MA-10 cells. However, the density of lipid droplets in STAR KO cells was drastically different than that seen in WT cells. We isolated the lipid droplets and analyzed their content by liquid chromatography-mass spectrometry. There was a significant increase in cholesteryl ester and phosphatidylcholine content in STAR KO cell lipid droplets, but the most abundant increase was in the amount of diacylglycerol (DAG); DAG 38:1 was the predominantly affected species. Lastly, we identified genes involved in DAG signaling and lipid metabolism which were differentially expressed between WT MA-10 and STAR KO cells. These results suggest that constitutive STAR in Leydig cells is involved in DAG accumulation in lipid droplets, in addition to cholesterol transport. The former event may affect cell functions mediated by DAG signaling.

Keywords: STAR; cholesterol; diacylglycerol; lipid droplets; steroidogenesis.


Conflict of interest statement

The authors declare no conflict of interest.

Figures

Figure 1
Figure 1
STAR expression and levels in various models in the absence and presence of hormonal stimulation. (A). qRT-PCR analyses of Star mRNA expression in mouse, rat, and MA-10 Leydig cells under basal conditions and upon hCG stimulation. Gapdh was used as the housekeeping gene. Data are shown as the mean ± SEM (n = 3). (B). Western blot analyses of STAR protein levels in mouse, rat, and MA-10 Leydig cells under basal conditions and upon hCG stimulation. Quantification was performed by calculating the ratio of the density of the STAR band to that of β-actin through ImageJ. Quantification is shown below each immunoblot. (C). ELISA analyses of testosterone production by mouse and rat Leydig cells (left) and progesterone production by MA-10 cells (right) in cell media following stimulation with 50 ng/mL hCG for 2 h. Data are shown as the mean ± SEM (n = 3 for mouse; n = 2 for rat). * p < 0.05; ** p < 0.01; *** p < 0.001.
Figure 2
Figure 2
Screening and validation of CRISPR/Cas9-mediated STAR KO in MA-10 cells. (A) Western blot screening for STAR KO cell line following CRISPR/Cas9-mediated STAR KO and FACS. Samples in lane 5 (STARKO2) and lane 8 (STARKO1) show no STAR band and, therefore, are STAR KOs. (B) qRT-PCR analyses of STARKO1 and STARKO2 where Gapdh was used as the housekeeping gene. STAR 1, STAR 2, STAR 3, and STAR 4 are primers for various regions of the mouse Star gene. Data are shown as the mean ± SD (n = 3). ** p < 0.01; *** p < 0.001. (C) BLAST DNA sequence of Star in STARKO1 cells (top) compared to wild-type mouse Star (bottom). Dashes represent nucleotide deletions. Amino acid sequence of wild-type STAR (top) compared to that of STARKO1 (bottom). Highlighted amino acids represent sequence changes. (D) BLAST DNA sequence of Star in STARKO2 cells (top) compared to wild-type mouse Star (bottom). Dashes represent nucleotide deletions. Amino acid sequence of wild-type STAR (top) compared to that of STARKO2 (bottom). Underlined amino acids represent sequence changes.
Figure 3
Figure 3
Progesterone production by wild-type MA-10 and STAR KO cell lines in response to stimulus. (A) ELISA analyses of progesterone levels in cell media following stimulation with 50 ng/mL hCG for 2 h. (B) ELISA analyses of progesterone levels in cell media following stimulation with 1 mM dbcAMP for 2 h. (C) ELISA analyses of progesterone levels in cell media following stimulation with 50 μM 22(R)-hydroxycholesterol for 2 h. Data are shown as the mean ± SEM (n = 3).
Figure 4
Figure 4
Progesterone production by wild-type MA-10 and STAR KO cell lines in response to TSPO drug ligands. (A). ELISA analyses of progesterone levels in cell media following stimulation with 50 μM XBD173 for 2 h. (B). ELISA analyses of progesterone levels in cell media following stimulation with 50 μM FGIN-1-27 for 2 h. Data are shown as the mean ± SEM (n = 3). * p < 0.05; ** p < 0.01; *** p < 0.001.
Figure 5
Figure 5
Alterations in lipid droplet content between WT MA-10 and STARKO1 cells. (A) Bodipy 493/503 staining of lipid droplets in MA-10 (left) and STARKO1 (right) cells with quantification shown to the right. Scale bar: 10 μm. (B) Electron microscopy images of lipid droplets in WT MA-10 cells (left) and STARKO1 cells (right). Arrows point to lipid droplets. (C) Peak intensities of various lipid classes identified in lipid droplets of wild-type MA-10 and STARKO1 cells in the absence and presence of hormonal stimulation. (D) Peak intensities of lipid classes shown to be significantly altered between lipid droplets of wild-type MA-10 and STARKO1 cells in the absence and presence of hormonal stimulation. (E) Peak intensities of individual diacylglycerol (DAG) species identified in lipid droplets of MA-10 and STARKO1 cells. (F) Peak intensities of DAG 38:1 in lipid droplets of MA-10 and STARKO1 cells in the absence and presence of hormonal stimulation. Data are shown as the mean ± SEM. * p < 0.05; ** p < 0.01; *** p < 0.001.
Figure 5
Figure 5
Alterations in lipid droplet content between WT MA-10 and STARKO1 cells. (A) Bodipy 493/503 staining of lipid droplets in MA-10 (left) and STARKO1 (right) cells with quantification shown to the right. Scale bar: 10 μm. (B) Electron microscopy images of lipid droplets in WT MA-10 cells (left) and STARKO1 cells (right). Arrows point to lipid droplets. (C) Peak intensities of various lipid classes identified in lipid droplets of wild-type MA-10 and STARKO1 cells in the absence and presence of hormonal stimulation. (D) Peak intensities of lipid classes shown to be significantly altered between lipid droplets of wild-type MA-10 and STARKO1 cells in the absence and presence of hormonal stimulation. (E) Peak intensities of individual diacylglycerol (DAG) species identified in lipid droplets of MA-10 and STARKO1 cells. (F) Peak intensities of DAG 38:1 in lipid droplets of MA-10 and STARKO1 cells in the absence and presence of hormonal stimulation. Data are shown as the mean ± SEM. * p < 0.05; ** p < 0.01; *** p < 0.001.
Figure 6
Figure 6
Role of DAG signaling in progesterone production by WT MA-10 and STARKO1 cells. (A) ELISA analyses of progesterone levels in cell media following treatment with varying concentrations of the DAG analog OAG in the absence (left) and presence (right) of 50 ng/mL hCG for 2 h. (B) ELISA analyses of progesterone levels in cell media following treatment with varying concentrations of PLC inhibitor U73122 in the absence (left) and presence (right) of 50 ng/mL hCG for 2 h. (C) ELISA analyses of progesterone levels in cell media following treatment with 1 μM of PKC inhibitor calphostin C in combination with 50 ng/mL hCG and/or 50 μM OAG for 2 h. (D) qRT-PCR analyses of lipid-related differentially expressed genes. Data are shown as the mean ± SEM (n = 3). * p < 0.05; ** p < 0.01; *** p < 0.001.

References

    1. Epstein L.F., Orme-Johnson N.R. Acute action of luteinizing hormone on mouse Leydig cells: Accumulation of mitochondrial phosphoproteins and stimulation of testosterone synthesis. Mol. Cell Endocrinol. 1991;81:113–126. doi: 10.1016/0303-7207(91)90210-J. - DOI - PubMed
    1. Luo L., Chen H., Stocco D.M., Zirkin B.R. Leydig cell protein synthesis and steroidogenesis in response to acute stimulation by luteinizing hormone in rats. Biol. Reprod. 1998;59:263–270. doi: 10.1095/biolreprod59.2.263. - DOI - PubMed
    1. Rone M.B., Midzak A.S., Issop L., Rammouz G., Jagannathan S., Fan J., Papadopoulos V. Identification of a dynamic mitochondrial protein complex driving cholesterol import, trafficking, and metabolism to steroid hormones. Mol. Endocrinol. 2012;26:1868–1882. doi: 10.1210/me.2012-1159. - DOI - PMC - PubMed
    1. Tugaeva K.V., Sluchanko N.N. Steroidogenic Acute Regulatory Protein: Structure, Functioning, and Regulation. Biochemistry. 2019;84:S233–S253. doi: 10.1134/S0006297919140141. - DOI - PubMed
    1. Miller W.L. Steroidogenic acute regulatory protein (StAR), a novel mitochondrial cholesterol transporter. Biochim. Biophys. Acta. 2007;1771:663–676. doi: 10.1016/j.bbalip.2007.02.012. - DOI - PubMed

MeSH terms