

Monitoring Contractile Cardiomyocytes via Impedance Using Multipurpose Thin Film Ruthenium Oxide Electrodes
- PMID: 33670743
- PMCID: PMC7923073
- DOI: 10.3390/s21041433
Monitoring Contractile Cardiomyocytes via Impedance Using Multipurpose Thin Film Ruthenium Oxide Electrodes
Abstract
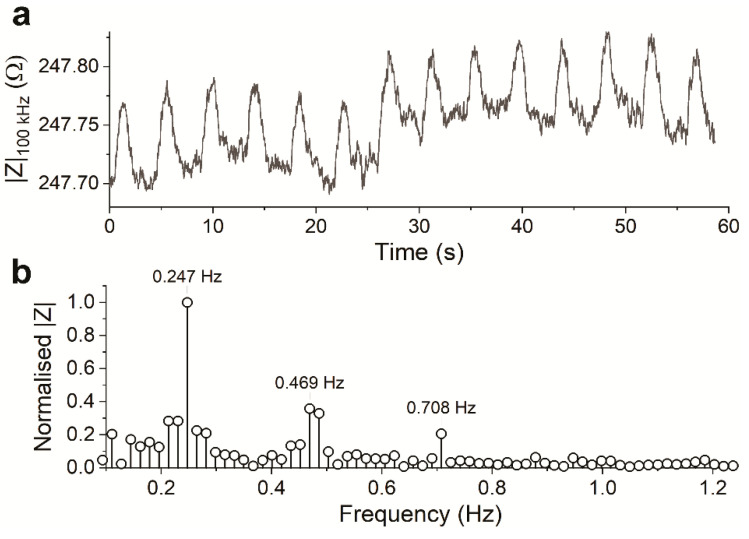
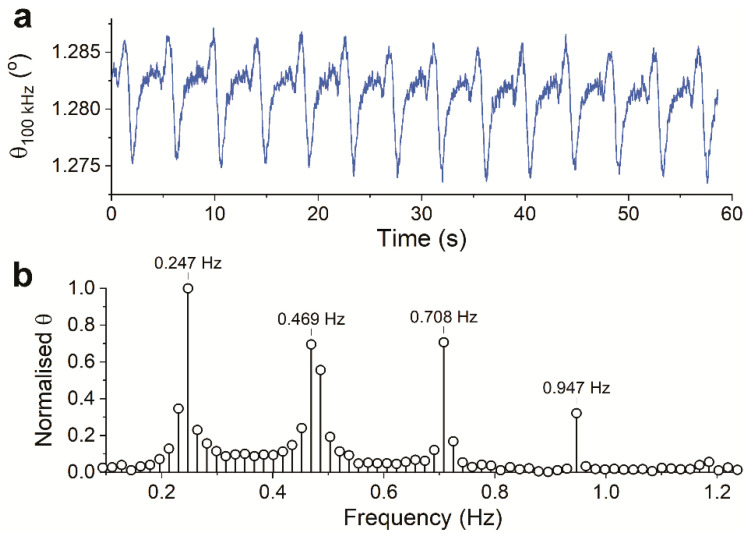
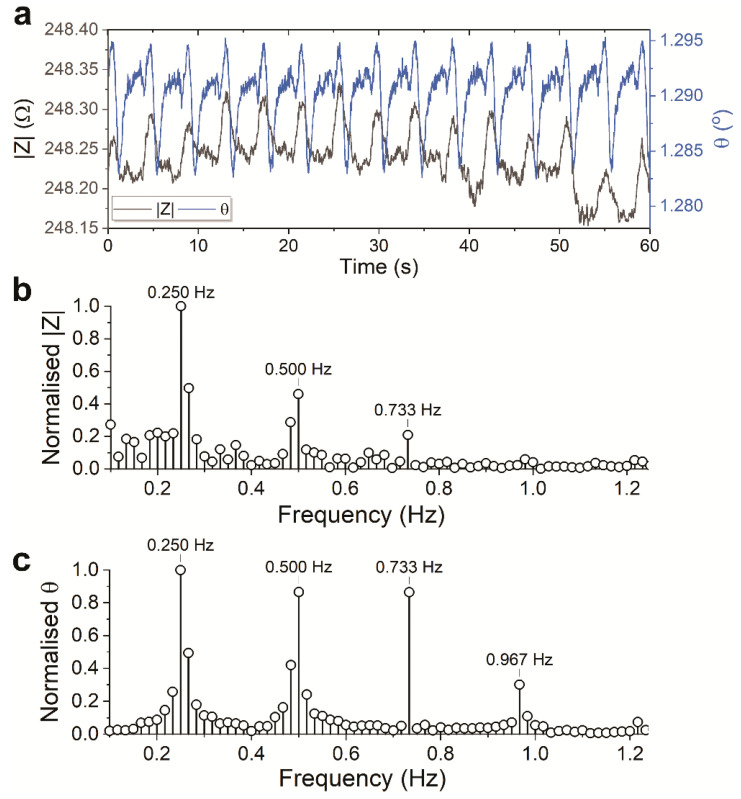
A ruthenium oxide (RuOx) electrode was used to monitor contractile events of human pluripotent stem cells-derived cardiomyocytes (hPSC-CMs) through electrical impedance spectroscopy (EIS). Using RuOx electrodes presents an advantage over standard thin film Pt electrodes because the RuOx electrodes can also be used as electrochemical sensor for pH, O2, and nitric oxide, providing multisensory functionality with the same electrode. First, the EIS signal was validated in an optically transparent well-plate setup using Pt wire electrodes. This way, visual data could be recorded simultaneously. Frequency analyses of both EIS and the visual data revealed almost identical frequency components. This suggests both the EIS and visual data captured the similar events of the beating of (an area of) hPSC-CMs. Similar EIS measurement was then performed using the RuOx electrode, which yielded comparable signal and periodicity. This mode of operation adds to the versatility of the RuOx electrode's use in in vitro studies.
Keywords: Fourier analysis; cardiomyocytes; electrical impedance spectroscopy; ruthenium oxide.
Conflict of interest statement
The authors declare no conflict of interest.
Figures
Similar articles
-
Ruthenium oxide based microelectrode arrays for in vitro and in vivo neural recording and stimulation.Acta Biomater. 2020 Jan 1;101:565-574. doi: 10.1016/j.actbio.2019.10.040. Epub 2019 Oct 31. Acta Biomater. 2020. PMID: 31678740 Free PMC article.
-
The Effect of Physical Structural Properties on Electrochemical Properties of Ruthenium Oxide for Neural Stimulating and Recording Electrodes.Annu Int Conf IEEE Eng Med Biol Soc. 2024 Jul;2024:1-4. doi: 10.1109/EMBC53108.2024.10781914. Annu Int Conf IEEE Eng Med Biol Soc. 2024. PMID: 40039067
-
Measuring Both pH and O2 with a Single On-Chip Sensor in Cultures of Human Pluripotent Stem Cell-Derived Cardiomyocytes to Track Induced Changes in Cellular Metabolism.ACS Sens. 2021 Jan 22;6(1):267-274. doi: 10.1021/acssensors.0c02282. Epub 2020 Dec 29. ACS Sens. 2021. PMID: 33371688 Free PMC article.
-
Current Strategies and Challenges for Purification of Cardiomyocytes Derived from Human Pluripotent Stem Cells.Theranostics. 2017 May 17;7(7):2067-2077. doi: 10.7150/thno.19427. eCollection 2017. Theranostics. 2017. PMID: 28638487 Free PMC article. Review.
-
Biowire platform for maturation of human pluripotent stem cell-derived cardiomyocytes.Methods. 2016 May 15;101:21-6. doi: 10.1016/j.ymeth.2015.11.005. Epub 2015 Nov 4. Methods. 2016. PMID: 26546730 Review.
Cited by
-
Impedance Characteristics of Microfluidic Channels and Integrated Coplanar Parallel Electrodes as Design Parameters for Whole-Channel Analysis in Organ-on-Chip Micro-Systems.Biosensors (Basel). 2024 Aug 1;14(8):374. doi: 10.3390/bios14080374. Biosensors (Basel). 2024. PMID: 39194604 Free PMC article.
References
-
- Zhang Y.S., Aleman J., Shin S.R., Kilic T., Kim D., Shaegh S.A.M., Massa S., Riahi R., Chae S., Hu N., et al. Multisensor-integrated organs-on-chips platform for automated and continual in situ monitoring of organoid behaviors. Proc. Natl. Acad. Sci. USA. 2017;114:E2293–E2302. doi: 10.1073/pnas.1612906114. - DOI - PMC - PubMed
MeSH terms
Substances
Grants and funding
LinkOut - more resources
Full Text Sources
Other Literature Sources
