. 2021 Feb 18;11(2):523.
doi: 10.3390/nano11020523.

Bioconjugation of a PNA Probe to Zinc Oxide Nanowires for Label-Free Sensing

Affiliations

Bioconjugation of a PNA Probe to Zinc Oxide Nanowires for Label-Free Sensing

Teresa Crisci et al. Nanomaterials (Basel). .

Abstract

Zinc oxide nanowires (ZnONWs) are largely used in biosensing applications due to their large specific surface area, photoluminescence emission and electron mobility. In this work, the surfaces of ZnONWs are modified by covalent bioconjugation of a peptidic nucleic acid (PNA) probe whose sequence is properly chosen to recognize a complementary DNA (cDNA) strand corresponding to a tract of the CD5 mRNA, the main prognostic marker of chronic lymphatic leukemia. The interaction between PNA and cDNA is preliminarily investigated in solution by circular dichroism, CD melting, and polyacrylamide gel electrophoresis. After the immobilization of the PNA probe on the ZnONW surface, we demonstrate the ability of the PNA-functionalized ZnONW platform to detect cDNA in the μM range of concentration by electrical, label-free measurements. The specificity of the sensor is also verified against a non-complementary DNA sequence. These preliminary results highlight the potential application of PNA-bioconjugated ZnONWs to label-free biosensing of tumor markers.

Keywords: DNA; PNA probe; ZnO nanowire; label-free biosensing; surface functionalization.


Conflict of interest statement

The authors declare no conflict of interest.

Figures

Figure 1
Figure 1
Fabrication process of the ZnONWs electrical sensor.
Figure 2
Figure 2
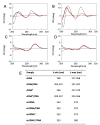
CD spectra of cDNA* and cDNA alone (black solid line, panel A and B, respectively) and after annealing with PNA (dashed line, A and B respectively); ctrlDNA* and ctrlDNA alone (solid black line, panel C and D respectively) and annealed with PNA at pH 7.0 (dashed line, C and D respectively); all samples were dissolved in 100 mM PBS. CD profiles of the arithmetic sum of each ON with PNA are reported as red lines. The CD spectrum of PNA alone is reported as a dotted line. All samples were normalized at 320 nm; Table (E) λ values of CD minima and maxima of each sample.
Figure 3
Figure 3
(A) Representative images of ZnONW-based electrical sensor. (B) SEM image of ZnONWs grown by hydrothermal synthesis.
Figure 4
Figure 4
PL spectra (A) and I–V curves (B) of ZnONW-based device after each functionalization step.
Figure 5
Figure 5
(A) Fluorescence microscopy imaging of ZnONW-based device before PNA immobilization (I) and after functionalization with 25 µM PNA* (II), 50 µM PNA* (III), 100 µM PNA* (IV), and 200 µM PNA* (V). (B) Mean fluorescence intensity of the device after functionalization with PNA* at different concentrations. Data were fitted using a dose-response curve (red line).
Figure 6
Figure 6
(A) Fluorescence microscopy imaging of ZnONW biochip surface after functionalization with 100 µM PNA probe and after incubation with 25, 50, and 100 µM cDNA*. (B) Mean fluorescence intensity, calculated from the images in (A), as a function of cDNA* concentration. Data were fitted using a linear regression model (red line).
Figure 7
Figure 7
(A) I–V characteristics of ZnONW-based electrical transducer functionalized with 100 uM PNA probe, before and after interaction with increasing concentrations of cDNA in the 10 to 125 µM range. (B) Normalized ΔR vs. cDNA concentration. Data were fitted using a dose-response model (black dash curve); data included between 75 and 100 µM were fitted by a linear model (red curve).
Figure 8
Figure 8
(A) Mean fluorescence intensity values of ZnONW-based devices after interaction with 100 µM cDNA* and 100 µM ctrlDNA*. (B) Normalized ΔR calculated from I–V curves of ZnONW-based devices after interaction with 100 µM cDNA and 100 µM ctrlDNA.

References

    1. Arshavsky-Graham S., Massad-Ivanir N., Segal E., Weiss S. Porous Silicon-Based Photonic Biosensors: Current Status and Emerging Applications. Anal. Chem. 2019;91:441–467. doi: 10.1021/acs.analchem.8b05028. - DOI - PubMed
    1. Terracciano M., Rea I., Borbone N., Moretta R., Oliviero G., Piccialli G., De Stefano L. Porous silicon-based aptasensors: The next generation of label-free devices for health monitoring. Molecules. 2019;24:2216. doi: 10.3390/molecules24122216. - DOI - PMC - PubMed
    1. Bala A., Górski Ł. Application of nucleic acid analogues as receptor layers for biosensors. Anal. Methods. 2016;8:236–244. doi: 10.1039/C5AY02620B. - DOI
    1. Teles F.R.R., Fonseca L.P. Trends in DNA biosensors. Talanta. 2008;77:606–623. doi: 10.1016/j.talanta.2008.07.024. - DOI
    1. Musumeci D., Platella C., Riccardi C., Moccia F., Montesarchio D. Fluorescence Sensing Using DNA Aptamers in Cancer Research and Clinical Diagnostics. Cancers. 2017;9:174. doi: 10.3390/cancers9120174. - DOI - PMC - PubMed

LinkOut - more resources