

A Log Ratio-Based Analysis of Individual Changes in the Composition of the Oral Microbiota in Different Dietary Phases
- PMID: 33670849
- PMCID: PMC7997190
- DOI: 10.3390/nu13030793
A Log Ratio-Based Analysis of Individual Changes in the Composition of the Oral Microbiota in Different Dietary Phases
Abstract
Background: Investigating the influence of nutrition on oral health has a long scientific history. Due to recent technical advances like sequencing techniques for the oral microbiota, this topic has gained scientific interest again. A basic challenge is to understand the influence of nutrition on the oral microbiota and on the interaction between the oral bacteria, which is also statistically challenging.
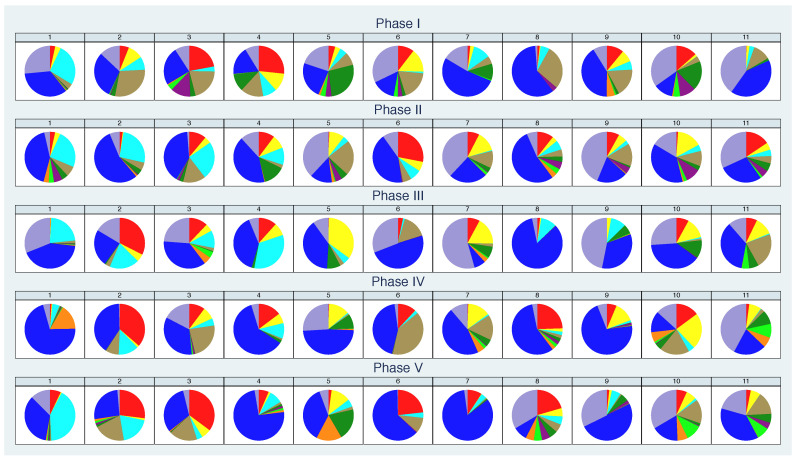
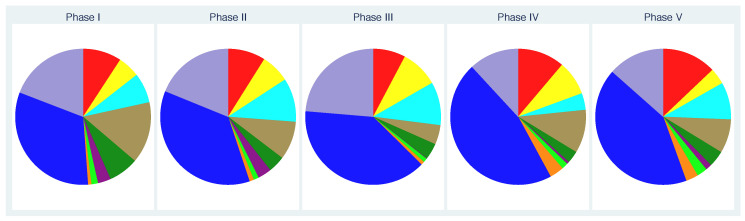
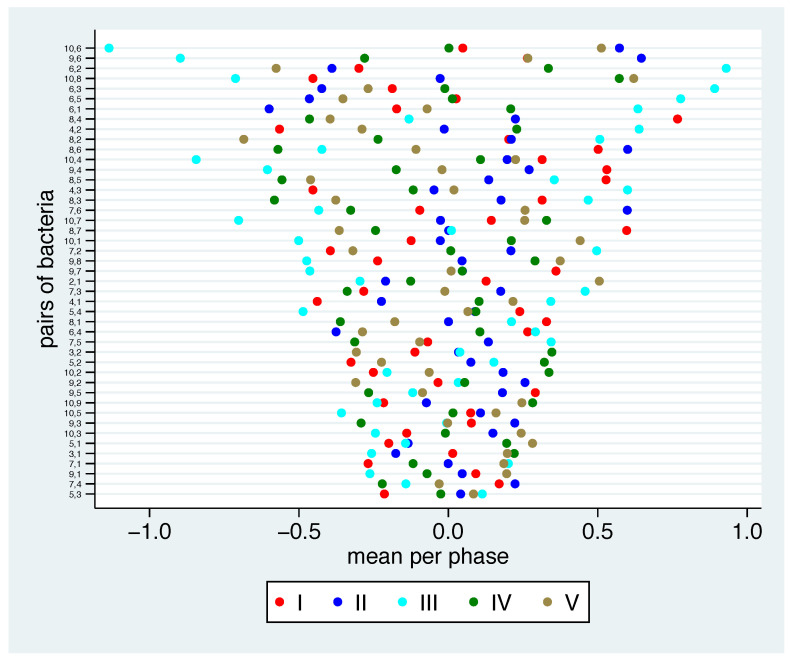
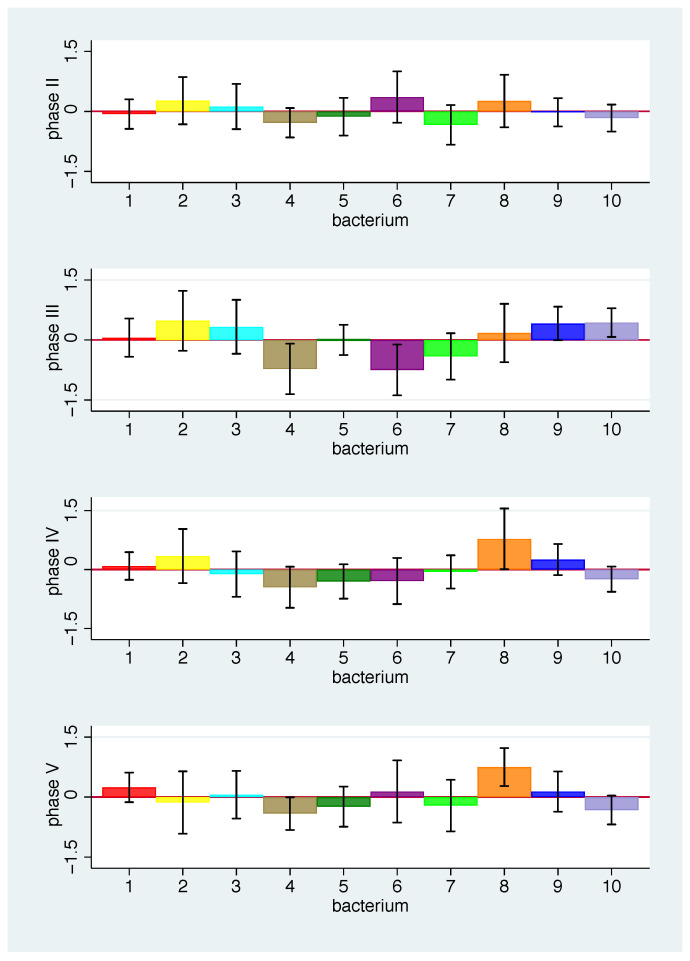
Methods: Log-transformed ratios of two bacteria concentrations are introduced as the basic analytic tool. The framework is illustrated by application in an experimental study exposing eleven participants to different nutrition schemes in five consecutive phases.
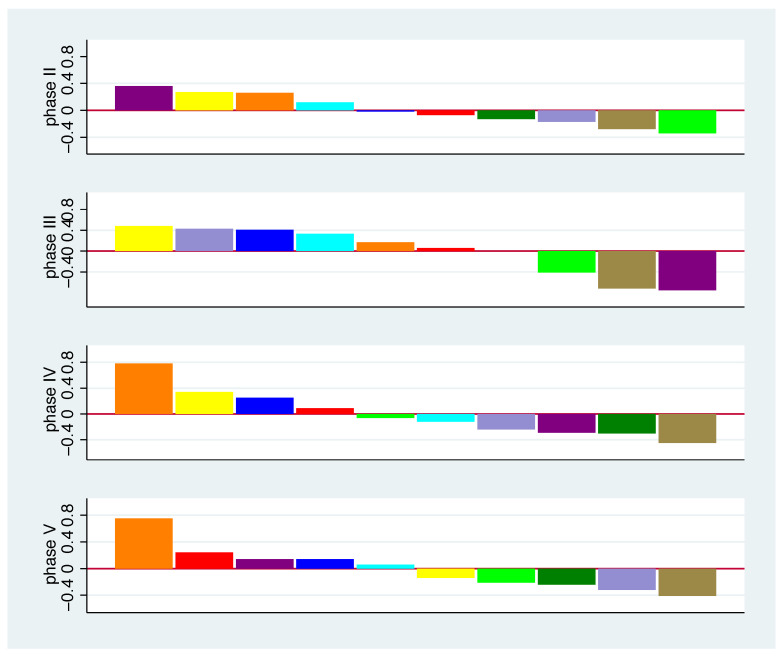
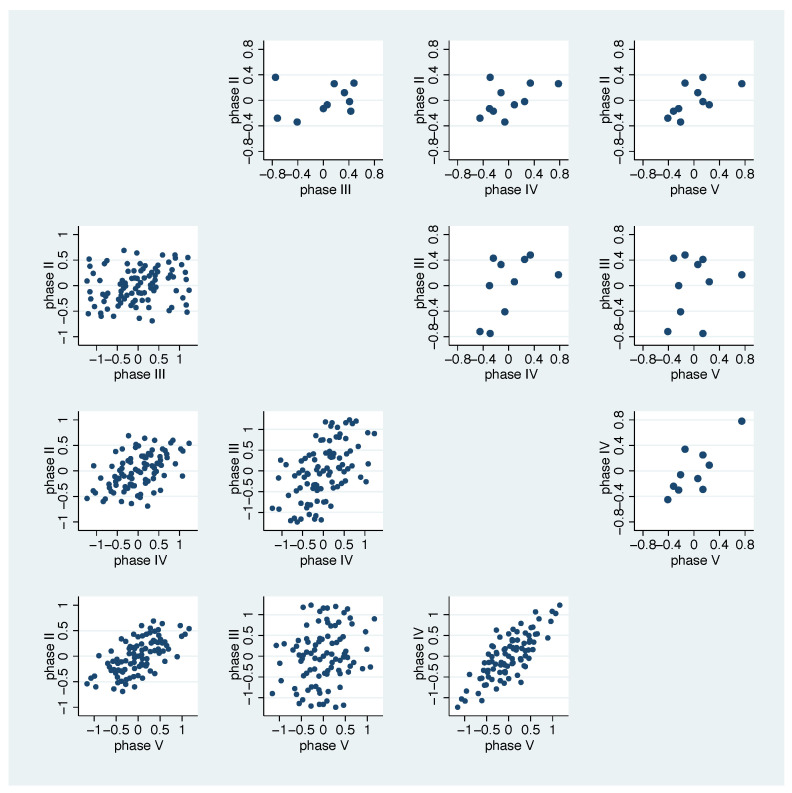
Results: The method could be sufficiently used to analyse the interrelation between the bacteria and to identify some bacterial groups with the same as well as different reactions to additional dietary components. It was found that the strongest changes in bacterial concentrations were achieved by the additional consumption of dairy products.
Conclusion: A log ratio-based analysis offers insights into the relation of different bacteria while taking specific features of compositional data into account. The presented methods allow becoming independent of the behaviour of other bacteria, which is a disadvantage of common analysis methods of compositions. The results indicate that modulations of the oral biofilm microbiota due to nutrition change can be attained.
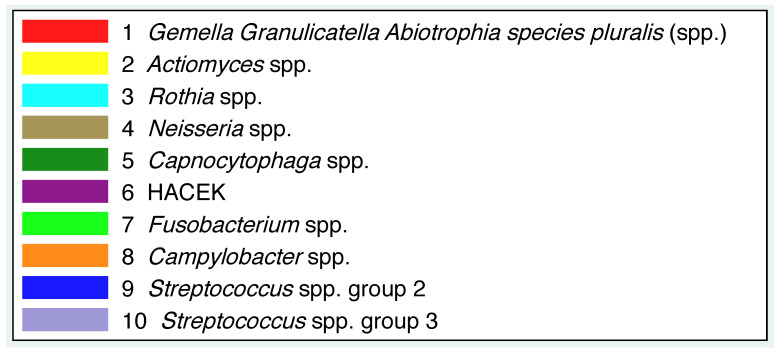
Keywords: compositional data; microbiome; nutrition; oral health; ratio fractions.
Conflict of interest statement
The authors report no conflicts of interest.
Figures
Similar articles
-
Examining the Composition of the Oral Microbiota as a Tool to Identify Responders to Dietary Changes.Nutrients. 2022 Dec 19;14(24):5389. doi: 10.3390/nu14245389. Nutrients. 2022. PMID: 36558547 Free PMC article.
-
Long-Term Fluctuation of Oral Biofilm Microbiota following Different Dietary Phases.Appl Environ Microbiol. 2020 Oct 1;86(20):e01421-20. doi: 10.1128/AEM.01421-20. Print 2020 Oct 1. Appl Environ Microbiol. 2020. PMID: 32801176 Free PMC article.
-
Uncultured Members of the Oral Microbiome.J Calif Dent Assoc. 2016 Jul;44(7):447-56. J Calif Dent Assoc. 2016. PMID: 27514156 Review.
-
Analysing the Relationship between Nutrition and the Microbial Composition of the Oral Biofilm-Insights from the Analysis of Individual Variability.Antibiotics (Basel). 2020 Aug 4;9(8):479. doi: 10.3390/antibiotics9080479. Antibiotics (Basel). 2020. PMID: 32759753 Free PMC article.
-
The Oral Microbiota.Adv Exp Med Biol. 2016;902:45-60. doi: 10.1007/978-3-319-31248-4_4. Adv Exp Med Biol. 2016. PMID: 27161350 Review.
Cited by
-
Impact of Oral Microbiota on Flavor Perception: From Food Processing to In-Mouth Metabolization.Foods. 2021 Aug 26;10(9):2006. doi: 10.3390/foods10092006. Foods. 2021. PMID: 34574116 Free PMC article. Review.
-
The Emerging Field of Nutritional Dentistry.Nutrients. 2022 May 16;14(10):2076. doi: 10.3390/nu14102076. Nutrients. 2022. PMID: 35631217 Free PMC article.
-
Examining the Composition of the Oral Microbiota as a Tool to Identify Responders to Dietary Changes.Nutrients. 2022 Dec 19;14(24):5389. doi: 10.3390/nu14245389. Nutrients. 2022. PMID: 36558547 Free PMC article.
References
MeSH terms
Grants and funding
LinkOut - more resources
Full Text Sources
Other Literature Sources
