. 2021 Feb 28;13(5):1002.
doi: 10.3390/cancers13051002.

Apoptotic Blocks in Primary Non-Hodgkin B Cell Lymphomas Identified by BH3 Profiling

Affiliations

Apoptotic Blocks in Primary Non-Hodgkin B Cell Lymphomas Identified by BH3 Profiling

Ryan N Rys et al. Cancers (Basel). .

Abstract

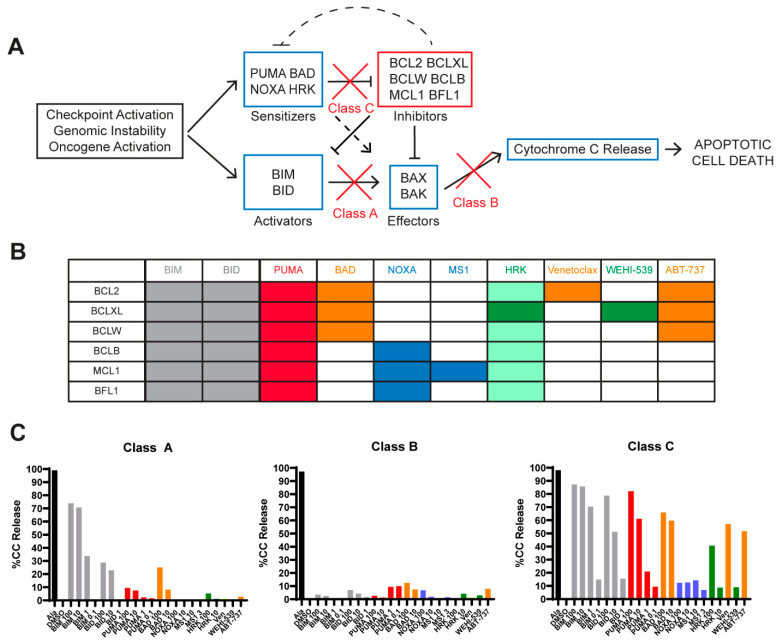
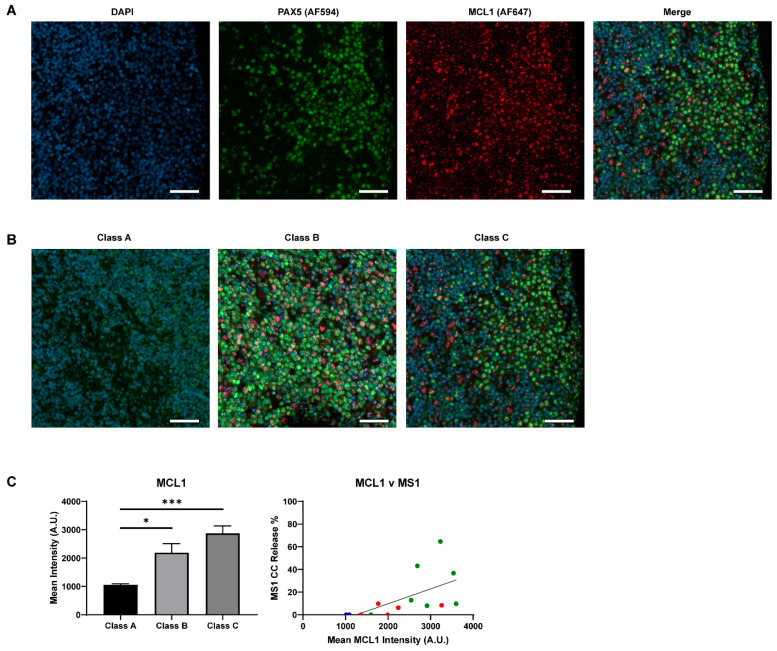
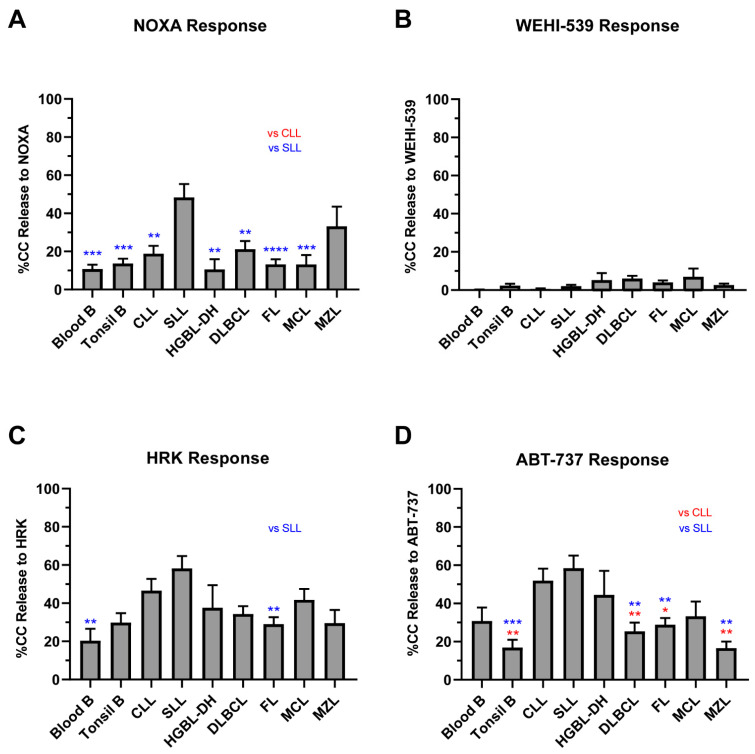
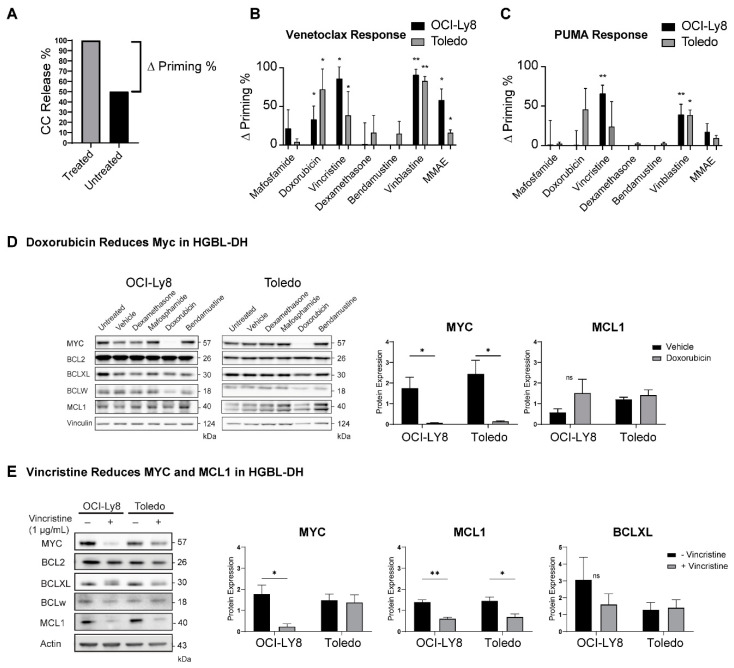
To determine causes of apoptotic resistance, we analyzed 124 primary B cell NHL samples using BH3 profiling, a technique that measures the mitochondrial permeabilization upon exposure to synthetic BH3 peptides. Our cohort included samples from chronic lymphocytic leukemia (CLL), follicular lymphoma (FL), diffuse large B-cell lymphoma (DLBCL), high-grade B cell lymphoma with translocations in MYC and BCL2 (HGBL-DH), mantle cell lymphoma (MCL) and marginal zone lymphoma (MZL). While a large number of our samples displayed appropriate responses to apoptosis-inducing peptides, pro-apoptotic functional defects, implicating BAX, BAK, BIM or BID, were seen in 32.4% of high-grade NHLs (12/37) and in 3.4% of low-grade NHLs (3/87, p < 0.0001). The inhibition of single anti-apoptotic proteins induced apoptosis in only a few samples, however, the dual inhibition of BCL2 and MCL1 was effective in 83% of samples, indicating MCL1 was the most common cause of lack of response to the BCL2 inhibitor, venetoclax. We then profiled Toledo and OCI-Ly8 high-grade lymphoma cell lines to determine which drugs could reduce MCL1 expression and potentiate venetoclax responses. Doxorubicin and vincristine decreased levels of MCL1 and increased venetoclax-induced apoptosis (all p < 0.05). Overall, in primary NHLs expressing BCL2 that have no defects in pro-apoptotic signaling, a poor response to venetoclax is primarily due to the presence of MCL1, which may be overcome by combining venetoclax with doxorubicin and vincristine-based chemotherapy or with other anti-microtubule inhibitors.

Keywords: BCL2; BH3 profiling; DLBCL; MCL1; NHL; apoptosis; venetoclax.


Conflict of interest statement

N.A.J. has received research funding from Roche Canada and consulting fees/honoraria from Roche, Abbvie, Lundbeck, Seattle Genetics, Janssen, and Gilead. At the time of submission, C.M.W. is employed by Astrazeneca plc. A.L. discloses consulting and laboratory research support from AbbVie, Novartis, and Astrazeneca. He is an equity-holding co-founder of Flash Therapeutics and Vivid Biosciences.

Figures

Figure 1
Figure 1
BH3 profiling assay: rationale and methodology. (Adapted from Deng et al. [16]). (A) Anti-apoptotic BCL2 family members inhibit the mitochondrial apoptotic pathway. Upon oncogene activation or cellular damage, activator and/or sensitizer proteins are upregulated, which allows BAX and BAK to oligomerize, leading to cytochrome c release, which results in apoptotic cell death. Anti-apoptotic BCL2 family members inhibit pro-apoptotic and sensitizer proteins, preventing BAX and BAK from inducing mitochondrial outer membrane polarization (MOMP), the commitment to apoptosis. (B) Pattern of interaction between the anti-apoptotic proteins (rows) present in cells and the pro-apoptotic synthetic peptides or drugs (columns) used in the BH3 profiling assay. PUMA (illustrated by red columns) inhibits all the inhibitors and is a pan-sensitizer, as well as contributing to BAX and BAK activation. Orange colors indicate peptides that inhibit the BCL2 protein with venetoclax inhibiting only BCL2 whereas BAD and ABT-737 inhibit BCL2, BCLXL, and BCLW. Blue columns are used to highlight mantle cell lymphoma (MCL)1-dependence where MS1 specifically inhibits MCL1, whereas NOXA inhibits BCLB, MCL1 and BFL1. Green columns indicate BCL-XL-dependence where WEHI-539 only inhibits BCLXL and HRK is mainly a BCL-XL inhibitor but can also inhibit other anti-apoptotic proteins with lower affinities, including BCL2. (C) BH3 profiles are illustrated in graphical form with % of the cells undergoing cytochrome c release on the Y axis after exposure to each drug/peptide on the X axis. Alamethecin (ALA) is a control that induces cytochrome c release in all cells independent of BAX or BAK. DMSO is the negative vehicle control because it does not induce cytochrome c release. Representative samples from our cohort were used to demonstrate different classes of apoptotic block. This high-grade B cell lymphoma with translocations in MYC and BCL2 (HGBL-DH) sample shows a class A block, where cells were competent to undergo apoptosis (i.e., functional BAX/BAK) because exogenous activators BIM and BID could induce MOMP (grey bars). Two diffuse large B-cell lymphoma (DLBCL) samples shown here represent a class B and C BH3 profile. In class B blocks, cells fail to undergo MOMP upon exposure to BIM or BID BH3 synthetic peptides, indicating that there is no functional BAX or BAK, and are incompetent for undergoing apoptosis through the mitochondrial pathway. In class C blocks, cells are competent to undergo apoptosis (grey BIM/BID), primed (red PUMA) and depend mainly on BCL2 (orange bars).
Figure 2
Figure 2
BH3 profiling of peripheral blood (PB) and tonsil B cells. (A) The percentage of cells undergoing cytochrome c release is displayed on the y-axis according to different cell subsets identified on the x-axis. Shown is the comparison of frozen B lymphocytes from tonsils and peripheral blood. Tonsillar B cells have lower responses to BIM and PUMA, while showing increased responses to MS1. Bars represent the mean ± standard error of the mean (SEM). Analysis was carried out using a 2-way ANOVA comparing peptide exposure or subtype with cytochrome c release. * p < 0.05, ** p < 0.01, **** p < 0.0001. (B) Representative merged immunofluorescence (IF) images of normal tonsil. Images were taken on a 20× objective highlighting staining of DAPI (blue), PAX5 (green, AF594) and the protein of interest (red, AF647). Scale bars represent 50 µm. Pro-apoptotic proteins are expressed in normal germinal center (GC) cells, along with MCL1. BCL2 expression is confined to the edges of the GC follicle and PAX5 negative cells.
Figure 3
Figure 3
Competency and priming of the mitochondrial pathway according to lymphoma subtype. We measured cytochrome c release, displayed on the y-axis, after exposure to 100 μM of BIM (A) and 100 μM of PUMA (B) peptides in different untreated lymphoma subsets (10 frozen blood B, 14 tonsil B, 16 chronic lymphocytic leukemia (CLL), 11 small lymphocytic leukemia (SLL), 7 high-grade B cell lymphomas with translocations in MYC and BCL2 (HGBL-DH), 30 DLBCL, 38 follicular lymphoma (FL), 12 mantle cell lymphoma (MCL), 10 marginal zone lymphoma (MZL)). For BIM, we defined a threshold of <30% as having a class B block, i.e., having dysfunctional BAX or BAK. For PUMA, we defined a threshold of <30% as being unprimed. Red dashed lines highlight the 30% cut-off, with samples below this threshold being class A/B apoptotic blocks. Class A block samples are in blue and class B block samples are in red. Dots represent individual samples, bars represent the mean ± standard error of the mean (SEM). A one-way ANOVA with Tukey multiple comparison was used to determine statistical significance between non-Hodgkin lymphoma (NHL) subtypes. Only comparison to DLBCL was determined to be significantly different in BIM response. DLBCL samples are less primed than other NHL and high-grade lymphomas have a higher percentage of class A/B blocks. * p < 0.05, ** p < 0.01, *** p < 0.001. (C) Representative merged IF stains at 20× for DAPI (blue), PAX5 (green, AF594) and BIM/BAX (red, AF647) in class A, B, and C DLBCL samples. Scale bars represent 50 µm. (D) Quantification of the mean pixel intensity across all classes of apoptotic block in DLBCL. Samples were analyzed using Qupath software and t-test with Welch’s correction was used to compare columns, bars represent the mean ± standard error of the mean (SEM). * p < 0.05, ** p < 0.01. Class A samples may have decreased expression of BIM and possibly BAX compared to Class B and C samples.
Figure 4
Figure 4
Sensitivities to BCL2 and MCL1 inhibition according to lymphoma subtype. We measured cytochrome c release, displayed on the y-axis, after exposure to 1 μM of venetoclax and 10 μM of MS1 in different lymphoma subsets (x-axis). A one-way ANOVA with Tukey multiple comparison was used to determine statistical significance between NHL subtypes. Bars represent the mean ± standard error of mean (SEM). (A) Comparison of lymphoma subtypes based on venetoclax response. CLL, SLL, and HGBL-DH showed notable responses to BCL2 inhibition. (B) Venetoclax responses in DLBCL and HGBL-DH samples according to BCL2 protein expression (present in >50% of cells). Venetoclax responses were not seen in high-grade NHL in the absence of BCL2. T-test with Welch’s correction was applied to assess significance. (C) MS1 responses in lymphoma subtypes. SLL displays the greatest response to single MCL1 inhibition. (D) NHL response to dual inhibition of BCL2 and MCL1 by venetoclax and MS1. All subtypes display increased responses when compared to singular inhibition. * p < 0.05, ** p < 0.01, *** p < 0.001. Abbreviations: CLL, chronic lymphocytic leukemia; FL, follicular lymphoma; DLBCL, diffuse large B cell lymphoma; HGBL-DH, high grade B cell lymphoma with translocations in MYC and BCL2; MCL, mantle cell lymphoma; MZL, marginal zone lymphoma.
Figure 5
Figure 5
Expression of MCL1 in DLBCL by immunofluorescence. (A) Representative 20× single channel images of DAPI (blue), PAX5 (green, AF594), and MCL1 (red, AF647), as well as a merged image, in a class C sample. Scale bars represent 50 µm. (B) Qualitative comparison of MCL1 expression in class A, B, and C samples. The same sample from panel A is used in this panel. PAX5 staining was weak in class A when co-stained with MCL1, but this tissue was confirmed to be PAX5 positive in previous stains. Scale bars represent 50 µm. (C) The mean pixel intensity of all samples in each class, as calculated by Qupath. T-test with Welch’s correction was used to compare columns, bars represent the mean ± standard error of the mean (SEM). Spearman linear regression analysis was applied to analyze the correlation between cytochrome c release to MS1 (10 µM) and mean MCL1 intensity (R2 = 0.3525). Dot colors represent class of sample: A (blue), B (red), C (green). Response was only seen in class C samples with high MCL1 expression and mean MCL1 expression was lower in Class A/B samples * p < 0.05, *** p < 0.001.
Figure 6
Figure 6
BCLXL and other anti-apoptotic protein dependency. Graphs show cytochrome c release after 90-min exposure to 100 μM of NOXA (A), 1 μM of ABT-737 (B), 1 μM of WEHI-539 (C), and 100μM of HRK (D) in all NHL subtypes. Bars measure the mean of all samples; error bars indicate standard error of the mean (SEM). A one-way ANOVA with Tukey multiple comparison was used to determine statistical significance between subtypes. NHLs respond poorly to the singular inhibition of anti-apoptotic proteins but respond better when multiple proteins are targeted. BCLXL contributes only modestly to cell survival in our cohort. * p < 0.05, ** p < 0.01, *** p < 0.001, **** p < 0.0001.
Figure 7
Figure 7
Dynamic BH3 profiling performed in Toledo and OCI-Ly8 cell lines. The % of untreated cells undergoing cytochrome c release was subtracted from the % of cells undergoing cytochrome c release in treated samples to determine an increase in release named “Δ Priming” (example shown in panel (A)). Cytochrome c release was measured in cells upon exposure to 1 µM of venetoclax (B) and 1 µM PUMA (C) after a 17 h incubation with dimethyl sulfoxide (control) and different drugs. Welch’s t tests were used to compare individual treatments to the individual control groups. Microtubule targeting components of RCHOP such as doxorubicin and vincristine increased cells priming and sensitivity to venetoclax. *p < 0.05, **p < 0.01. (D) Western blot measuring anti-apoptotic protein and MYC levels in OCI-Ly8 and Toledo cell lines after 17 h treatment with dexamethasone, mafosphamide, doxorubicin, and bendamustine. Doxorubicin significantly decreases the expression of MYC in both cell lines after treatment. (E) Western blot measuring anti-apoptotic protein and MYC levels in OCI-Ly8 and Toledo cell lines after 17 h treatment with vincristine. Bars measure the mean of all samples, error bars indicate SEM. Vincristine significantly reduces MCL1 expression in both cell lines while also reducing MYC expression in OCI-LY8. BCLXL was not significantly reduced after treatment with vincristine. * p < 0.05, ** p < 0.01. ns, non-significant.

Similar articles

Cited by

References

    1. Reed J.C., Cuddy M., Slabiak T., Croce C.M., Nowell P.C. Oncogenic potential of bcl-2 demonstrated by gene transfer. Nature. 1988;336:259–261. doi: 10.1038/336259a0. - DOI - PubMed
    1. Vaux D.L., Cory S., Adams J.M. Bcl-2 gene promotes haemopoietic cell survival and cooperates with c-myc to immortalize pre-B cells. Nature. 1988;335:440–442. doi: 10.1038/335440a0. - DOI - PubMed
    1. Swerdlow S.H., Campo E., Pileri S.A., Harris N.L., Stein H., Siebert R., Advani R., Ghielmini M., Salles G.A., Zelenetz A.D., et al. The 2016 revision of the World Health Organization classification of lymphoid neoplasms. Blood. 2016;127:2375–2390. doi: 10.1182/blood-2016-01-643569. - DOI - PMC - PubMed
    1. Johnson N.A., Slack G.W., Savage K.J., Connors J.M., Ben-Neriah S., Rogic S., Scott D.W., Tan K.L., Steidl C., Sehn L.H., et al. Concurrent expression of MYC and BCL2 in diffuse large B-cell lymphoma treated with rituximab plus cyclophosphamide, doxorubicin, vincristine, and prednisone. J. Clin. Oncol. 2012;30:3452–3459. doi: 10.1200/JCO.2011.41.0985. - DOI - PMC - PubMed
    1. Green T.M., Young K.H., Visco C., Xu-Monette Z.Y., Orazi A., Go R.S., Nielsen O., Gadeberg O.V., Mourits-Andersen T., Frederiksen M., et al. Immunohistochemical double-hit score is a strong predictor of outcome in patients with diffuse large B-cell lymphoma treated with rituximab plus cyclophosphamide, doxorubicin, vincristine, and prednisone. J. Clin. Oncol. 2012;30:3460–3467. doi: 10.1200/JCO.2011.41.4342. - DOI - PubMed

Grants and funding

LinkOut - more resources