. 2021 Feb 28;13(5):1005.
doi: 10.3390/cancers13051005.

Obesity-Activated Lung Stromal Cells Promote Myeloid Lineage Cell Accumulation and Breast Cancer Metastasis

Affiliations

Obesity-Activated Lung Stromal Cells Promote Myeloid Lineage Cell Accumulation and Breast Cancer Metastasis

Lauren E Hillers-Ziemer et al. Cancers (Basel). .

Abstract

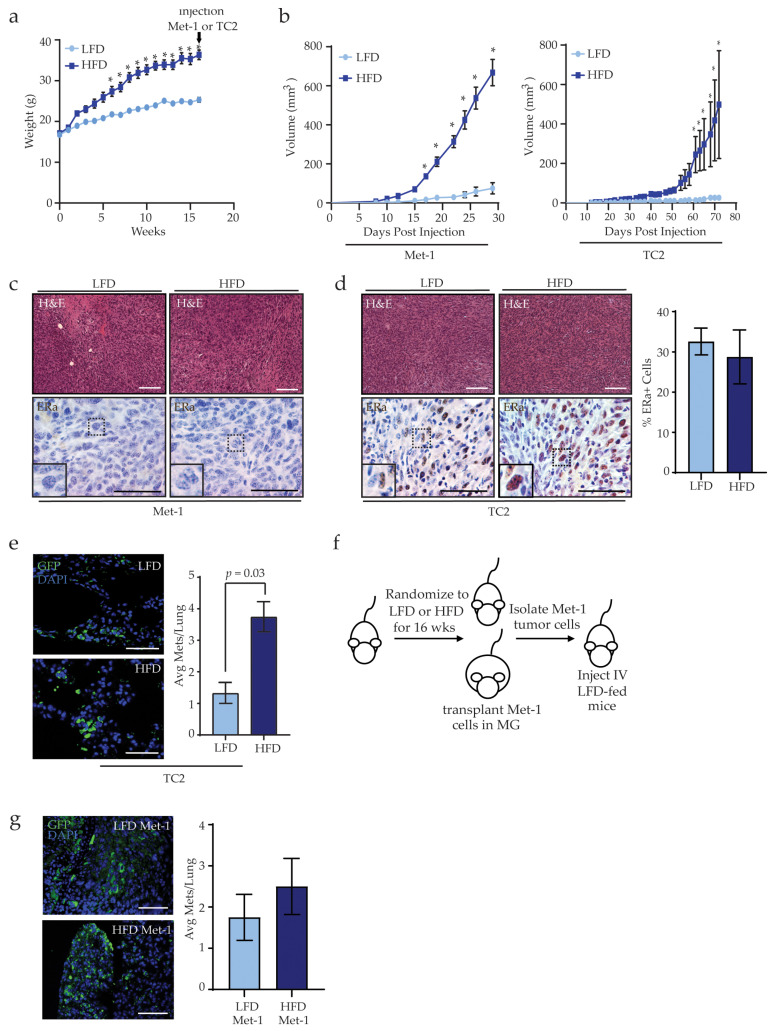
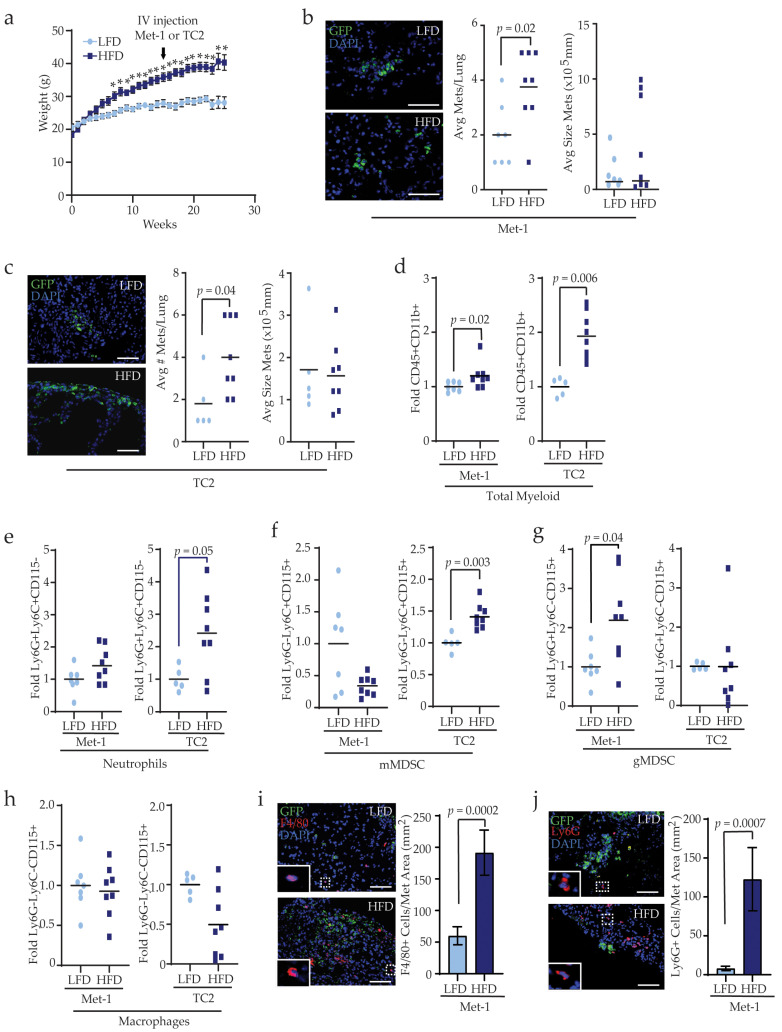
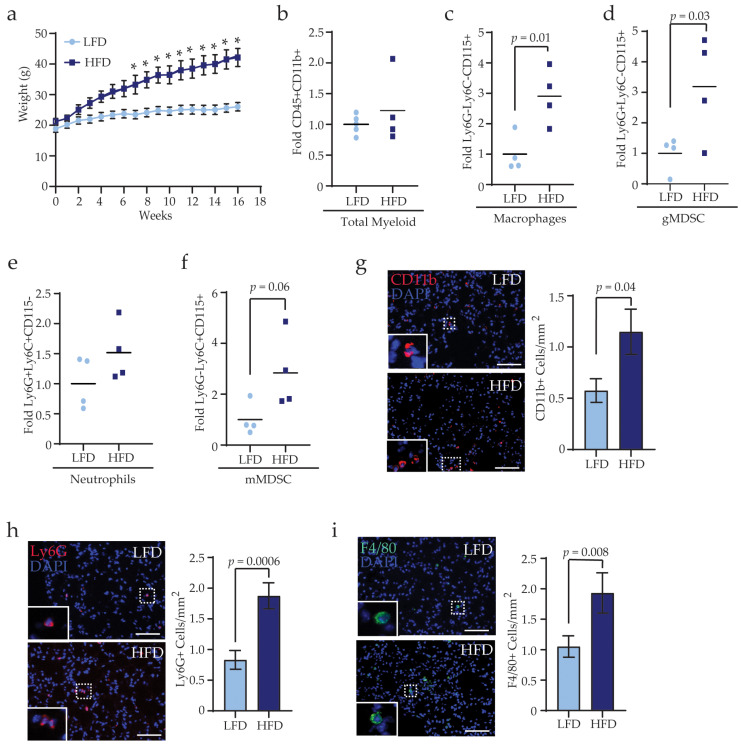
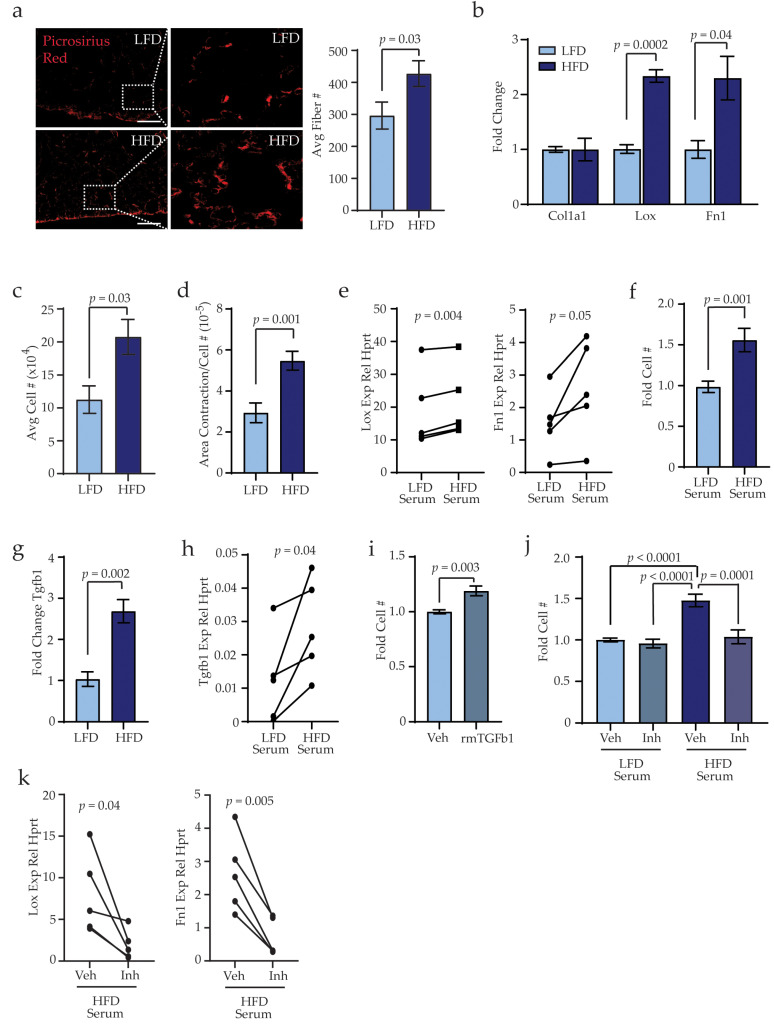
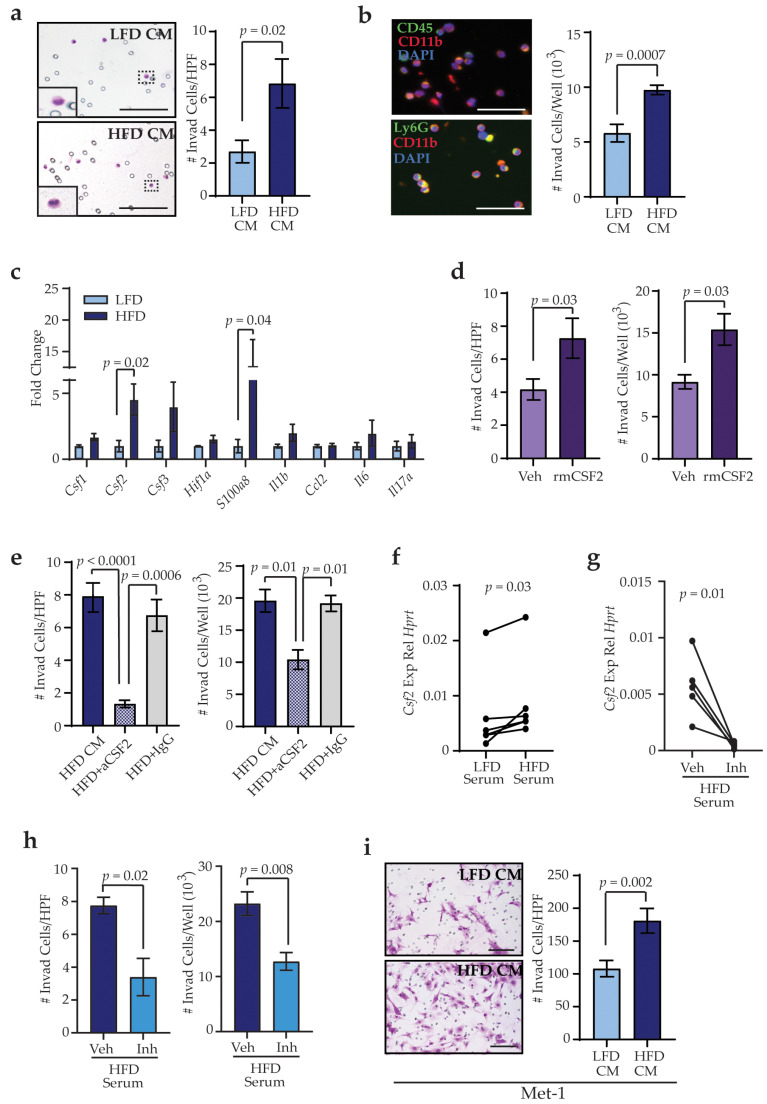
Obesity is correlated with increased incidence of breast cancer metastasis; however, the mechanisms underlying how obesity promotes metastasis are unclear. In a diet-induced obese mouse model, obesity enhanced lung metastasis in both the presence and absence of primary mammary tumors and increased recruitment of myeloid lineage cells into the lungs. In the absence of tumors, obese mice demonstrated increased numbers of myeloid lineage cells and elevated collagen fibers within the lung stroma, reminiscent of premetastatic niches formed by primary tumors. Lung stromal cells isolated from obese tumor-naïve mice showed increased proliferation, contractility, and expression of extracellular matrix, inflammatory markers and transforming growth factor beta-1 (TGFβ1). Conditioned media from lung stromal cells from obese mice promoted myeloid lineage cell migration in vitro in response to colony-stimulating factor 2 (CSF2) expression and enhanced invasion of tumor cells. Together, these results suggest that prior to tumor formation, obesity alters the lung microenvironment, creating niches conducive to metastatic growth.

Keywords: breast cancer; collagen; lung fibroblasts; macrophages; metastasis; obesity.


Conflict of interest statement

The authors declare no conflict of interest.

Figures

Figure 1
Figure 1
Obesity increases breast cancer metastasis. (a) Weight gain of female mice fed either the low-fat diet (LFD) or high-fat diet (HFD) for 16 weeks prior to tumor cell transplantation (arrow; n = 8 mice/group, * p < 0.05). (b) Growth curves of Met-1 or TC2 tumor cells transplanted into mammary glands of LFD- or HFD-fed female mice (n = 4 mice/group, * p < 0.05). (c) Representative images of Met-1 tumors stained with hematoxylin and eosin (H&E) or immunohistochemistry (IHC) to detect estrogen receptor alpha (ERα). (d) Representative images of TC2 tumors stained with H&E or IHC for ERα. Quantification of ERα+ cells in tumors from LFD- or HFD-fed mice (n = 4 mice/group). (e) Quantification of metastatic foci of green fluorescent protein (GFP)-expressing TC2 tumor cells in lungs of LFD- and HFD-fed mice (n = 4 mice/group). (f) Schematic of experiment to inject tumor cells into the tail vein of LFD-fed mice. (g) Quantification of Met-1 metastatic foci in lungs of LFD-fed mice (n = 5 mice/group). Magnification bars = 50 μm.
Figure 2
Figure 2
Obesity enhances myeloid lineage cells during metastasis. (a) Weight gain of mice fed LFD (n = 12 mice) or HFD (n = 16 mice). Arrow indicates the time point of tail vein injections of Met-1 or TC2 cells (* p < 0.05). Quantification of number and size of GFP+ metastatic foci in lungs of LFD- and HFD-fed mice injected with Met-1 (b) n = 7 mice LFD; n = 8 mice HFD) or TC2 (c) n = 5 mice LFD; n = 8 mice HFD) tumor cells. Flow cytometry quantification of CD45+CD11b+ myeloid lineage cells (d) Ly6G+Ly6C+CD115 neutrophils (e), Ly6GLy6C+CD115+ monocytic myeloid-derived suppressor cells (monocytic myeloid-derived suppressor cells (mMDSCs), (f) Ly6G+Ly6CCD115+ granulocytic MDSC (granulocytic MDSCs (gMDSCs), and (g) Ly6GLy6CCD115+ macrophages (h) in lungs from mice injected with either Met-1 or TC2 tumor cells. Results were normalized to CD45+CD11b+ cells and expressed as fold changes compared to controls. (i) Quantification of F4/80+ macrophages surrounding lung metastases (n = 5 mice/group). (j) Quantification of Ly6G+ neutrophils and gMDSC surrounding lung metastases. Magnification bars = 50 μm.
Figure 3
Figure 3
Obesity alters the compliment of myeloid lineage cells in lungs prior to metastasis. (a) Weight gain of female mice fed either LFD or HFD for 16 weeks (n = 8 mice/group, * p < 0.05). Flow cytometry quantification of CD45+CD11b+ myeloid lineage cells (b), Ly6GLy6CCD115+ macrophages (c), Ly6G+Ly6CCD115+ gMDSC (d), Ly6G+Ly6C+CD115 neutrophils (e), and Ly6GLy6C+CD115+ mMDSC (f). Results were normalized to CD45+CD11b+ cells and expressed as fold change compared to controls (n = 4 mice/group). Quantification of CD11b+ myeloid lineage cells (g), Ly6G+ neutrophils and gMDSCs (h), and F4/80+ macrophages (i) in lungs of LFD- and HFD-fed mice (n = 5 mice/group). Magnification bars = 50 μm.
Figure 4
Figure 4
Obesity alters lung stromal cells within the lungs in the absence of tumor formation. (a) Quantification of picrosirius red-stained collagen fibers in lung sections of LFD- and HFD-fed non-tumor-bearing mice (n = 5 mice/group). (b) Expression of extracellular matrix (ECM) components from primary lung stromal cells. Expression differences were normalized to hypoxanthine-guanine phosphoribosyltransferase (Hprt) and represented as fold change from controls (n = 6 mice/group). (c) Cell numbers of isolated lung stromal cells grown in culture for 6 days (n = 3 mice/group). (d) Average area of collagen contracted from lung stromal cells (n = 3 mice/group). (e) Lox and Fn1 expression in lung stromal cells isolated from LFD-fed mice treated with serum from LFD- or HFD-fed mice. Represented as relative expression compared to Hprt (n = 5 mice/group; paired t-test). (f) Cell numbers of isolated lung stromal cells from LFD-fed mice treated with serum from LFD- or HFD-fed mice for 6 days (n = 5 mice/group). (g) Expression of transforming growth factor beta-1 (Tgfβ1) from primary lung stromal cells. Expression differences were normalized to Hprt and represented as fold change from controls (n = 6 mice/group). (h) Tgfβ1 expression in lung stromal cells isolated from LFD-fed mice treated with serum from LFD- or HFD-fed mice. Represented as relative expression compared to Hprt (n = 5 mice/group; paired t-test). (i) Lung stromal cells from LFD-fed mice treated with vehicle (veh) or recombinant mouse (rm) TGFβ1 (n = 3 mice/group). (j) Lung stromal cells from LFD-fed mice treated with serum from LFD- or HFD-fed mice supplemented with veh or TGFβ inhibitor (inh) SB431542 (n = 3 mice/group). (k) Lox and Fn1 expression in lung stromal cells isolated from LFD-fed mice treated with serum from LFD- or HFD-fed mice. Represented as relative expression compared to Hprt (n = 5 mice/group; paired t-test). Magnification bars = 50 μm.
Figure 5
Figure 5
Lung stromal cells from HFD-fed mice recruit myeloid lineage cells through colony-stimulating factor 2 (CSF2) expression. (a) Quantification of adherent bone marrow-derived cells invading toward conditioned media from lung stromal cells from LFD- and HFD-fed mice in each high-power field (HPF, n = 5 mice/group). (b) Quantification of nonadherent bone marrow-derived cells in conditioned media from lung stromal cells (n = 5 mice/group). (c) Expression levels of cytokines from primary lung stromal cells. Differences were normalized to Hprt and represented as fold change from controls (n = 6–7 mice/group). (d) Quantification of adherent and nonadherent bone marrow-derived cells invading toward vehicle (veh) or recombinant mouse (rm) CSF2 (n = 3 experiments). (e) Quantification of adherent and nonadherent bone marrow-derived cells invading in response to conditioned media isolated from lung stromal cells from HFD-fed mice supplemented with vehicle, IgG antibodies, or blocking antibodies for CSF2 (n = 3 experiments). (f) Csf2 expression in lung stromal cells isolated from LFD-fed mice treated with serum from LFD- or HFD-fed mice. Represented as relative expression compared to Hprt (n = 5 mice/group; paired t-test). (g) Csf2 expression in lung stromal cells treated with serum from HFD-fed mice supplemented with vehicle or TGFβ inhibitor (inh) SB431542. Represented as relative expression compared to Hprt (n = 5 mice/group; paired t-test). (h) Quantification of adherent and nonadherent bone marrow-derived cells invading in response to conditioned media isolated from lung stromal cells treated with serum from HFD-fed mice supplemented with vehicle or SB431542 (n = 3 experiments). (i) Quantification of Met-1 cells invading toward conditioned media from lung stromal cells (n = 5 mice/group). Magnification bars = 50 μm.

Similar articles

Cited by

References

    1. World Health Organization Obesity and Overweight Fact Sheet. [(accessed on 15 August 2020)];2020 Available online: https://www.who.int/news-room/fact-sheets/detail/obesity-and-overweight.
    1. Lauby-Secretan B., Scoccianti C., Loomis D., Grosse Y., Bianchini F., Straif K. Body fatness and cancer--viewpoint of the IARC Working Group. N. Engl. J. Med. 2016;375:794–798. doi: 10.1056/NEJMsr1606602. - DOI - PMC - PubMed
    1. Lahmann P.H., Hoffmann K., Allen N., van Gils C.H., Khaw K.T., Tehard B., Berrino F., Tjønneland A., Bigaard J., Olsen A., et al. Body size and breast cancer risk: Findings from the European Prospective Investigation into Cancer and Nutrition (EPIC) Int. J. Cancer. 2004;111:762–771. doi: 10.1002/ijc.20315. - DOI - PubMed
    1. Chun J., El-Tamer M., Joseph K.A., Ditkoff B.A., Schnabel F. Predictors of breast cancer development in a high-risk population. Am. J. Surg. 2006;192:474–477. doi: 10.1016/j.amjsurg.2006.06.015. - DOI - PubMed
    1. Ewertz M., Jensen M.B., Gunnarsdottir K.A., Hojris I., Jakobsen E.H., Nielsen D., Stenbygaard L.E., Tange U.B., Cold S. Effect of obesity on prognosis after early-stage breast cancer. J. Clin. Oncol. 2011;29:25–31. doi: 10.1200/JCO.2010.29.7614. - DOI - PubMed

LinkOut - more resources