. 2021 Feb 28;26(5):1302.
doi: 10.3390/molecules26051302.

Interactions of Sea Anemone Toxins with Insect Sodium Channel-Insights from Electrophysiology and Molecular Docking Studies

Affiliations

Interactions of Sea Anemone Toxins with Insect Sodium Channel-Insights from Electrophysiology and Molecular Docking Studies

Beata Niklas et al. Molecules. .

Abstract

Animal venoms are considered as a promising source of new drugs. Sea anemones release polypeptides that affect electrical activity of neurons of their prey. Voltage dependent sodium (Nav) channels are the common targets of Av1, Av2, and Av3 toxins from Anemonia viridis and CgNa from Condylactis gigantea. The toxins bind to the extracellular side of a channel and slow its fast inactivation, but molecular details of the binding modes are not known. Electrophysiological measurements on Periplaneta americana neuronal preparation revealed differences in potency of these toxins to increase nerve activity. Av1 and CgNa exhibit the strongest effects, while Av2 the weakest effect. Extensive molecular docking using a modern SMINA computer method revealed only partial overlap among the sets of toxins' and channel's amino acid residues responsible for the selectivity and binding modes. Docking positions support earlier supposition that the higher neuronal activity observed in electrophysiology should be attributed to hampering the fast inactivation gate by interactions of an anemone toxin with the voltage driven S4 helix from domain IV of cockroach Nav channel (NavPaS). Our modelling provides new data linking activity of toxins with their mode of binding in site 3 of NavPaS channel.

Keywords: anemone toxins; docking; electrophysiology; fast inactivation; sodium channels.


Conflict of interest statement

The authors declare no conflict of interest. The funders had no role in the design of the study; in the collection, analyses, or interpretation of data; in the writing of the manuscript, or in the decision to publish the results.

Figures

Figure 1
Figure 1
A schematic view of the Periplaneta americana voltage dependent sodium channel (NavPaS) based on the Protein Data Bank structure 6A95 [15]. Helices S5 and S6 contributing to the pore formation are shown in blue. Helices S1-S4 forming voltage sensing domains (VSD) are in silver. An approximate location of the pore is indicated by the dashed line. Helix S4 of domain VSDIV is shown in purple. The C-terminal domain (CTD) is presented in orange and located close to it the hypothetical inactivation gate (IG) marked in red (a surface representation) as a part of DIII-DIV linker (red). Toxin binding site 3 region (dotted circle) is delineated by Glu1255 (yellow) and N-acetylglucosamine (NAG) molecule (cyan). In the top view, a single sodium ion is indicated as a red dot.
Figure 2
Figure 2
Sea anemone toxins increase the activity of the cockroach (Periplaneta americana) cercal nerve. (a) Original, representative records of cercal nerve activity are presented for control and after sea anemone toxin (Av3) application. The moment of stimulation is marked by an arrow. (b) Normalized nerve activity (measured as a surface under the peaks for response to mechanical stimulation of cerci—mV*ms) is presented in time after toxins application. Black dashed line represents the application of toxin in time “0”; the mean of values before toxin application was set as “initial value”. Grey dots represent control values, blue circles represent Av1 toxin, red triangles represent Av2 toxin, orange squares represent Av3 toxin, and green diamonds represent CgNa toxin. (c) For clarity, statistical differences between all groups were shown for the endpoint (activity in 20 min after application of toxin). The statistically significant differences between control and tested toxins are marked: * p < 0.05, ** p < 0.01, *** p < 0.001. The data is presented as mean values ± SE, n = 8.
Figure 3
Figure 3
Upper panel: Molecular shapes of anemone toxins studied. In the upper row, electrostatic potential is mapped on a molecular surface; positive = blue, negative = red. In cartoon representation, a peptide backbone is shown, and disulfide bonds are marked in yellow (licorice shapes). Lower panel: Neutral (green), hydrophobic (yellow), and charged (positive = blue, negative = red) residues being in close contacts with NavPaS site 3 residues are indicated.
Figure 4
Figure 4
Electrostatic potential maps projected on solvent accessible surfaces of anemone toxins, parts involved in the interface: (a) Av1, (b) Av2, (c) Av3, (d) CgNa, and (e) the site 3 region of NavPaS visualized from the extracellular side accessible to toxins. In red, negative potential regions are shown, and positive ones are in blue. The neutral regions are white/gray. Note that toxins projections are simply shifted from the docked complexes without mirror reflection. The Visual Molecular Dynamics (VMD) software was used to make these figures [22].
Figure 5
Figure 5
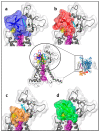
Representations of toxins binding to NavPaS channel site 3: for clarity, only a part of DIV (middle) is presented; (a) Av1 = blue, (b) Av2 = red, (c) Av3 = orange (d) CgNa = green. In purple, helix S4 is presented, E1255 is shown in a yellow licorice representation, and N-acetylglucosamine (NAG) is depicted in cyan licorice. A schematic structure of the whole NavPaS structure is presented in the middle right panel.
Figure 6
Figure 6
Contributions (in kcal/mol) of NavPaS residues to toxin binding energy measured by the SMINA scoring function (SSF) parameter. The role of each residue varies, depending on the toxin.
Figure 7
Figure 7
Pairs of residues forming hydrogen bonds and salt bridges between anemone toxins and NavPaS. Av1, Av2, Av3, and CgNa residues are indicated in blue, red, orange, and green, respectively. NavPaS residues are in black. Note that residues from 278–388 belong to DI, the rest to DIV of NavPaS. GetContacts server was used to determine contacts and prepare the plots [22].
Figure 8
Figure 8
(a) Schematic representation of voltage gated sodium channel in control conditions (upper raw) and in the presence of site-3 toxins (lower raw). The inactivation gate and voltage sensors (S4) of domains I-III and domain IV are indicated in green. Depolarization of membrane from resting potential to positive values leads to sodium channel activation, where S4 are moved outward and activation gate is opened, making the sodium channel conductive to sodium ions. Reaching the activation state does not require a full S4 movement in the IV domain. In the next step, S4 of the domain IV makes full outward movement and releases the inactivation gate, which closes the channel. When the membrane potential returns to its resting values (repolarization), all S4s move inward which close channel and push out the inactivation gate from channel pore. In the presence of site-3 toxin (lower panel), the complete movement of S4 in IV domain is not possible, allowing the channel to remain activated, not allowing the inactivation gate to close. As a result, the channels are opened until the membrane potential reaches its resting values. (b) Representation of action potential generation in typical, isolated nerve cell: In resting state, the membrane potential is highly negative inside (green area). Depolarization pulse leads to opening of the sodium channels; rapid influx of sodium ion pushes the membrane potential to positive values (red area). Next, fast inactivation blocks the Na+ conduction and the membrane potential returns to its resting value due to the outflow of potassium ions (blue area). In the presence of site-3 toxin, the inactivation of channels is inhibited; thus, they remain open and positive membrane potential is maintained (the plateau action potential is recorded).

Similar articles

Cited by

References

    1. Catterall W.A., Wisedchaisri G., Zheng N. The conformational cycle of a prototypical voltage-gated sodium channel. Nat. Chem. Biol. 2020;16:1314–1320. doi: 10.1038/s41589-020-0644-4. - DOI - PMC - PubMed
    1. Armstrong C.M. Na channel inactivation from open and closed states. Proc. Natl. Acad. Sci. USA. 2006;103:17991–17996. doi: 10.1073/pnas.0607603103. - DOI - PMC - PubMed
    1. Vassilev P.M., Scheuer T., Catterall W.A. Identification of an intracellular peptide segment involved in sodium channel inactivation. Science. 1988;241:1658–1661. doi: 10.1126/science.2458625. - DOI - PubMed
    1. Huang W., Liu M., Yan S.F., Yan N. Structure-based assessment of disease-related mutations in human voltage-gated sodium channels. Protein Cell. 2017;8:401–438. doi: 10.1007/s13238-017-0372-z. - DOI - PMC - PubMed
    1. Ryan D.P., Ptáček L.J. Episodic Neurological Channelopathies. Neuron. 2010;68:282–292. doi: 10.1016/j.neuron.2010.10.008. - DOI - PubMed

LinkOut - more resources