. 2021 Feb 28;13(3):796.
doi: 10.3390/nu13030796.

Effects of Vitamin D Supplementation on CD4+ T Cell Subsets and mTOR Signaling Pathway in High-Fat-Diet-Induced Obese Mice

Affiliations

Effects of Vitamin D Supplementation on CD4+ T Cell Subsets and mTOR Signaling Pathway in High-Fat-Diet-Induced Obese Mice

Jeong Hee An et al. Nutrients. .

Abstract

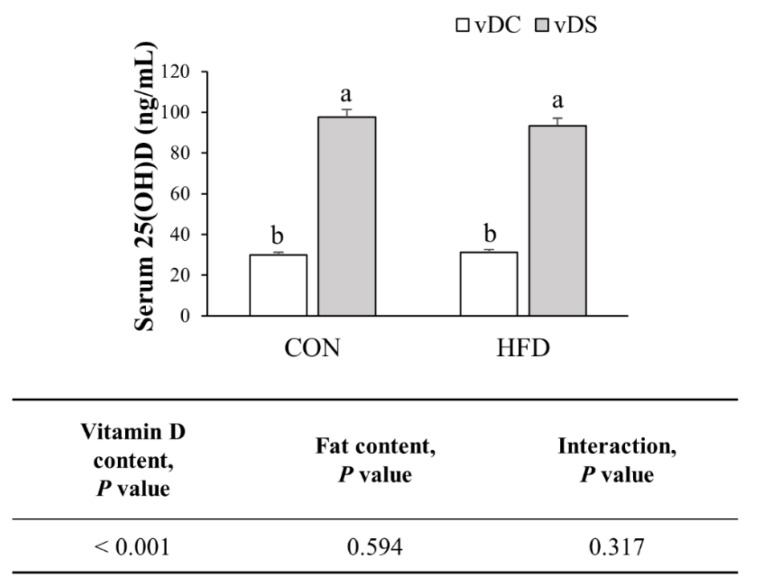
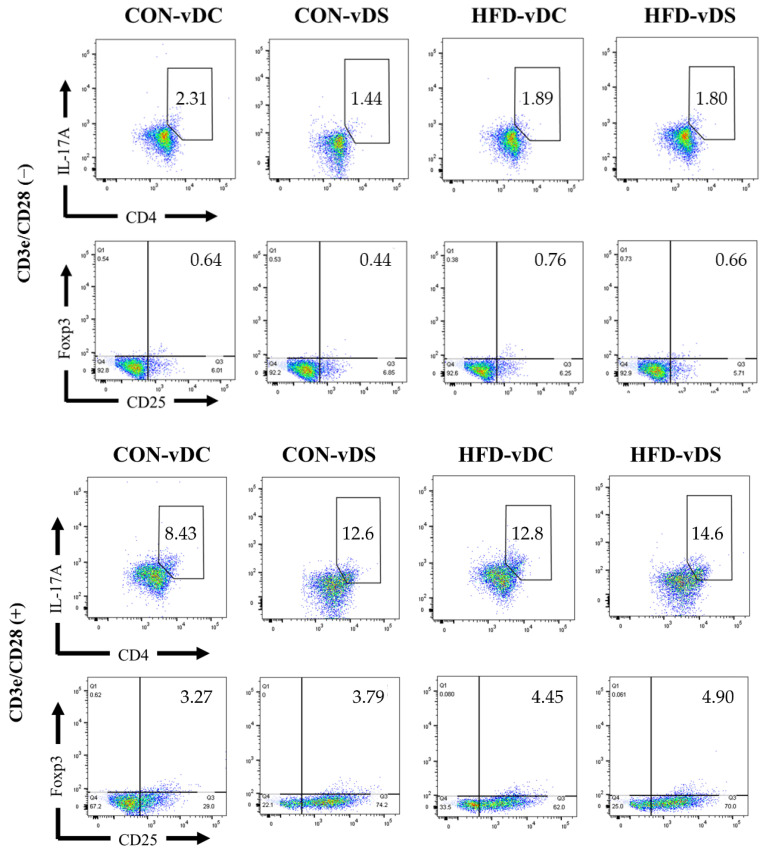
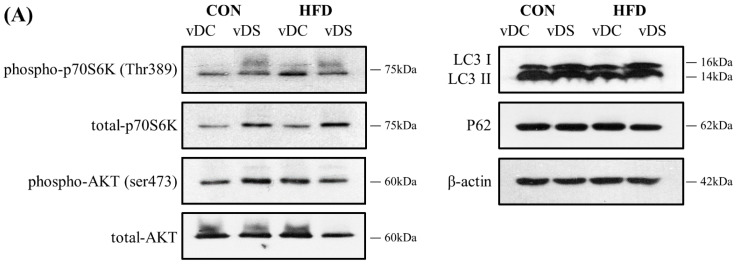
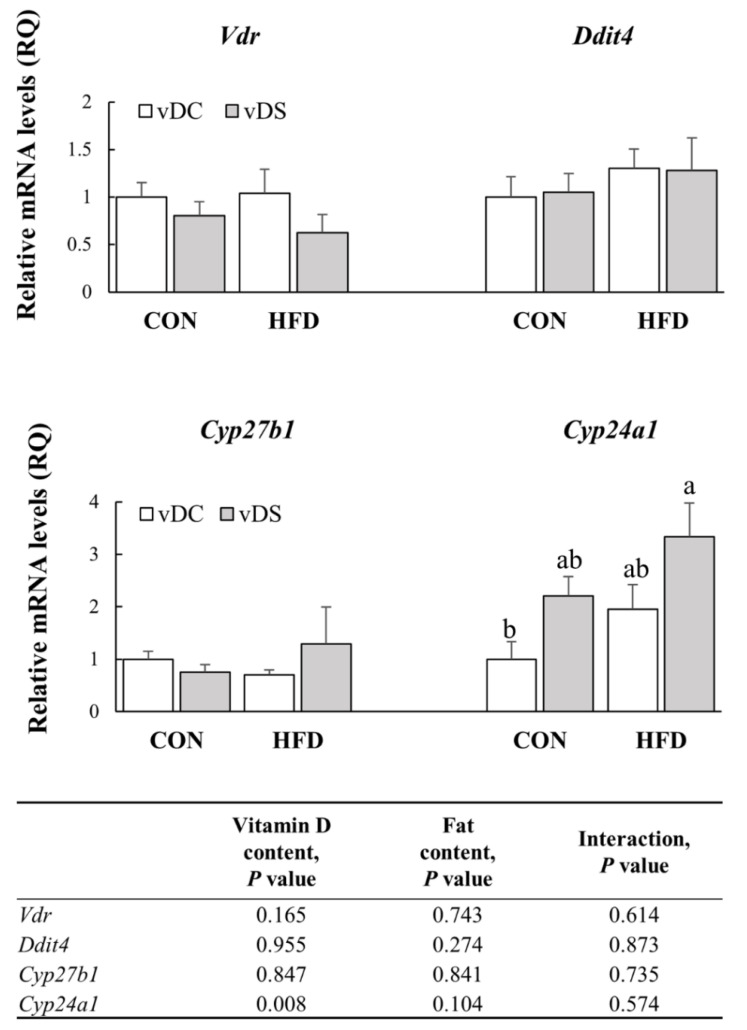
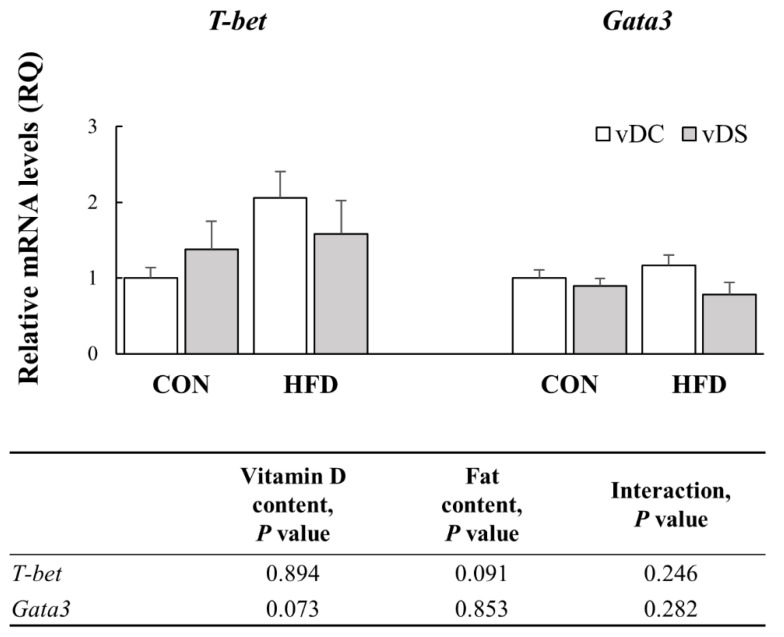
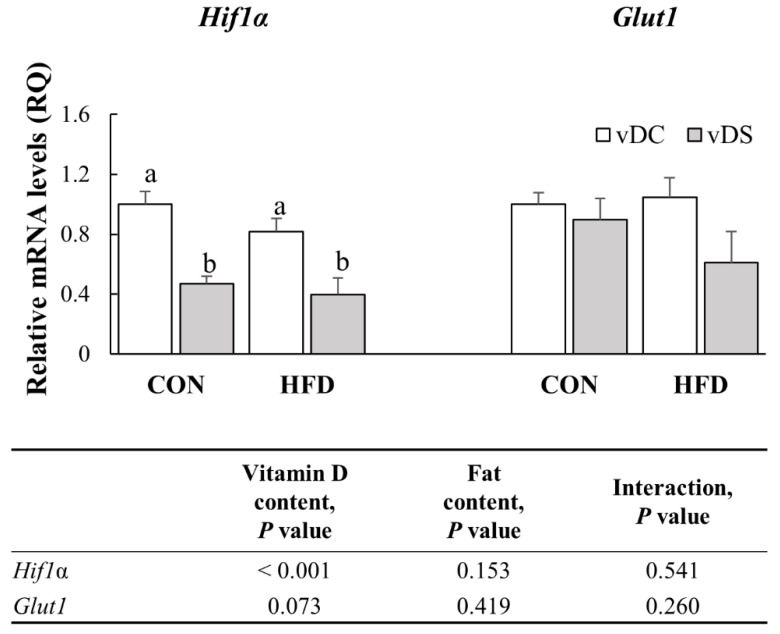
Obesity is associated with an impaired balance of CD4+ T cell subsets. Both vitamin D and obesity have been reported to affect the mTOR pathway. In this study, we investigated the effects of vitamin D on CD4+ T cell subsets and the mTOR pathway. Ten-week-old male C57BL/6 mice were divided into four groups and fed diets with different fat (control or high-fat diets: CON or HFD) and vitamin D contents (vitamin D control or supplemented diets: vDC or vDS) for 12 weeks. T cells purified by negative selection were stimulated with anti-CD3/anti-CD28 mAbs and cultured for 48 h. The percentage of CD4+IL-17+ T cells was higher in the vDS than vDC groups. The CD4+CD25+Foxp3+ T cells percentage was higher in HFD than CON groups. The phospho-p70S6K/total-p70S6K ratio was lower in vDS than vDC, but the phospho-AKT/total-AKT ratio was higher in vDS than vDC groups. Hif1α mRNA levels were lower in vDS than vDC groups. These findings suggest HIF1α plays an important role in vitamin-D-mediated regulation of glucose metabolism in T cells, and dietary vitamin D supplementation may contribute to the maintenance of immune homeostasis by regulating the mTOR pathway in T cells.

Keywords: CD4+ T cell; HIF1α; mTOR pathway; obesity; vitamin D supplementation.


Conflict of interest statement

The authors declare no conflict of interest.

Figures

Figure 1
Figure 1
Serum 25(OH)D concentration. Data are presented as means ± SEMs, n = 9 per group. Two-way ANOVA was used to determine the significant effects of fat and vitamin D contents, and an interaction. a,b Different superscripts indicate significant difference (p < 0.05) among individual groups, by Fisher’s least significant difference multiple comparison test. CON-vDC, 10% kcal fat diet + vitamin D control; CON-vDS, 10% kcal fat diet + vitamin D supplemented; HFD-vDC, 45% kcal fat diet + vitamin D control; HFD-vDS, 45% kcal fat diet + vitamin D supplemented.
Figure 2
Figure 2
Populations of CD4+IL-17+ T cells and CD4+CD25+Foxp3+ T cells (dot plots). The populations of CD4+IL-17+ T cells and CD4+CD25+Foxp3+ T cells are presented as dot plots of the FlowJo analyses. CON-vDC, 10% kcal fat diet + vitamin D control; CON-vDS, 10% kcal fat diet + vitamin D supplemented; HFD-vDC, 45% kcal fat diet + vitamin D control; HFD-vDS, 45% kcal fat diet + vitamin D supplemented.
Figure 3
Figure 3
Production of IFN-γ and IL-4 by T cells. Splenic T cells were stimulated with anti-CD3/anti-CD28 mAbs for 48 h and supernatants were harvested to determine the amount of IFN-γ and IL-4 by ELISA. Data are presented as means ± SEMs, n = 7 per group. Two-way ANOVA was used to determine the significant effects of fat and vitamin D contents, and an interaction. a,b Different superscripts indicate significant difference (p < 0.05) among individual groups, by Fisher’s least significant difference multiple comparison test. CON-vDC, 10% kcal fat diet + vitamin D control; CON-vDS, 10% kcal fat diet + vitamin D supplemented; HFD-vDC, 45% kcal fat diet + vitamin D control; HFD-vDS, 45% kcal fat diet + vitamin D supplemented.
Figure 4
Figure 4
Levels of proteins related with mTOR pathway in T cells. Splenic T cells were stimulated with anti-CD3/anti-CD28 mAbs for 48 h, and the expression levels of p70S6K, AKT, LC3, and P62 were determined by Western blot. (A) Representative Immunoblots of mTOR pathway proteins. (B) Data are presented as means ± SEMs, n = 5 per group. Two-way ANOVA was used to determine the significant effects of fat and vitamin D contents, and an interaction. a,b Different superscripts indicate significant difference (p < 0.05) among individual groups, by Fisher’s least significant difference multiple comparison test. CON-vDC, 10% kcal fat diet + vitamin D control; CON-vDS, 10% kcal fat diet + vitamin D supplemented; HFD-vDC, 45% kcal fat diet + vitamin D control; HFD-vDS, 45% kcal fat diet + vitamin D supplemented.
Figure 4
Figure 4
Levels of proteins related with mTOR pathway in T cells. Splenic T cells were stimulated with anti-CD3/anti-CD28 mAbs for 48 h, and the expression levels of p70S6K, AKT, LC3, and P62 were determined by Western blot. (A) Representative Immunoblots of mTOR pathway proteins. (B) Data are presented as means ± SEMs, n = 5 per group. Two-way ANOVA was used to determine the significant effects of fat and vitamin D contents, and an interaction. a,b Different superscripts indicate significant difference (p < 0.05) among individual groups, by Fisher’s least significant difference multiple comparison test. CON-vDC, 10% kcal fat diet + vitamin D control; CON-vDS, 10% kcal fat diet + vitamin D supplemented; HFD-vDC, 45% kcal fat diet + vitamin D control; HFD-vDS, 45% kcal fat diet + vitamin D supplemented.
Figure 5
Figure 5
mRNA levels of Vdr, Ddit4, Cyp27b1, and Cyp24a1 in T cells. Splenic T cells were stimulated with anti-CD3/anti-CD28 mAbs for 48 h, and the mRNA levels of Vdr, Ddit4, Cyp27b1 and Cyp24a1 were determined by qPCR. Data are presented as means ± SEMs, n = 7–9 per group. Two-way ANOVA was used to determine the significant effects of fat and vitamin D contents, and an interaction. a,b Different superscripts indicate significant difference (p < 0.05) among individual groups by Fisher’s least significant difference multiple comparison test. All values were normalized to the levels of housekeeping gene Gapdh and expressed as relative mRNA levels, compared with the average levels of the CON-vDC group. CON-vDC, 10% kcal fat diet + vitamin D control; CON-vDS, 10% kcal fat diet + vitamin D supplemented; HFD-vDC, 45% kcal fat diet + vitamin D control; HFD-vDS, 45% kcal fat diet + vitamin D supplemented.
Figure 6
Figure 6
mRNA levels of T-bet and Gata3 in T cells. Splenic T cells were stimulated with anti-CD3/anti-CD28 mAbs for 48 h, and the mRNA levels of T-bet and Gata3 were determined by qPCR. Data are presented as means ± SEMs, n = 7–9 per group. Two-way ANOVA was used to determine the significant effects of fat and vitamin D contents, and an interaction. All values were normalized to the levels of housekeeping gene Gapdh and expressed as relative mRNA levels compared with the average levels of the CON-vDC group. CON-vDC, 10% kcal fat diet + vitamin D control; CON-vDS, 10% kcal fat diet + vitamin D supplemented; HFD-vDC, 45% kcal fat diet + vitamin D control; HFD-vDS, 45% kcal fat diet + vitamin D supplemented.
Figure 7
Figure 7
mRNA levels of Hif1α and Glut1 in T cells. Splenic T cells were stimulated with anti-CD3/anti-CD28 mAbs for 48 h, and the mRNA levels of Hif1α and Glut1 were determined by qPCR. Data are presented as means ± SEMs, n = 7–9 per group. Two-way ANOVA was used to determine the significant effects of fat and vitamin D contents, and an interaction. a,b Different superscripts indicate significant difference (p < 0.05) among individual groups, by Fisher’s least significant difference multiple comparison test. All values were normalized to the levels of housekeeping gene Gapdh and expressed as relative mRNA levels, compared with the average levels of the CON-vDC group. CON-vDC, 10% kcal fat diet + vitamin D control; CON-vDS, 10% kcal fat diet + vitamin D supplemented; HFD-vDC, 45% kcal fat diet + vitamin D control; HFD-vDS, 45% kcal fat diet + vitamin D supplemented.

References

    1. Zhu J., Paul W.E. Peripheral CD4+ T-cell differentiation regulated by networks of cytokines and transcription factors. Immunol. Rev. 2010;238:247–262. doi: 10.1111/j.1600-065X.2010.00951.x. - DOI - PMC - PubMed
    1. Zhu J., Yamane H., Paul W.E. Differentiation of effector CD4 T cell populations. Annu. Rev. Immunol. 2010;28:445–489. doi: 10.1146/annurev-immunol-030409-101212. - DOI - PMC - PubMed
    1. Zoncu R., Efeyan A., Sabatini D.M. mTOR: From growth signal integration to cancer, diabetes and ageing. Nat. Rev. Mol. Cell Biol. 2011;12:21–35. doi: 10.1038/nrm3025. - DOI - PMC - PubMed
    1. Chi H. Regulation and function of mTOR signalling in T cell fate decisions. Nat. Rev. Immunol. 2012;12:325–338. doi: 10.1038/nri3198. - DOI - PMC - PubMed
    1. Delgoffe G.M., Kole T.P., Zheng Y., Zarek P.E., Matthews K.L., Xiao B., Worley P.F., Kozma S.C., Powell J.D. The mTOR kinase differentially regulates effector and regulatory T cell lineage commitment. Immunity. 2009;30:832–844. doi: 10.1016/j.immuni.2009.04.014. - DOI - PMC - PubMed

MeSH terms