

Immunogenomic Identification for Predicting the Prognosis of Cervical Cancer Patients
- PMID: 33671013
- PMCID: PMC7957482
- DOI: 10.3390/ijms22052442
Immunogenomic Identification for Predicting the Prognosis of Cervical Cancer Patients
Abstract
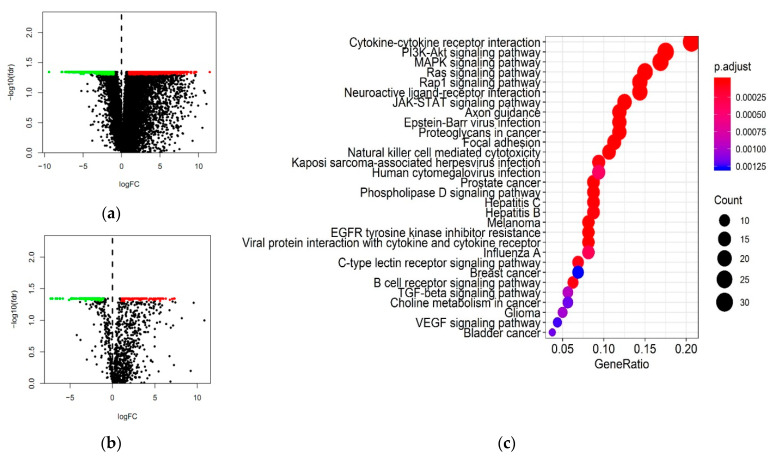
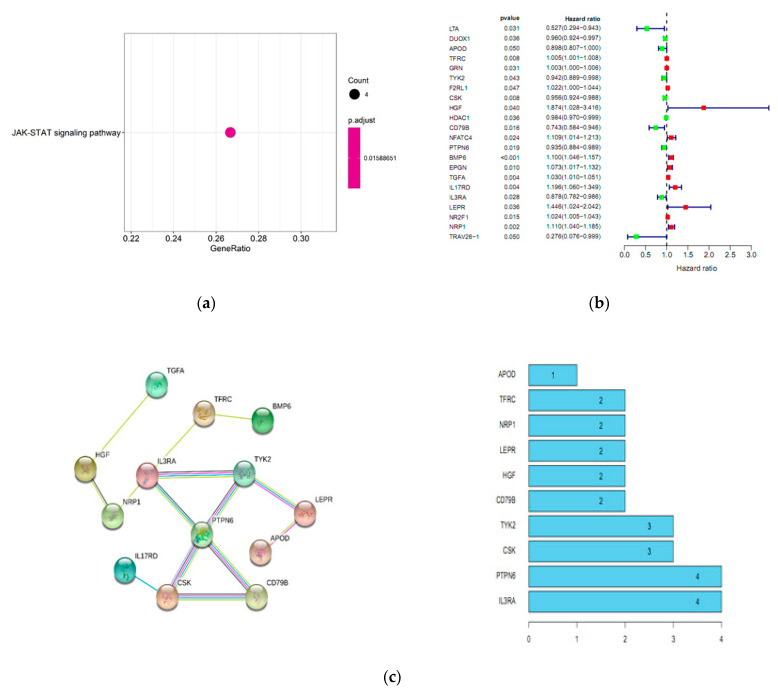
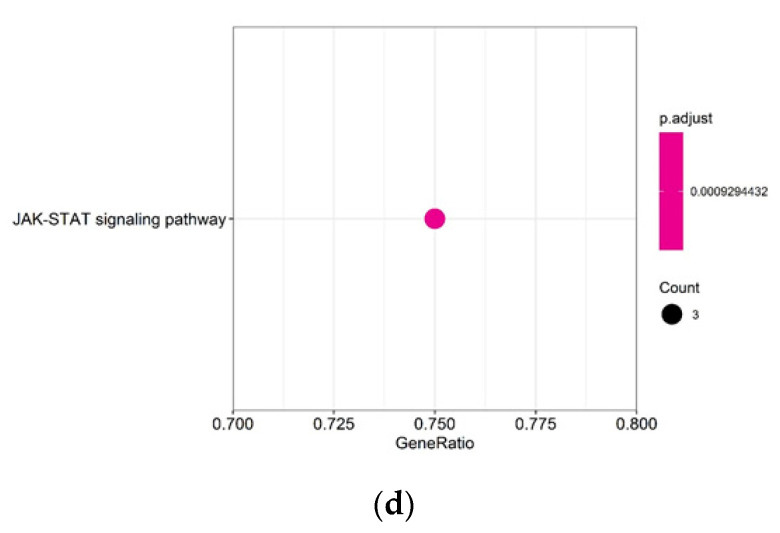
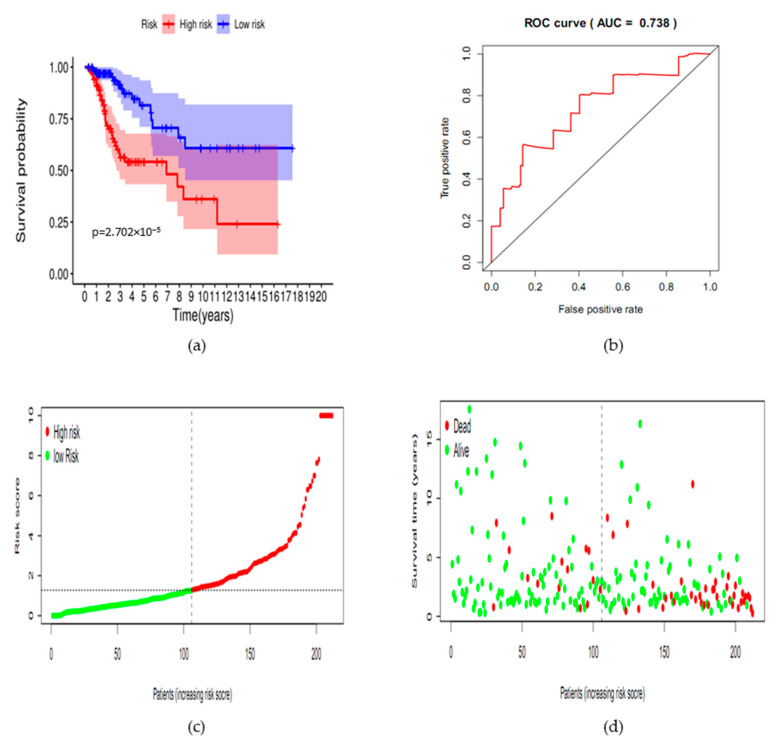
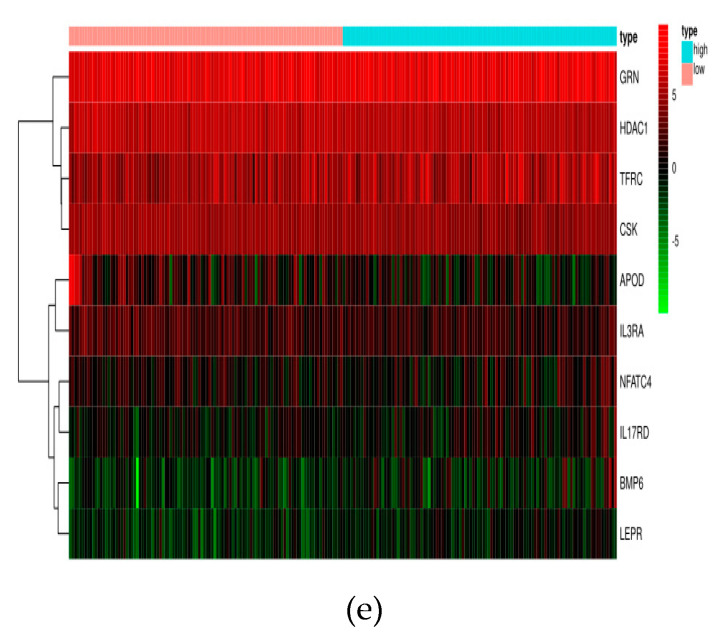
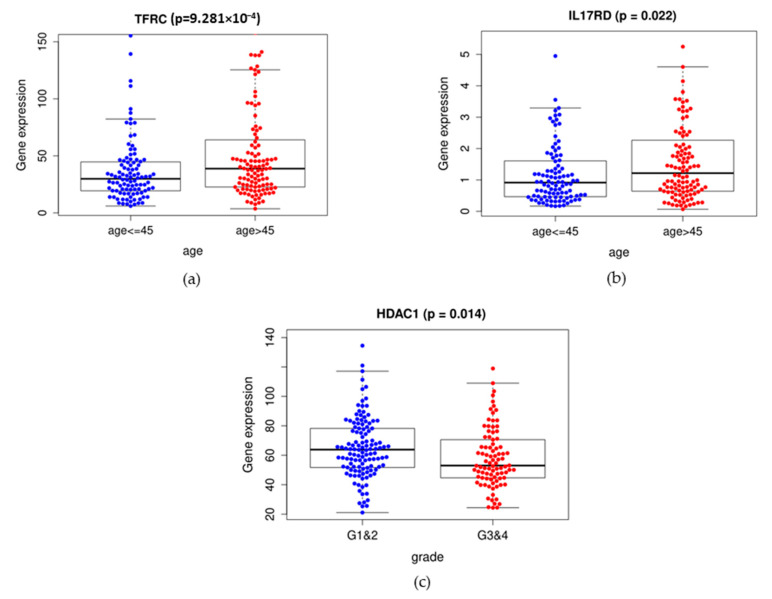
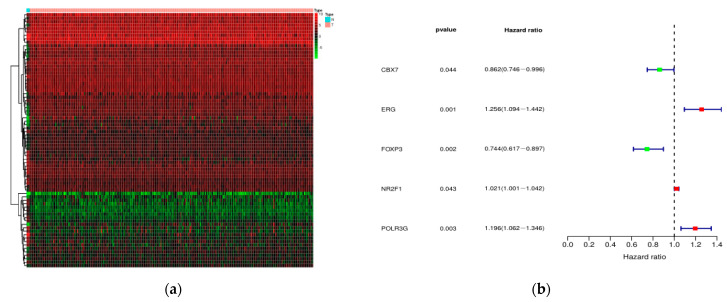
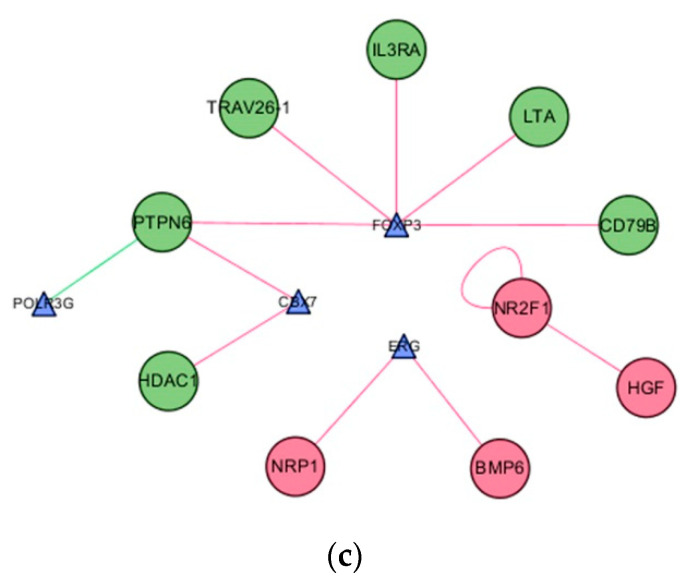
Cervical cancer is primarily caused by the infection of high-risk human papillomavirus (hrHPV). Moreover, tumor immune microenvironment plays a significant role in the tumorigenesis of cervical cancer. Therefore, it is necessary to comprehensively identify predictive biomarkers from immunogenomics associated with cervical cancer prognosis. The Cancer Genome Atlas (TCGA) public database has stored abundant sequencing or microarray data, and clinical data, offering a feasible and reliable approach for this study. In the present study, gene profile and clinical data were downloaded from TCGA, and the Immunology Database and Analysis Portal (ImmPort) database. Wilcoxon-test was used to compare the difference in gene expression. Univariate analysis was adopted to identify immune-related genes (IRGs) and transcription factors (TFs) correlated with survival. A prognostic prediction model was established by multivariate cox analysis. The regulatory network was constructed and visualized by correlation analysis and Cytoscape, respectively. Gene functional enrichment analysis was performed by Gene Ontology (GO) and Kyoto Encyclopedia of Genes and Genomes (KEGG). A total of 204 differentially expressed IRGs were identified, and 22 of them were significantly associated with the survival of cervical cancer. These 22 IRGs were actively involved in the JAK-STAT pathway. A prognostic model based on 10 IRGs (APOD, TFRC, GRN, CSK, HDAC1, NFATC4, BMP6, IL17RD, IL3RA, and LEPR) performed moderately and steadily in squamous cell carcinoma (SCC) patients with FIGO stage I, regardless of the age and grade. Taken together, a risk score model consisting of 10 novel genes capable of predicting survival in SCC patients was identified. Moreover, the regulatory network of IRGs associated with survival (SIRGs) and their TFs provided potential molecular targets.
Keywords: KEGG; TCGA; bioinformatics analysis; cervical cancer; tumor immune.
Conflict of interest statement
Sven Mahner reports grants and personal fees from AstraZeneca, personal fees from Clovis, grants, and personal fees from Medac, grants, and personal fees from MSD. He also reports personal fees from Novartis, grants and personal fees from PharmaMar, grants and personal fees from Roche, personal fees from Sensor Kinesis, grants, and personal fees from Tesaro, grants and personal fees from Teva, outside the submitted work. All other authors declare no conflict of interest.
Figures
Similar articles
-
A novel prognostic prediction model based on seven immune-related RNAs for predicting overall survival of patients in early cervical squamous cell carcinoma.BMC Med Genomics. 2021 Feb 15;14(1):49. doi: 10.1186/s12920-021-00885-3. BMC Med Genomics. 2021. PMID: 33588862 Free PMC article.
-
A Prognostic Model Based on the Immune-related Genes in Colon Adenocarcinoma.Int J Med Sci. 2020 Jul 19;17(13):1879-1896. doi: 10.7150/ijms.45813. eCollection 2020. Int J Med Sci. 2020. PMID: 32788867 Free PMC article.
-
A robust signature associated with patient prognosis and tumor immune microenvironment based on immune-related genes in lung squamous cell carcinoma.Int Immunopharmacol. 2020 Nov;88:106856. doi: 10.1016/j.intimp.2020.106856. Epub 2020 Aug 7. Int Immunopharmacol. 2020. PMID: 32777677
-
Identification of immune-related genes as prognostic factors in bladder cancer.Sci Rep. 2020 Nov 12;10(1):19695. doi: 10.1038/s41598-020-76688-w. Sci Rep. 2020. PMID: 33184436 Free PMC article.
-
Identification of immune-related cervical cancer prognostic biomarkers and construction of prognostic model based on tumor microenvironment.Eur J Med Res. 2025 Apr 9;30(1):261. doi: 10.1186/s40001-025-02515-5. Eur J Med Res. 2025. PMID: 40205481 Free PMC article.
Cited by
-
In silico research of coagulation- and fibrinolysis-related genes for predicting prognosis of clear cell renal cell carcinoma.Transl Androl Urol. 2025 Feb 28;14(2):307-324. doi: 10.21037/tau-24-483. Epub 2025 Feb 25. Transl Androl Urol. 2025. PMID: 40114841 Free PMC article.
-
Nodal staging score for adequacy of nodal staging in cervical cancer.Heliyon. 2024 Feb 8;10(7):e26116. doi: 10.1016/j.heliyon.2024.e26116. eCollection 2024 Apr 15. Heliyon. 2024. PMID: 38596019 Free PMC article.
-
Identification of 10 differentially expressed genes involved in the tumorigenesis of cervical cancer via next-generation sequencing.PeerJ. 2024 Oct 2;12:e18157. doi: 10.7717/peerj.18157. eCollection 2024. PeerJ. 2024. PMID: 39372720 Free PMC article.
-
Metabolism-Relevant Molecular Classification Identifies Tumor Immune Microenvironment Characterization and Immunotherapeutic Effect in Cervical Cancer.Front Mol Biosci. 2021 Jul 1;8:624951. doi: 10.3389/fmolb.2021.624951. eCollection 2021. Front Mol Biosci. 2021. PMID: 34277697 Free PMC article.
-
BMP6 ubiquitination mediated by SMURF1 suppresses ferroptosis and diminishes sensitivity to doxorubicin in gastric cancer.Gastroenterol Rep (Oxf). 2025 Jun 26;13:goaf051. doi: 10.1093/gastro/goaf051. eCollection 2025. Gastroenterol Rep (Oxf). 2025. PMID: 40584147 Free PMC article.
References
-
- Ahn K., Kweon S., Kim D.W., Lee H. Different expression of GSK3beta and pS9GSK3beta depending on phenotype of cervical cancer: Possible association of GSK3beta with squamous cell carcinoma and pS9GSK3beta with adenocarcinoma. Obs. Gynecol. Sci. 2019;62:157–165. doi: 10.5468/ogs.2019.62.3.157. - DOI - PMC - PubMed
-
- van Meir H., Kenter G.G., Burggraaf J., Kroep J.R., Welters M.J., Melief C.J., Van Der Burg S.H., IE Van Poelgeest M. The need for improvement of the treatment of advanced and metastatic cervical cancer, the rationale for combined chemo-immunotherapy. Anticancer Agents Med. Chem. 2014;14:190–203. doi: 10.2174/18715206113136660372. - DOI - PubMed
MeSH terms
Substances
Grants and funding
LinkOut - more resources
Full Text Sources
Other Literature Sources
Medical
Research Materials
Miscellaneous
