

Review
doi: 10.3390/gels7010019.
Luminescent Behavior of Gels and Sols Comprised of Molecular Gelators
Affiliations
- PMID: 33671130
- PMCID: PMC8005951
- DOI: 10.3390/gels7010019
Item in Clipboard
Review
Luminescent Behavior of Gels and Sols Comprised of Molecular Gelators
Gels.
.
Abstract
We present a brief review of some important conceptual and practical aspects for the design and properties of molecular luminescent gelators and their gels. Topics considered include structural and dynamic aspects of the gels, including factors important to their ability to emit radiation from electronically excited states.
Keywords: aggregation-induced emission enhancement (AIEE), quantum yield; excimer; fluorescence; gel; luminescence; molecular organic gelator (LMOG), hydrogel; phosphorescence.
Conflict of interest statement
The authors declare no conflict of interest.
Figures

Molecular structures of CAh and PySaGn (where n = 2,3,4,6,7,8) gelators.
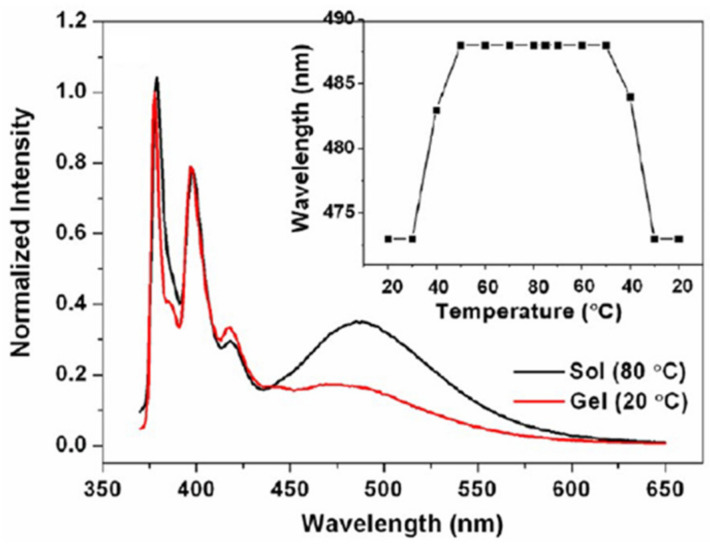
Fluorescence spectra (λex = 350 nm; intensity normalized at 378 nm) of 1.5% (2.6 × 10⁻² M) PySaG7 in acetonitrile in the gel (20 °C) and sol (80 °C; gel melting temperature, Tgel = 79 °C) phases. The inset shows the temperature-dependent wavelength maxima of the excimeric emission. Reprinted (adapted) with permission from [39]. Copyright (2013) American Chemical Society.

Molecular structure of (a) PtCD; (b) PtTEG; (c) and (d) formation of a PtCD-hydrogel and PtTEG-hydrogel and (e) photograph of the PtCD-hydrogel in daylight; scale bar = 1 mm. Republished from [42] with permission of Royal Society of Chemistry.

Molecular structures of 4PyCzBP, SiPhMe, PhAhFb and SA-Chol.

Conformational rotamers of SiPhMe. Republished from [55] with permission of Royal Society of Chemistry.

(a) Molecular structure of TPE-TPP; photo-luminescence spectra of TPE-TPP in solid and solution states. Inset: Photographs of a DMF solution (left) and a solid powder (right) of TPE-TPP taken under UV radiation. Concentration of TPE-TPP = 10 μM; λex = 321 nm. Fluorescent images of CCCP (10 μM) treated HeLa cells stained with (b) MT (50 nM) for 15 min and (c) TPE-TPP (5 μM) for 30 min. λex = 540−580 nm (for MT) and 330−385 nm (for TPE-TPP). Reprinted (adapted) with permission from [57]. Copyright (2013) American Chemical Society.

Molecular structures of TPEBe-I and PyFFK.

(a) Photographs of PyFFK gel-loaded wells of a multiwell plate in the presence or absence of different analytes under different lights. (b) Emission spectra of a gel sample in before and after treatment with picric acid (PA) solution (λex = 337 nm). (c) The extent of quenching of the 477 nm band in the emission spectra of the gel samples in the presence of different analyte solutions. (d) Photographs of PyFFK gel-loaded wells of a multiwell plate after treatment with solutions of different concentrations of PA under different lighting conditions. (e) Extent of quenching of the emission at 477 nm for samples in (d). All experiments were performed at room temperature. Reprinted (adapted) with permission from [63]. Copyright (2019) American Chemical Society.

(a) Molecular structures of the EFK-bpy peptide and the structures of the EFK-bpy-Eu peptide. (b) Proposed schematic representation of the co-assembled hydrogel and the energy-transfer process. (c) The fluorescence emission spectrum of the EFK-bpy hydrogel (λex = 300 nm; 4 mM), EuCl3 (λex = 300 nm; 1.33 mM) solution, and EFK-bpy-Eu hydrogel (λex = 300 nm; 1.33 mM). (d) The fluorescence emission spectrum of the EFK-bpy hydrogel (λex = 254 nm; 4 mM), EuCl3 (λex = 254 nm; 1.33 mM) solution, and EFK-bpy-Eu hydrogel (λex = 254 nm; 1.33 mM). Republished with permission of Springer Nature, from [65].

Structure of naphthalene diimide (NDI) and derivatives of it with potential photophysical, self-assembly, and functional properties. Reprinted (adapted) with permission from [67]. Copyright (2016) American Chemical Society.

Molecular structure of NDIP.

(a) Fluorescence spectra of NDIP xerogels upon exposure to different volatile acid vapors. (b) Fluorescence "turn on" of NDIP xerogels upon exposure to HCl vapor. (c) Fluorescence on/off behavior by exposure and evaporation of acid vapor using a paper strip impregnated with NDIP. (d) Fluorescence on/off switching upon exposure to TFA and ammonia vapors of the paper strip device impregnated with NDIP. (e) Fluorescence on/off cycle of NDIP in the presence of acid and base vapors. (f) Fluorescence spectra of NDIP in milli-Q water in different amounts (ppm) of trifluoroacetic acid (TFA). From [32]. Copyright Wiley-VCH GmbH. Reproduced with permission.

Molecular structures of DDOA, DDOT and DHDOT.

(a) Simplified representation of a doped DDOA gel fiber (enlargement of three layers of sheets of DDOA) is represented, one excited donor (light blue) and one emissive acceptor (green), as well as energy transfer pathways (E.T., yellow arrows) for the direct process (dotted arrow) and several possibilities for exciton migration. Right: Chemical structures of DDOA and DDOT (b) Emission spectra of DDOA (2.0 × 10⁻³ M) gels in DMSO at 293 K, λex = 384 nm with increasing amounts of added DDOT (mol %). Reprinted (adapted) with permission from [76]. Copyright (2005) American Chemical Society.

Syntheses of QAh and NAh. Republished from [77] with permission from the Royal Society of Chemistry.

Synthesis of PaCzBph. Reprinted from [78] with permission from Elsevier.

Synthesis of DODA [44]. Copyright John Wiley and Sons. Reproduced with permission.

Synopsis of the synthetic route to DtBuCZBP.

(a) Molecular structures of QA and ethynylpyrenyl derivatives of QA (P3QA, P3,8QA and P3,6QA). (b) Normalized fluorescence emission spectra of P3,6QA in the gel state (CGC concentration) in the absence of Zn2+ (red curve) and in the presence of 0.5 equiv. of Zn2+ (black curve) in acetone. Republished from [28] with permission of The Royal Society of Chemistry.
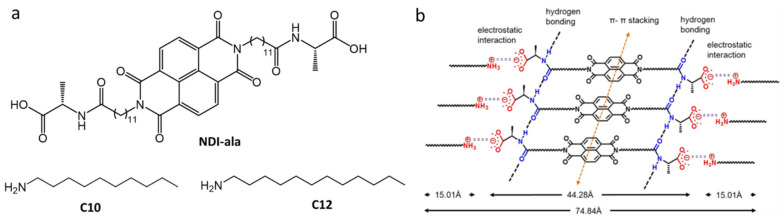
(a) Molecular structures of NDI-ala and amines, n-decylamine (C10) or n-dodecylamine (C12). (b) Tentative model (based on data from Fourier transform infrared (FTIR), PXRD, and SAXS) for the molecular packing arrangement of the two-component co-assembled system, NDI-ala12. The molecular length of C12 in its extended conformation was used to estimate the total length of NDI-ala12. Reprinted (adapted) with permission from [84]. Copyright (2016) American Chemical Society.

(a) Molecular structure of Azo-KC. (b) Photographs showing methyl orange removal from the H-gel upon irradiation at 365 nm and induced syneresis. (c) UV-vis spectra of methyl orange and the expelled water from (b). (d) Maximum concentrations of different dyes, which can be removed completely during syneresis of the hydrogel (1.15%). All measurements were carried out at room temperature. Republished from [85] with permission of The Royal Society of Chemistry.

Molecular structures of PBA, PDA and KS.

(a) Excitation and (b) emission spectra of a 5 wt% DODA in 1-octanol gel at 25 °C (solid line, λem = 458 nm, λex = 400 nm), sol at 45 °C (dashed line, λem = 481 nm, λex = 425 nm), and melt-solidified DODA at 25 °C (dotted line, λem = 458 nm, λex = 400 nm). (c) Dependence of the excitation wavenumber maxima on the inter-carbonyl dihedral angle of a series of α-diketo containing molecules at 25 °C in solution (solid squares; republished from [90] with permission of The Royal Society of Chemistry); a 5 wt% DODA in 1-octanol gel at 25 °C (open circle); a 5 wt % DODA in 1-octanol sol at 45 °C (open triangle). The range of multiple excitation maxima of the 5 wt % DODA in 1-octanol sol is indicated by the curve between the two open triangles. (d) excitation, and (e) emission spectra at 25 °C of gels of 5 wt % DODA in 1-octanol after incubating the sols at 0 °C (dotted line, λem = 458 nm, λex = 400 nm), 30 °C (solid line, λem = 458 nm, λex = 400 nm), and 45 °C (dashed line, λem = 481 nm, λex = 425 nm). Reproduced with permission from [44]. Copyright John Wiley and Sons.

Structures of salts examined as metallo gelators derived from DODA. Republished from [91] with permission of The Royal Society of Chemistry.

(a) 2D packing diagram of DODA viewed perpendicular to the polymethylene chains; the red dashed lines indicate the positions of H-bonds; (b) a 2D packing diagram of DODA viewed along the axis of the polymethylene chains; the blue dashed lines indicate dipole–dipole interactions. Reproduced from [44] with permission. Copyright John Wiley and Sons. (c) Schematic representation of proposed molecular packing arrangements and proposed mechanisms for mechano-destruction and reformation of self-assembled fibrillar networks in the DODA-Ni·H2O gels. Republished from [91] with permission of The Royal Society of Chemistry.

(a) Structure of TPE-Chon (n = 1,4,5,6). (b) UV−vis absorption spectrum of 1 × 10⁻⁴ M TPE-Cho5 in dichloromethane. (c) Emission spectra (λex = 355 nm) of 1 × 10⁻⁴ M TPE-Cho5 in different acetone:water mixtures. (d) Images under 365 nm radiation of TPE-Cho5 in acetone:water mixtures, with different water fractions, and SEM images of the aggregates at water contents equal to (e) 30%, (f) 90% and (g) 99%. Reproduced from [92] with permission. Copyright Wiley-VCH GmbH.

Molecular structures of CAC, CAMC and CAB.

(a) Molecular structure of CNC; (b) Avrami plot of fluorescence data according to the Avrami equation (slope = 1.08 (R2 = 1.00)). Inset: Plot of emission intensity (λem = 375 nm; λex = 318 nm) from a 1.0 wt % CNC in n-octane sample incubated at 1.1 °C. Reprinted (adapted) with permission from [95]. Copyright (2005) American Chemical Society.
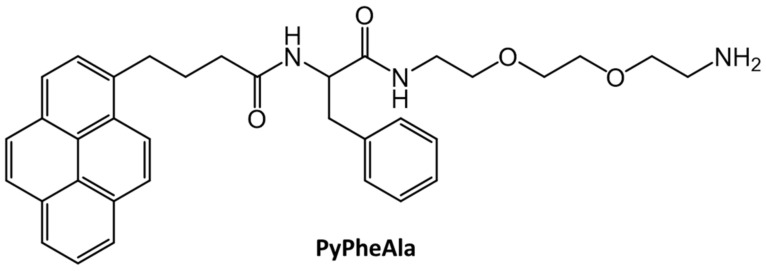
Molecular structure of PyPheAla.

Molecular structure of CnOBC and Fmoc-AA-Car.
References
-
- Mondal S., Bairi P., Das S., Nandi A.K. Phase selective organogel from an imine based gelator for use in oil spill recovery. J. Mater. Chem. A. 2019;7:381–392. doi: 10.1039/C8TA09732A. - DOI
-
- Turro N.J., Ramamurthy V., Scaiano J.C. Principles of Modern Molecular Photochemistry: An Introduction. University Science Books; Sausalito, CA, USA: 2010.
Publication types
Grants and funding
LinkOut - more resources
Full Text Sources
Other Literature Sources
